2012 IRIS Workshop
Lithosphere-asthenosphere Boundary Resolved with Seismic Surface Waves
Sergei Lebedev: Dublin Institute for Advanced Studies/IRIS Consortium, Stefan Bartzsch: Friedrich Schiller University of Jena, Thomas Meier: Christian Albrechts University of Kiel
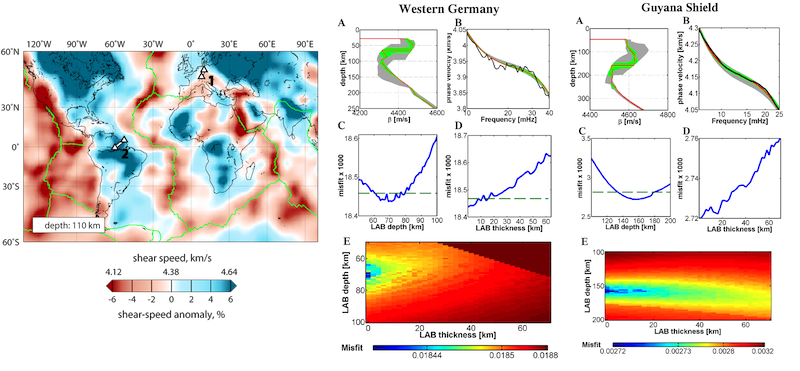
Left: Rayleigh-wave phase velocities measured along the two interstation paths were inverted for LAB properties. 1: western Germany; 2: the Guyana Shield. The background shows shear wave speeds at a 110 km depth (Lebedev & van der Hilst, 2008); according to the large-scale tomography, western Germany is characterized by relatively thin and the Guyana Shield - by thick lithosphere. Center, right: accurate, model-space-map inversions of phase-velocity curves for the LAB depth and thickness.
Full-resolution graphics file in original format: 0020.gif
Seismic surface waves offer tight constraints on shear wave speed values within the lithosphere and asthenosphere. It has been a matter of debate, however, how accurately and under what conditions surface waves can resolve the depth and thickness of the lithosphere–asthenosphere boundary (LAB). We investigated the sensitivity of Rayleigh waves to LAB properties and found that if the LAB is associated with a 2–3 per cent shear speed reduction, then 10–20 km variations in its depth translate into phase-velocity changes of up to 1 per cent. Variations in the thickness of the LAB from zero to a few tens of kilometres cause much smaller phase-velocity changes (≥0.1 per cent). We introduce a grid-search inversion of phase-velocity curves for the LAB depth and thickness, defining them for the purposes of the inversion as the middle and the width, respectively, of a depth interval with a linear shear-speed decrease in it. The inversion comprises dense sampling of the LAB depth-LAB thickness parameter plane and non-linear, gradient-search inversions at every point; it accounts for any trade-offs of the LAB parameters with shear speed variations above and below the LAB. The inversions show that the two parameters have uncorrelated uncertainties, with the LAB depth constrained better than its thickness. Random errors in phase-velocity measurements have a limited effect on LAB-depth measurements, causing errors of only a few kilometres. Applying our method to phase-velocity data measured in Phanerozoic west-central Germany, we locate the middle of the shear-speed reduction at the bottom of the lithosphere in the 60–80 km range, with minimum misfits near the 70-km depth. Beneath the Archean Guyana Shield, we determine a 140–175 km LAB-depth range, with a 160 km best-fitting (mid-)LAB depth.
Acknoweldgements: This work was supported by Science Foundation Ireland (grant 08/RFP/GEO1704).
For further reading: Bartzsch, S., S. Lebedev, and T. Meier (2011), Resolving the lithosphere-asthenosphere boundary with seismic Rayleigh waves, Geophys. J. Int., 186, 1152-1164, doi: 10.1111/j.1365-246X.2011.05096.x. Lebedev, S., and R. D. van der Hilst (2008), Global upper-mantle tomography with the automated multimode inversion of surface and S-wave forms, Geophys. J. Int., 173, 505-518, doi:10.1111/j.1365-246X.2008.03721.x. doi: 10.1111/j.1365-246X.2008.03721.x
Keywords: