2012 IRIS Workshop
Rayleigh Wave Tomography in the Northeastern Tibetan Plateau
Lun Li: University of Houston, Aibing Li: University of Houston, Yang Shen: University of Rhode Island, Eric A Sandvol: University of Missouri, Danian Shi: China Academy of Geological Sciences, Hongyi
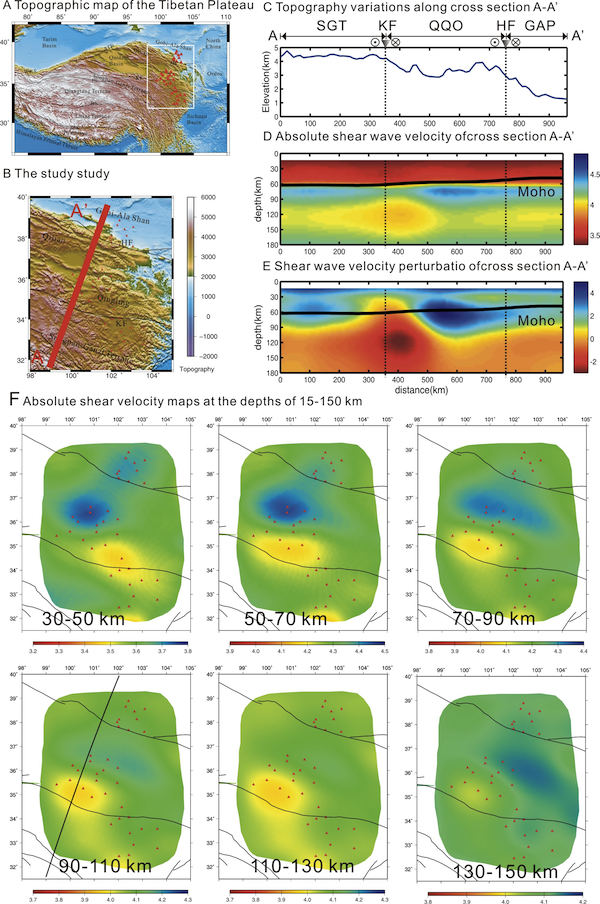
A. Tectonic and topographic map of Tibet. Red triangles are stations. IZS, Indus-Zangbo Suture; BNS, Bangong-Nujiang Suture; JS, Jinsha Suture; KL, Kunlun Fault; WKS, West Kunlun Shan; ATF, Altyn Tagh Fault; HF, Haiyuan Fault. B. Topographic map of the study area. C. Topography variations along cross-section A-A’. SGT, Songpan-ganzi Terrance; QQO, Qingling-Qilian Orogen; GAP, Gobi-Alashan Platform. D. Absolute Vs. E. Vs perturbation. F. Absolute Vs maps at the depths of 30-150 km.
Full-resolution graphics file in original format: 0046.jpg
Northeatern Tibet is an importance place for understanding the growth of the Tibetan plateau and its eastward extrusion. To distinguish the models responsible for the development of the northeastern Tibet and understand the role of strike-slip fault (e.g. Kunlun fault) on accomodating the convergence between India-Asia collision, we have analyzed Rayleigh wave data recorded by the Northeast Tibet Seismic (NETS) array and applied the Two-Plane-Wave (TPW) tomogrpahy method to compute average and 2-D phase velocities using vertical component seismograms at 14 frequencies from 76 events at 36 stations. Pronounced low velocities appear along the Kunlun fault in the lower crust and continues to at least 150 km deep (Figure F). The most pronounced anomalies are lower velocities of ~-2% observed right beneath the eastern Kunlun fault (Figure E), probably indicating significant high thermal anomaly. Consider smearing in the model, we estimated the width of the remarkable low velocity anomaly (i.e. < -2%) is 100 km at a depth of 90 km reaching to 150 km (Figure D and E). The low velocities become narrowing and shifting a little westward with increasing depth. The high velocity anomalies are observed in the middle and north of the study area coresponding to North Qianlian and Gobi-Ala Shan Platform, respectively. The high velocities continue to the depths of 130-150 km (Figure F), although the magtitude and range of high velocity anomalies decrease with depth. This velocity model can provide insights into the role of the Kunlun fault in accommodating the deformation and rising of the northeastern Tibet.
Acknoweldgements: The seismic data used in this study were obtained from the Incorporated Research Institution for Seismology Data Management Center. We thank the participants in Northeast Tibet Seismic (NETS) network for collecting the data. Most figures in this paper were made with the Generic Mapping Tools [Wessel and Smith, 1998]. This study is supported by NSF grant EAR-0738879.
Keywords: rayleigh_wave_tomography, northeastern_tibetan_plateau