2012 IRIS Workshop
Seismic Evidence for 3D Decompression Melting at the Cascadia Subduction Zone
Haiying Gao: University of Rhode Island, Yang Shen: University of Rhode Island
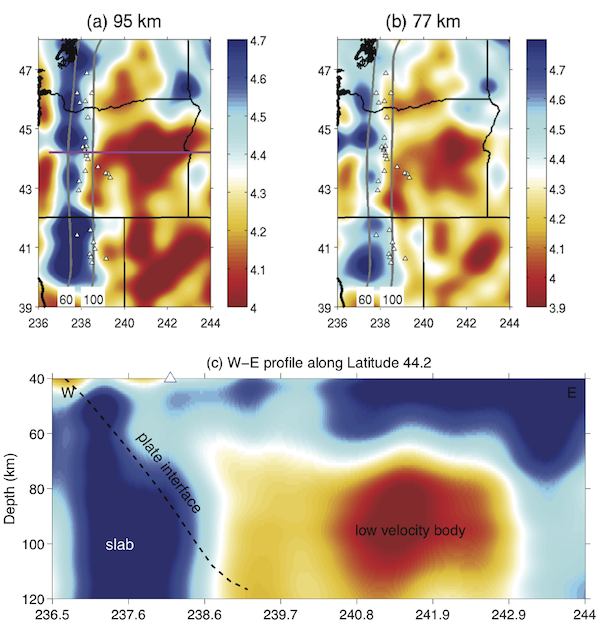
Figure 1. Segmented low-velocity volumes in the Cascades back-arc from full-wave ambient-noise tomographic imaging. Color bar indicates low (red) and high (blue) velocity in km/s. The white triangles are the Quaternary volcanoes. Two depth contours of the Juan de Fuca plate interface are included (gray lines). (a)-(b), The seismic velocity at the back-arc is abnormally low, ~3.8 km/s. The magenta line in Fig. 1a marks the profile location in Fig. 1c. (c) W-E vertical profile, showing the shear-wave velocity. The dashed black line is the plate interface. The white triangle is the volcanic center.
Full-resolution graphics file in original format: 0054.png