2012 IRIS Workshop
The Lithosphere-Asthenosphere Boundary Beneath California
Heather Ford: Brown University, Karen Fischer: Brown University, Vedran Lekic: University of Maryland
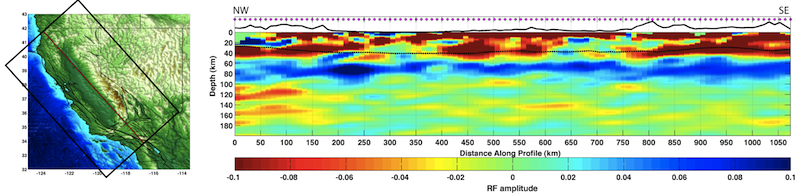
(Left) Study region with location of profile shown on right. (Right) Profile through 3D common conversion point stack of Sp receiver functions. The phase at depths of 60-80 km (blue) indicates a shear velocity decrease with depth and is consistent with the lithosphere-asthenosphere boundary. At 25-40 km, the red phase (a velocity increase with depth) is thought to be the Moho. The dashed line indicates Ps Moho depth from Lowry and Perez-Gussinye (2011).
Full-resolution graphics file in original format: 0055.jpg
Sp common conversion point (CCP) stacked receiver functions were calculated throughout a region encompassing the boundary between the Pacific and North American Plates (see figure, left). Preliminary results show evidence for a velocity decrease at depths of approximately 50 to 100 kilometers, consistent with the transition from high velocity lithosphere to slower asthenosphere seen in surface wave tomography. Rapid variations in the depth of the lithosphere-asthenosphere boundary (LAB) on the order of 25 to 50 km occur in some regions, such as southern California. However, over most of the study region the depth of the LAB varies gradually. A striking feature of the CCP stacked Sp receiver functions is that the amplitude of the LAB phase changes across the plate boundary over most of the study region north of the western Traverse Range (~35č_S). A strong LAB phase, indicative of a large and/or rapid drop in shear velocity, is observed east of the plate boundary (as shown in the figure), while a significantly weaker phase, which implies a smaller change in velocity or a more gradual drop in velocity, is observed to the west of the plate boundary. The strong correlation between the amplitude change and the location of the San Andreas and adjacent faults suggests that the physical properties of the lithosphere and/or asthenosphere vary across the plate boundary. A possible explanation is that lithospheres with different mantle seismic velocities have been juxtaposed against each other due to the relative motion of the Pacific Plate and North American plates. This result is consistent with the presence of a well-defined plate boundary that extends through the entire depth of the mantle lithosphere.
Acknoweldgements: This research was partially support by the NSF EarthScope Program under award EAR-0641772. We thank the IRIS Data Management Center, the Southern California Earthquake Data Center and the Northern California Earthquake Data Center for the waveform data used in this project.
Keywords: lithosphere-asthenosphere_boundary, california, sp_receiver_functions