2012 IRIS Workshop
Microseisms from 2009 Hurricane Ida Recorded Across the Transportable Array
Oner Sufri: University of Utah, Keith D. Koper: University of Utah
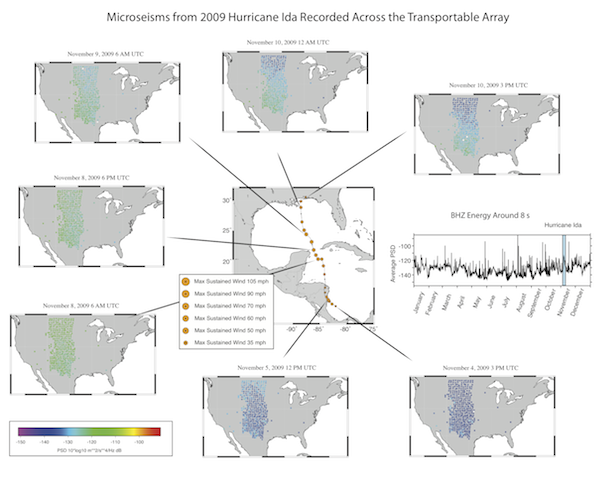
The middle figure shows the path of Hurricane Ida with orange circles representing the maximum sustained winds. The little arrows and lines connecting circles indicate the direction the hurricane moved. Going clockwise, the maps show the observed microseismic power for the BHZ components of the USArray stations at specific times. The figure at the middle right shows the calculated average power spectral density of BHZ components of the USArray stations for each hour shown as a function of time.
Full-resolution graphics file in original format: 0063.png
We analyze the spatial properties of the Earth’s ambient noise field at frequencies of 0.0006-10 Hz recorded by Earthscope Transportable Array (TA) stations in the year of 2009. We downloaded continuous three component seismograms from 585 stations, which were active during 2009. First, we formatted the data into one-hour long SAC binary files and then we processed the data for polarization anaylsis. We determined frequency-dependent eigenproperties of the 3-by-3 spectral matrix for each hour of data at each station. We have created two sets of year-long animations for the periods of 1, 2, 5, 8, 10, 20, 50, 100, 200, 500, 1000, and 1600 sec showing the noise properties averaged over each hour as a function of space. We found that the average power spectrum densities (psd) for the long periods (200, 500, 1000, 1600 seconds) have similarities. The psd value range for those longer periods is small for the first quarter of the year of 2009. However, the psd value range is larger for the second quarter of 2009, and the whole month of August, 2009. We also compared the average psds for the periods of surface waves (5,8,10, and 20 sec). We discovered that dominant 5-second and dominant 8-second periods are considerably sensitive to the tropical storms occurred during the year of 2009 while the dominant 10-second and dominant 20-second periods are more sensitive to the earthquakes that occurred in 2009.For further analysis, we studied four hurricanes; two from the Atlantic region (Hurricane Bill and Hurricane Ida) and two from the central Pacific region (Hurricane Jimena and Hurricane Rick) which had high average power spectrum density (psd) for dominant 8-second period across the TA stations. We examined how the average psd was affected by the maximum sustained winds and the distance between the center of the hurricane and the center of the USArrray stations.
Acknoweldgements: This project is funded by National Science Foundation (NSF). The NSF award number for the project is EAR-0951558.
For further reading: Koper K.D, and V.L. Hawley (2010), Frequency dependent polarization analysis of ambient seismic noise recorded at a broadband seismometer in the Central United States, Earthquake Science, 23 (5),439-447. doi: 10.1007/s11589-010-0743-5
Keywords: microseism, hurricane