2012 IRIS Workshop
West of Mississippi River Ps/Sp Images from EarthScope-PASSCAL Data: Taxonomy of LAB and MLD Negative Velocity Gradients and Interpretation of the MLD as a Metasomatic Freezing Front
Joe McClenahan: University of Wyoming, Ken Dueker: University of Wyoming, Katie Foster: University of Wyoming, Steve Hansen: University of Wyoming, Brandon Schmandt: California Institute of Technology
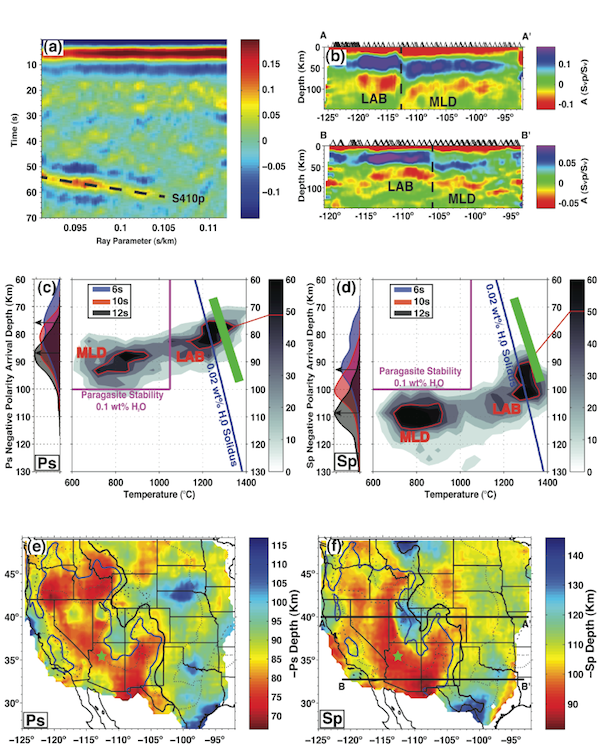
Ps/Sp analysis of negative polarity arrivals (NPA). (a) Sp ray-parameter-time image; Schmandt et al., 2012 has Ps results. (b) Sp sections: mid-lithospheric (MLD) and lithosphere-asthenosphere (LAB) labels. (c) Ps and (d) Sp NPA depth-temperature histograms with wet solidus curve and P-T measurements (green line) from Grand Canyon Olivine Melt inclusion tephra (T. Plank). (e) Ps and (f) Sp NPA depth maps with black (<950° C) and blue (>1150° C) thermal contours and green star at tephra site.
Full-resolution graphics file in original format: 0066.jpg
A multi-channel (1200 channels) deconvolution (Hansen and Dueker, 2010) has produced coherent Sp/Ps images from EarthScope/PASSCAL data (Fig. a,b and Schmandt et al., 2012). A primary conclusion from our analysis is that the negative polarity arrival (NPA) depths east of the <950° C contour manifest a subsolidus metasomatic freezing front (Fig. c,d) that has accumulated high modal concentrations of low velocity metasomatic minerals over Ga scale. Candidate phases that have freezing fronts at 110-80 km are Pargasite or Carbonatite. Given that the cold-region NPA are internal to a >150 km thick pre-Cambrian lithosphere (Shen and Ritzwoller, pers. com.), these NPA are denoted as mid-lithospheric discontinuities. We infer that this metasomatic layer has locally gone supersolidus to produce the Eocene to present alkaline volcanism that extends from Montana to New Mexico: e.g., volatile-rich Navajo Minette field in NE Arizona, Leucite Hills, Colorado Plateau alkaline magmas. The temperature field is produced by mapping Vsv tomogram (Shen and Ritzwoller, pers. com.) using olivine anelasticity (Jackson and Faul, 2011). In the >1150° C regions (Fig. e,f) the Ps/Sp NVG depths are <80/105 km. Given the measurement of the water content and temperature at the depth of last melt equilibration from olivine melt inclusion analysis (T. Plank, pers. com.) using cinder cones tephra (Fig. e,f), the NPA in this region is interpreted as the lithosphere-asthenosphere boundary. In the intermediate temperature region (1150°-950° C) within the Colorado Plateau and Colorado Rocky Mts, the metasomatic layer is either at or near its solidus depending on the local temperature and C02 and H20 fugacity. The frequency dependence of the Sp and Ps NPA depths (Fig. c,d) is modeled with reflectivity synthetics. Low pass filtered Ps/Sp volumes do not find a NPA at the base of the Great Plains lithosphere between 160-200 km depth contrary to previous earthquake waveform modeling.
For further reading: Hansen, S. and Dueker, K., P- and S-wave Receiver Function Image of Crustal Imbrication beneath the Cheyenne Belt in SE Wyoming, Bull. Seism. Soc. Am., 2009. Jackson, I., and U. Faul, Grain size-sensitive viscoelastic relaxation in olivine: Towards a robust laboratory-based model for seismological application, Phys. Earth Planet. Inter., 2010. Schmandt, B., Dueker, K, Humphreys, E., Hansen, S., Hot Mantle upwelling across the 660 beneath Yellowstone, EPSL, 2012.
Keywords: lithosphere-asthenosphere_boundary, mid-lithosphere_discontinuity