2012 IRIS Workshop
Comparison of Direct and Coda Wave Stress Drop Measurements for the Wells, Nevada, Earthquake Sequence
Rachel E. Abercrombie: Boston University
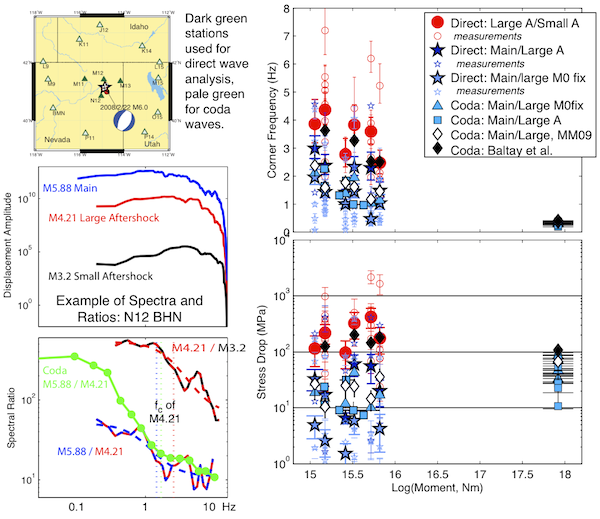
The map shows the Wells Nevada earthquake (M6, 2008, blue star), 6 large aftershocks (M4-5, red circles) and 6 empirical Green’s functions (EGF, black circles). Example S and coda wave (green) spectra and ratios are shown for the mainshock (blue), 1 large aftershock (red), and its EGF (black). The source parameters are calculated from the various spectral ratios using a variety of different methods; all stress drops are calculated using the Madariaga (1976) model.
Full-resolution graphics file in original format: 0096.ai
The controversy concerning earthquake self-similarity continues with some studies finding stress drop to decrease for smaller earthquakes, and others finding constant stress drop across the same magnitude range. It is not clear whether the different results are from studying different earthquakes, or using different methods. I analyse the Wells Nevada earthquake sequence to compare the results of various methods. I find that both coda and direct wave approaches give similar results, but that there is a systematic bias depending on whether the earthquake of interest is the larger or smaller in the spectral ratio. Mayeda & Malagnini (2009, GRL) calculated coda wave spectral ratios of the M6 mainshock to large (M4-5) aftershocks. They found that the large aftershocks have lower stress drops than the mainshock (white diamonds). For each large aftershock I select a closely located, correlated M~3 earthquake as an EGF, and calculate direct S wave spectral ratios between the large aftershocks and the EGF events. I also calculate direct wave spectral ratios between the mainshock and the large earthquakes but the EGF assumption is less good in these ratios. I model the direct wave ratios and calculate source parameters and uncertainties following Viegas et al. (2010, JGR): red circles are large aftershock/EGF, blue stars are mainshock/large aftershock; open symbols are individual station and component measurements, and solid symbols are the event means, with uncertainties from both fitting and interstation variability. I also fit the coda ratios calculated by Mayeda & Malagnini, but using the same approaches as for the direct wave modeling (blue triangles and squares). The estimates of corner frequency and stress drop are lower for the large aftershocks when they are in the denominator. These results are consistent with those of Baltay et al. (2010 JGR, black diamonds) who used coda waves, but corrected the spectral ratios by comparing to the smallest earthquakes.
Acknoweldgements: This material is based on research sponsored by the Air Force Research Laboratory, under agreement number FA8718-06-C-0024.
Keywords: stress_drop, scaling_source_parameters