2012 IRIS Workshop
SeismicCanvas: Interactive Software for Accessing and Analyzing Seismic Waveform Data
Glenn C. Kroeger: Trinity University, San Antonio, TX
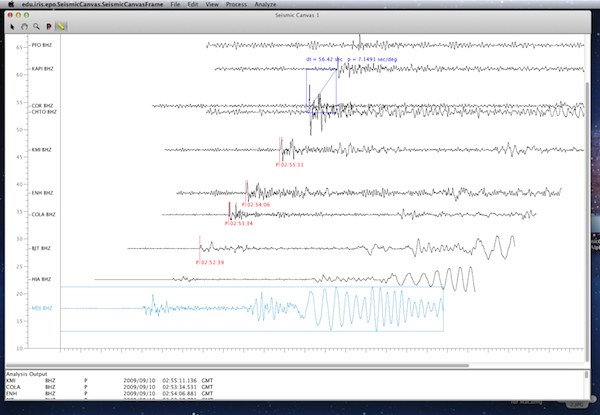
A beta version of SeismicCanvas is shown running on Mac OS X 10.7 (Lion). Seismograms are shown in an angular distance section view. Picks are shown in red. Direct measurement of time differences and ray parameter are shown in dark blue. The light blue seismogram is selected for direct manipulation. Text output from analysis operations is displayed in the bottom pane and is selectable, editable, and formatted for easy copy-and-paste into spreadsheet software.
Full-resolution graphics file in original format: 0119.tif
SeismicCanvas, a cross-platform, graphically interactive application for accessing, viewing and analyzing waveform data is presented. SeismicCanvas presents a user interface designed to support classroom and laboratory use by non-seismologists by minimizing the learning curve for non-seismologists. The user interface has been designed to parallel commonly used desktop software. The menu structure is patterned after familiar word processing and spreadsheet applications. The menu text avoids jargon and attempts to be simple and consistent. For example, “seismogram” is used rather than “trace” or “record”. Direct graphical interaction adopts the “select-then-operate” paradigm used in familiar desktop graphics and presentation software. Viewing options include arbitrary arrangement of traces and generation of seismic sections, spectra and spectrograms. Processing operations include windowing, filtering, stacking and tapering. Interactive picking, measurements of times, apparent velocities and slowness, amplitude extraction and WYSIWYG printing are included. SeismicCanvas can import data from local files or through the web services interfaces of the IRIS Data Services program. The application is implemented with a model-view-controller architecture in both Java and C++ (using the QT cross-platform application and UI framework). An open beta-test program will being later this year. We invite feedback including suggestions for changes to the interface or additional capabilities that will allow SeismicCanvas to meet the needs of classroom and laboratory use of digital seismic datasets.
Keywords: education, software, undergraduate, waveforms, web_services, cross-platform