How can I teach the difference between M 6 and M 9?
And how can uncooked spaghetti noodles help teach about the logarithmic nature of the magnitude scale?
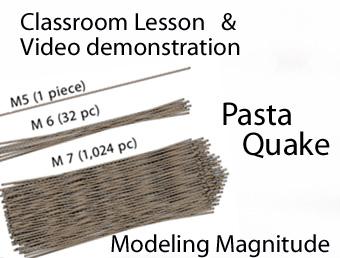
Understanding the magnitude change, thus the relative energy released from say, magnitude 7 to magnitude 8 can be challenging. Dr. Robert Butler (Univ. Portland) uses spaghetti to illustrate the concept by breaking pasta to show how each step up in magnitude represents a huge jump in the size of the pasta bundles. Each step in magnitude is represented by 32 times more spaghetti noodles.
In this video Dr. Butler rounded down to a factor of 30 to simplify the multiplication.
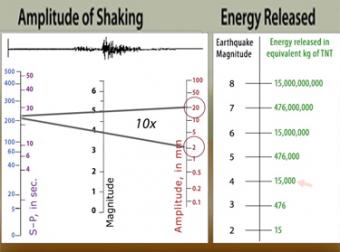
But, technically speaking, whole unit of magnitude represents approximately 32 times (actually 10**1.5 times) the energy, based on a long-standing empirical formula that says log(E) is proportional to 1.5M, where E is energy and M is magnitude. This means that a change of 0.1 in magnitude is about 1.4 times the energy release.
This explains why big quakes are so much more devastating than small ones. The amplitude ("size") differences are big enough, but the energy ("strength") differences are huge. The amplitude numbers are neater and a little easier to explain, which is why those are used more often in publications. But it's the energy that does the damage.
If one strand of pasta represents magnitude 5, how many pasta noodles represents:
Discovery

The "moment magnitude" scale has replaced the Richter scale for large earthquakes. Scientists have developed far-more sensitive seismometers that, with faster computers, have enabled them to record & interpret a broader spectrum of seismic signals than was possible in the 1930's, when the Richter magnitude was developed. Find out what scientists learn from seismograms.

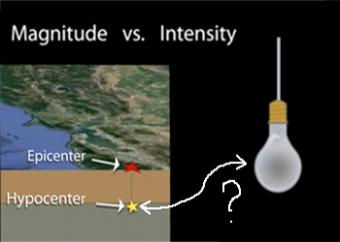
Earthquake intensity (what is felt during an earthquake at any given location) is often mistaken for earthquake magnitude (the instrumentally measured size of that earthquake). This animation describes the main factors that contribute to differing intensities using examples of earthquakes. Produced in collaboration with the U.S. Geological Survey.

Earth is an active place and earthquakes are always happening somewhere. In fact, the National Earthquake Information Center locates about 12,000-14,000 earthquakes each year! This fact sheet illustrates information on the frequency of earthquakes of various magnitudes, along with details on the effects of earthquakes and the equivalent energy release.
NOTE: Out of stock; self-printing only.

Learn about the earthquake magnitude scale and changes in the amount of energy released at each step by breaking different size bundles of uncooked spaghetti noodles! Students can both see and feel the differences in the energy released from a M4 - M8 quake.