


A seismogram is a record written by a seismograph in response to ground motions produced by an earthquake, explosion, or other ground-motion sources.
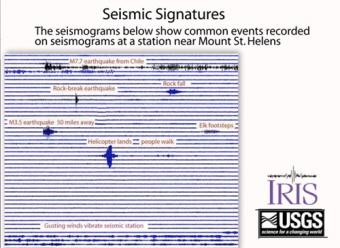
Seismograms of common events are compiled to show the different seismic signals recorded by ground-shaking events. Seismograms can record everything from nearby earthquakes to earthquakes on the other side of the world, plus anything that shakes the ground near the seismograph station like people walking, elk running, rocks falling and helicopters landing.
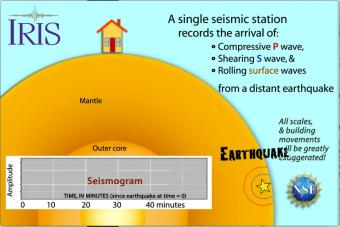
Seismic waves travel through the earth to a single seismic station. Scale and movement of the seismic station are greatly exaggerated to depict the relative motion recorded by the seismogram as P, S, and surface waves arrive.
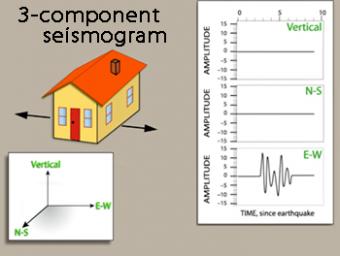
We use exaggerated motion of a building (seismic station) to show how the ground moves during an earthquake, and why it is important to measure seismic waves using 3 components: vertical, N-S, and E-W. Before showing an actual distant earthquake, we break down the three axes of movement to clarify the 3 seismograms.
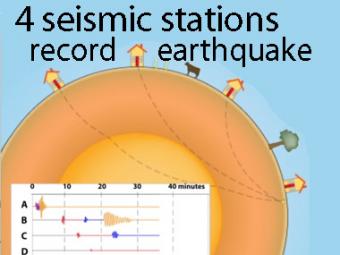
A cow and a tree in this narrated cartoon for fun and to emphasize that seismic waves traveling away from an earthquake occur everywhere, not just at seismic stations A, B, C, and D. A person would feel a large earthquake only at station A near the epicenter. Stations B, C, D, and the cow are too far from the earthquake to feel the seismic waves though sensitive equipment records their arrival.
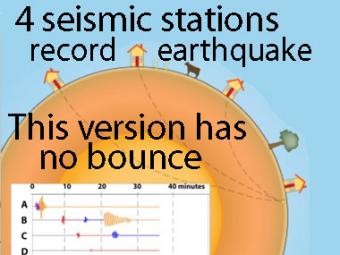
This companion to the animation "Four-Station Seismograph network" shows the arrival of seismic waves through select wave paths through the Earth (P and S waves) and over the surface of the Earth. The movement at distant stations occurs at a microscopic scale. While that doesn't result in noticeable movements of the buildings, the arrivals are recorded on sensitive seismometers.
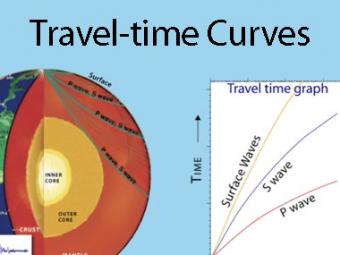
A travel time curve is a graph of the time that it takes for seismic waves to travel from the epicenter of an earthquake to the hundreds of seismograph stations around the world. The arrival times of P, S, and surface waves are shown to be predictable. This animates an IRIS poster linked with the animation.
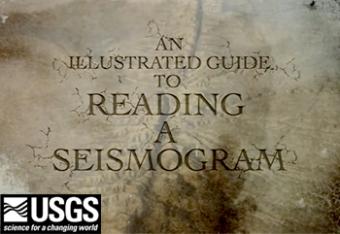
This USGS video provides a tutorial for anyone interested in interpreting the seismic records on public webicorder displays. Seismometers measure vibrations. More vibration… more wiggle. Some seismometers measure only up and down; some measure up-down, north-south, and east-west motion.
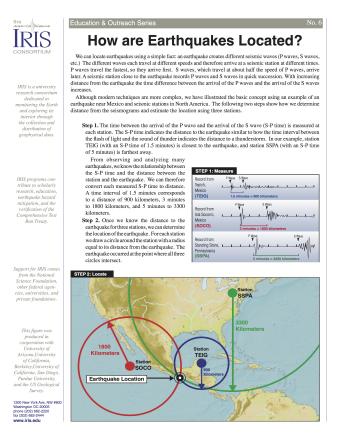
Knowing precisely where an earthquake occurred is an important piece of scientific information. It can help seismologists identify and map seismic hazards. It is also a fundamental piece of information necessary for facilitating studies of Earth's internal structures. This fact sheet provides an overview of the S-P process to locate an earthquake.
NOTE: Out of stock; self-printing only.


