Novice Spanish
We can locate earthquakes using a simple fact: an earthquake creates different seismic waves (P waves, S waves, etc.) The different waves each travel at different speeds and therefore arrive at a seismic station at different times. P waves travel the fastest, so they arrive first. S waves, which travel at about half the speed of P waves, arrive later. A seismic station close to the earthquake records P waves and S waves in quick succession. With increasing distance from the earthquake the time difference between the arrival of the P waves and the arrival of the S waves increases. This basic approach to locating quakes is illustrated using an example of an earthquake near Mexico.
NOTE: Out of stock; self-printing only.
Requesting Fact Sheets:
To request hardcopies of E&O materials, please send an email toEandOproduct@iris.edu with the following information:
PLEASE NOTE: Time-sensitive requests must be sent at least three weeks before the date they are needed. When e-mailing a time-sensitive request, please write "Time-Sensitive Request" in the subject line.
The arrival times of P and S waves are used to determine the distance to an earthquake using standard travel-time curves.
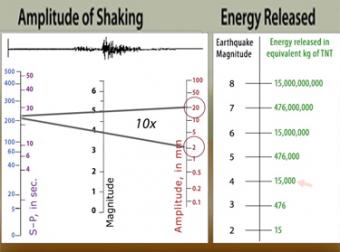
The "moment magnitude" scale has replaced the Richter scale for large earthquakes. Scientists have developed far-more sensitive seismometers that, with faster computers, have enabled them to record & interpret a broader spectrum of seismic signals than was possible in the 1930's, when the Richter magnitude was developed. Find out what scientists learn from seismograms.
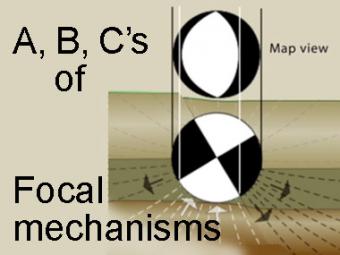
The focal mechanism of an earthquake is represented by a “beachball” diagram. These are released after an earthquake to illustrate the type of faulting produced the earthquake. This difficult concept is carefully explained using strike-slip, normal, and thrust faults.
GIFS for select segments included as optional download.
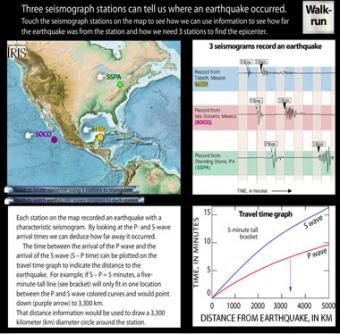
Each station on the interactive map recorded an earthquake with a characteristic seismogram. Roll over the stations to see the epicenter triangulated. Touch buttons to watch movie of seismic waves, or touch "Walk-run" button to see wave travel can be demonstrated with a class.
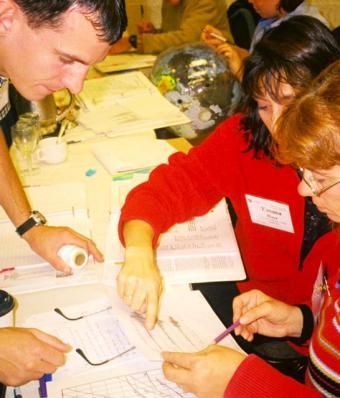
To understand plate tectonic processes and hazards, and to better understand where future earthquakes are likely to occur, it is important to locate earthquakes as they occur. In this activity students use three-component seismic data from recent earthquakes to locate a global earthquake.