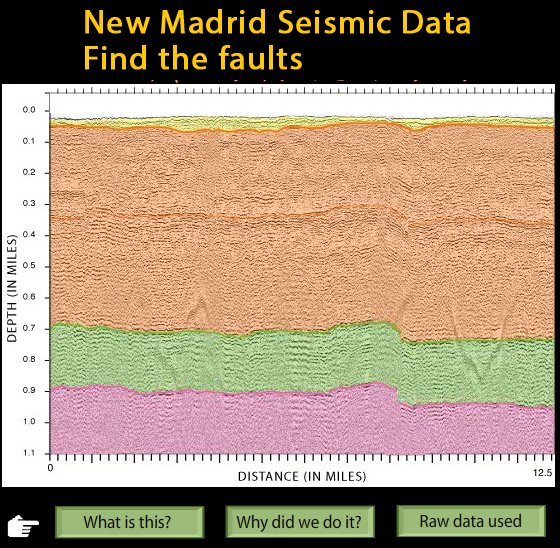
Raw seismic data gives us information about the ground beneath us. This interactive cross section shows faults beneath the New Madrid area.
The tabs above link to related interactives and animations.
VIEW the interactive in a separate tab, by clicking on "Open Resource" then scroll over named features. (Note some browsers lack the plugins for rollovers.)
IRIS may be discontinuing these interactive animations in 2020. This file is an HTML5 file that uses a browser to view.
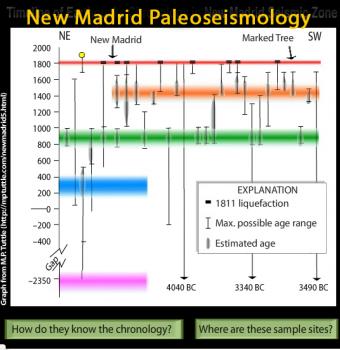
This interactive timeline shows that the 1811-12 earthquakes in New Madrid weren't the first.
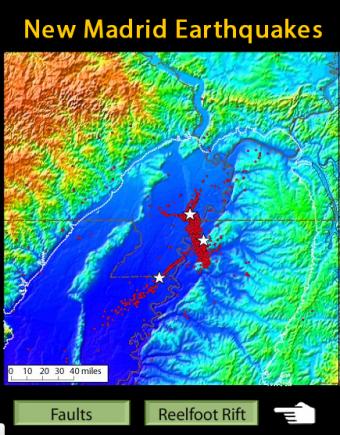
There are four major faults in and around the Reelfoot Rift related to earthquakes in the New Madrid area.
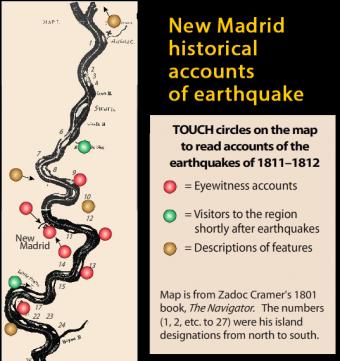
Many residents along the Mississippi experienced vigorous ground shaking and wrote about it in 1811 and 1812. Touch spots on map to read accounts of the devastation. For example, for spot #10, hover over the spot to watch an animation about how the river ran backwards (as witnessed by local residents.)
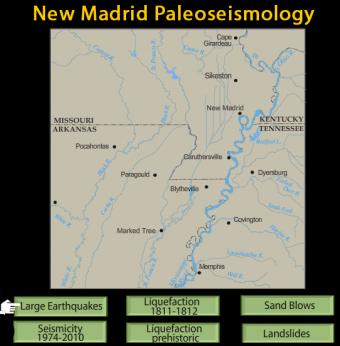
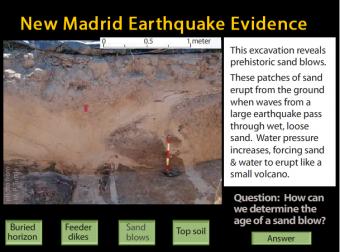
Learn about past large earthquakes, liquefaction, seismicity, sand blows, and landslides in this interactive map.
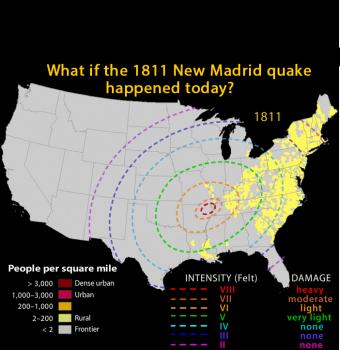
Scroll over the timeline from 1800 to 2010 to see the population of the United States grow to see what the impact of the 1811-1812 New Madrid earthquake would have today.