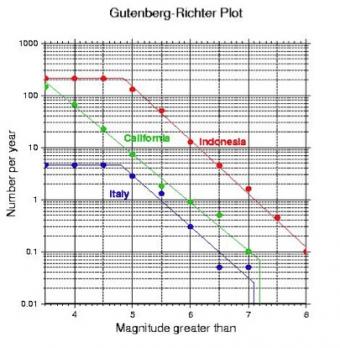
In this activity students explore the rate of earthquake occurrence for areas of Earth they choose to explore. Data is accessed through the simple interface of the IRIS Earthquake Browser (See Related Resources above). After compiling their data for various sized earthquakes, students calculate reoccurrence intervals for each magnitude and plot the data on a semi-log graph for interpretation. Discussions of the collected data touches on strengths and limitations of their data set, possible societal implications (e.g. building codes etc), as well as concepts related to earthquake prediction and forecasting.
Students will be able to:

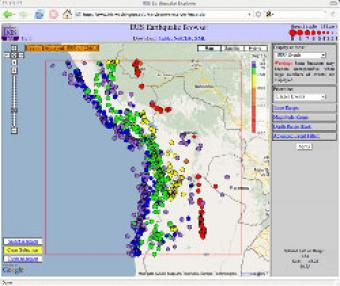
The IRIS Earthquake Browser (IEB) is an interactive tool for exploring millions of seismic event epicenters (normally earthquakes) on a map of the world. Selections of up to 5000 events can also be viewed in 3D and freely rotated with the 3D Viewer companion tool.

Earth is an active place and earthquakes are always happening somewhere. In fact, the National Earthquake Information Center locates about 12,000-14,000 earthquakes each year! This fact sheet illustrates information on the frequency of earthquakes of various magnitudes, along with details on the effects of earthquakes and the equivalent energy release.
NOTE: Out of stock; self-printing only.

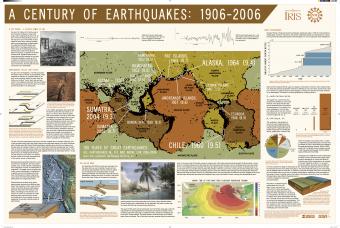
This poster outlines the lessons learned from the 1906 San Francisco earthquake and discusses 100 years of large earthquakes, including the Sumatra earthquake that caused a devastating tsunami.