Carolyn Nuyen

Carolyn Nuyen is a student at Colorado College currently completing her research at University of Southern California under Dr. Robert Porritt .
The objective of this project is to explore the interaction between the Yellowstone Hotspot and the North American lithosphere. Although the origin of the hotspot is still debated today, it is generally agreed upon that this feature is the manifestation of a mantle plume. Due to the relative motion of the North American Plate, the Yellowstone Hotspot has exhibited a northeasterly progression across Oregon, Idaho and Wyoming over the past 16 Ma. Currently the hotspot resides over the Archean age Wyoming Province in the northwest corner of Wyoming. This province is one of the oldest cratonic blocks in North American and as such, contains an immense amount of structural history from major geologic events. This summer I will be using data collected by the USArray in the Wyoming Province to image the region’s structure through joint inversion of P to S receiver functions with Rayleigh wave phase velocities and through a common conversion point stack of S to P receiver functions with the same dataset. Comparison of the two resulting 3-D datasets will allow me to make interpretations about the structures arising from initial province formation, accretion to North American, and recent deformation due to the Yellowstone Hotspot.
Lithospheric Deformation Along the Southern and Western Suture Zones of the Wyoming Province
August 7th, 2014
First and foremost, I am really really really sorry for how poorly I have maintained this blog over the past month. I am not really sure what came over me, but blogging kind of fell on the backburner as of late. Anyways, here is what I have been doing since July 3. Sheesh!
Once I finished sifting through all of the S traces, I then had to perform a bulk time shift for all of the traces for each event to account for time delays between stations. When that was finished the script created a receiver function for each trace and then sorted all of the receiver functions by station. I then had to go through and edit these receiver functions, throwing out ones that had bad or nonexistent Moho signals. At this point the data was ready for CCP stacking and I pretty much just sat back and let Matlab do its thing. Except not really. There were some issues with my computer not having a Matlab mapping toolbox, but in the end we were able to download some replacements off of the interwebs that worked just fine.
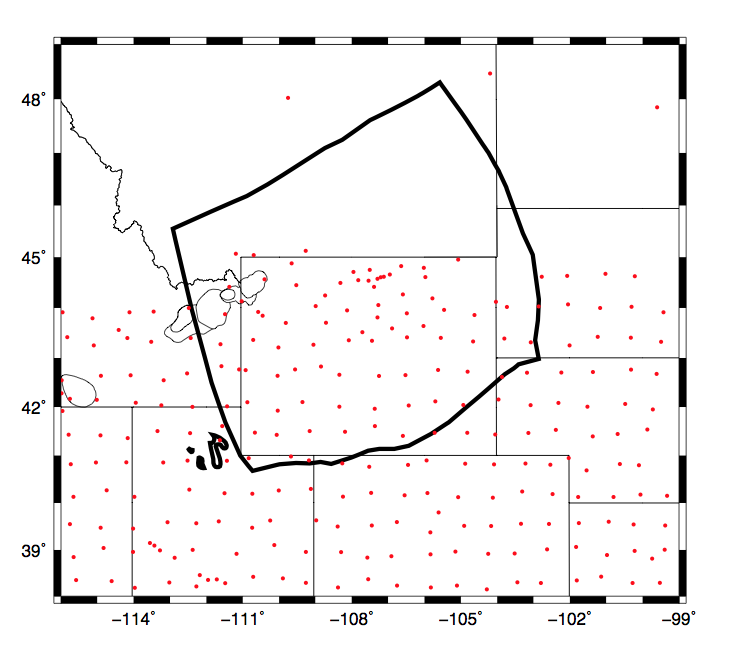
When I was able to finally look at the CCP images there was definitely something strange going on. Long story short, there did not seem to be any data for the top half of my study region. After some detective work, I realized that somehow half of my stations did not make it through the CCP calculations and that my station coverage looked like this:

If I had had another month or so at USC, then I would have delved deeper into this mystery, but limited time forced me to let the issue go. Luckily there was still a lot going on in the region that did have data that I could work with.
Back at the ranch, my P receiver function finally finished and I was able to start the joint inversion using this data and the surface dispersion data. For the sake of time, Rob and I changed the number of iterations from something like 29 to 7. We also split up the stations so that Rob could run the code for half of the stations on his computer and my computer would handle the other half. In the end it took a couple of days for all of the stations to be finished. Unfortunately, once I looked at the finished data it did not really make much sense: there were weird slow velocity pockets directly over the Yellowstone Hotspot and the overall velocity gradients looked random and patchy. In the end we are thinking that maybe we did not perform enough iterations to produce reliable data. Once again, if I would have had another month at USC, then I would have redone the joint inversion code with all of the 29 itereations, but time was not on my side. Since the joint inversion data was not looking reliable, I decided to use the surface wave dispersion data instead.
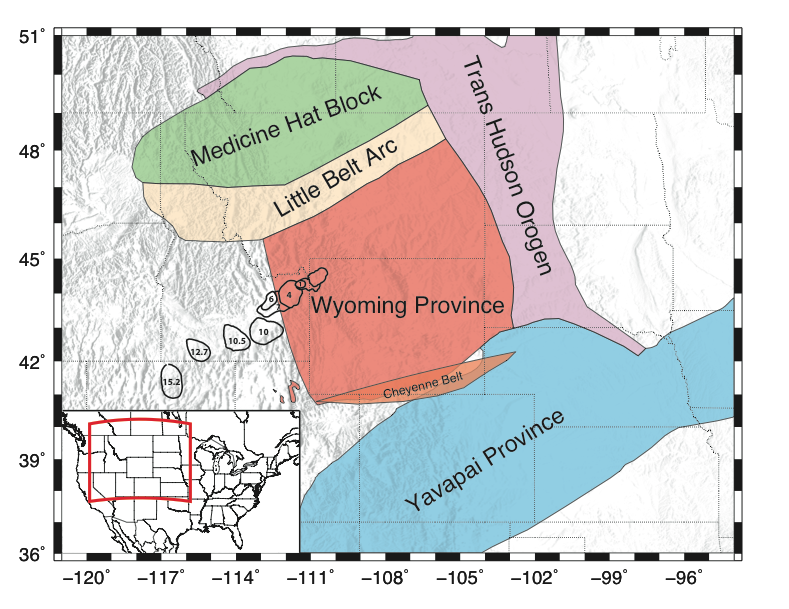
At this point I was ready to interpret my CCP and surface wave dispersion data! I decided to focus on the western and southern borders of the Wyoming Province, because they are sutures from the early formation of the North American continent. Below is a map of my study area. I have never taken a tectonics class or any geology class that has focused on such large-scale processes and earth dynamics, so Rob’s and Leland’s advice/help/input was invaluable.

(I am planning on putting this map on my AGU poster for the regional background section. All of the different provinces are outlined, shaded and colored and the Yellowstone Hotspot track is shown moving through the Wyoming Province with caldera ages listed in Ma. The inset in the bottom left corner gives a more general idea of where my study area is within the US.)
Then came my last day at the office. I was really sad when I started cleaning out my desk and setting up my computer so that I could remotely access my computer at USC, because it started to hit me that I was not coming back in the morning. I said my goodbyes to some people in the office and some people later that night when Eagle Freedom took flight. All in all it was a very bittersweet day.
Now I am at home in Seattle, having submitted my AGU abstract yesterday (the title of this blog post). Looking back this whole experience has been such a blast: meeting everyone and making friends at New Mexico Tech, getting to USC and finally realizing what I had gotten myself into, watching world cup (Columbia why????????), going to the beach, watching Dodger’s games, Sharkeez, reconnecting with old friends, making new friends, learning the hard way how not to get your wallet stolen, fighting with Matlab, loving Matlab, learning my way around a computer, and, last but not least, SCIENCE. Over the past two months I feel as if I have taken crash courses in computer science, seismology, wave theory, and tectonics and have learned more than I could have ever expected. Yesterday I also bought a GRE study book, so I guess you could say I am applying to grad school! I definitely did not see myself typing that last sentence a year ago, but this internship has showed me all of the possibilities that grad school can offer me and how much more there is to learn.
A big thank you to Meghan, Rob, Leland, Doayuan, Cooper, and Amber for showing me your work and letting me show you mine every week; it was really great to work with all of you!
See y’all at AGU!
Cheers!
Carolyn
onezerooneoneoneonezerozerozerozerooneoneonezeroonezeroone
July 3rd, 2014
It has been a while but here is what I have been up to!
I met up with the family for a reunion and to celebrate my Dad's birthday in Las Vegas this past weekend. It was really great to see the family and take a couple days off from the computer near the midpoint of my time at USC. I cannot say that I caught up on my sleep while I was there but oh well.
Last week I started messing with the Matlab script that I will be using to compute S receiver functions. My lack of experience with Matlab coupled with my nonexistent knowledge of linear algebra made it really challenging to make sense of the whole thing and actually make the script work. Luckily Rob helped me out and we got it to start working earlier this week. In the end we changed a "b" to an "o". Woe is me. But now that the script is working my life has basically been consumed by looking through thousands of traces and either pressing 1 or 0 to keep the trace or get rid of it. I guess this is my first opportunity to contribute my own human error to the proccess. cheeky
Here is a little bit of background info on exactly what I am doing. Seismometers measure ground motion in three directions: E-W, N-S and vertical. S waves, or shear waves, are registered mostly on the horizontal plane, i.e., E-W and N-W. When I say that I am looking at traces, I mean that I am looking at the what each component of the siesmometer has recorded. I am focusing on the E-W and N-W traces and looking for distinct blips that would indicate an S wave arrival. Here are some examples of what I am looking for and what I never want to see.


The blips I am looking for, then some ugly noisy garbage, then the classic flatline, and then the art you can get IF you're lucky. Unfortunately, the pictures on my blog aren't working right now so the first and middle picture are missing... maybe I will fix that later. Maybe. Either way these are the kinds of squiggles that I am sifting through.
I have run into two problems while I have been working with the S wave data. The first one is not so bad. Basically some of the seismometers were either too close or too far away from the event that they were recording. We are looking for a distance between 55-86 radians. Any event where all/most of the distances are outside of this range goes into a "notgoodevents" folder and therefore is taken out of our dataset. They are also joined by ugly traces. The second problem that I have been having is more annoying but happens less often. Some of the event folders are missing station information either because some components were not recording or because certain component data was not retrieved by our script. Basically, some of the events are missing data and making the script crash. In order to fix this I have been going into the event folders and looking through 100 or so SAC files to try and figure out which station is missing information. It's basically a big matching game. In the end both of these problems mean getting rid of data which is bittersweet because we want as much data as we can get so that our results are reliable but at the same time getting rid of data will make calculations go a little big faster in the future.
In conclusion, the P receiver funtion script is still running... BUT there is finally an end in sight.
Even though I am a day early, HAPPY FOURTH!!
Cheers,
Carolyn
And wait…
June 23rd, 2014
I have successfully downloaded all of my data and I am now in the thick of processing said data. It turns out that this step takes even longer! I started a P recevier function script last Tuesday and I am not very optimistic that it will be done by the end of this week. In the mean time I have been working with surface wave dispersion data and making preliminary maps with GMT to view the results. I have also started setting up directory structures and scripts to compute S receiver functions.
This weekend I went on two day trips to explore the San Andreas Fault with the SCEC program. Between seeing some really interesting geologic features, getting free food, waking up at 5 am, getting the bus stuck for over an hour in 102 degree weather, watching some of the best and worst geophysics-related movies ever, and hanging out with friends, the trip definitely had its ups and downs. Fun fact that I learned from this weekend: dates grow on palm trees. Who knew????!!? Definitely not me.
Cheers!
Carolyn
And now we wait…
June 13th, 2014
Today I started gathering USArray seismic data from the IRIS database. I am basically aquiring data from every seismometer in my study region that has recorded an event, i.e. an earthquake, in the last 8 years. Needless to say, it is going to take a while to download all of these files. I am going to be manipulating this data with scripts that have already been written by Dr. Robert Herrmann from Saint Louis University or by my advisor Rob Porritt. I will write/use some of my own scripts, but they are going to be extremely simplistic in comparison and will basically just rename/redirect files or run other scripts. Nevertheless, I will definitely get some experience with reading and writing bash scripts. I will be running some of these scripts through a program call gsac which was also written by Dr. Robert Herrmann (apparently he is a really smart guy). Later on I will probably use GMT to create some figures and maps. I am going to be working with the raw data, so I am basically starting from the ground up. I am pretty happy about this because I think that it will enable me to get a pretty sound understanding of whats happening to the data during each step of the process.
Enough with the science, I made it to the beach! My sister's friend lives in Santa Monica so I went and visited her this past Saturday. Very long story short, it was really weird and too fun. I also visited my Dad's childhood friend and his family in Encino on Sunday, so not only did I get beach time, but I also got pool time(!) along with some delicious food, a crazy dog that will play fetch until she dies, and some diehard Nascar fans. I took the bus to get to both of my weekend destinations, so all in all I probably spent a solid 4 or 5 hours on the bus. As awful as that may sound, it was actually really nice to get familiar with LA's transportation system and get a bus card for future adventures. Speaking of which, I will be using my bus card to go to a Dodgers game... TONIGHT! Maybe I will start the wave...![]()
Cheers!
Carolyn
ewe ess sea
June 5th, 2014
I am not much of a blogger, but here we go!
It's my fourth day at USC and everything has gone really well so far. The house that I am staying at for the first week of my internship is very pleasant and conveniently close to campus. My first night there I met two Bulgarians, Vera and Alexander, who introduced me to a very tasty Bulgarian soup, so what beats that?? At USC I have my very own desk amongst the graduate student cubicles, so I am feeling pretty official. Everyone in the department has been very nice and welcoming, which has made the transition a lot easier. My work so far has consisted of reading articles in order to familiarize myself with the study region and with current theories concerning the geologic processes going on over there under our feet.
My goals for this internship go as follows:
During the first third of my internship I want to get comfortable with the basic concepts behinds receiver functions, inversion theory, and common conversion point stacking. I do not think that I will be writing scripts this summer, but rather I will be using ones that Rob has already written. With that said, I want to learn general scripting conventions so that I can understand what Rob's scripts are doing on a fundmental level. After learning about the scripts I want to USE them and start doing data collection and processing. I want to make a skeleton of my poster for AGU and start thinking about the abstart that I will submit. Last but not least, I want to meet as many people as I can inside and outside of the department so that I can make some connections and (fingers crossed!) make some new friends.
During the second third of my internship I want to complete data processing and start anaylzing the resulting models. Having done some analysis, I hope to get my abstract a little more finalized. I also hope that I will have gotten to the beach by now! ![]()
During the final third of my internship I want to submit my abstrat to AGU and begin filling in my poster. Hopefully at this point I will know enough about what I am doing to start drafting a paper of my findings, eek!
Well, that is all that I have for now...
Cheers!
Carolyn


