Terrance Delisser
Terrance Delisser is a student at Fort Valley State University currently completing his research at Louisiana State University under Dr. Juan Lorenzo.
A correlation of shear wave velocity and resistivity to predict water content, grain size and shear strength in New Orleans levee foundation soils in the Louisiana Gulf Coast levee system. Resistivity is appropriate due to the wet brackish environment of the survey area; saturation heavily affects resistivity data. Rayleigh waves provide enough information to develop shear wave velocity profiles for the shallow field. Inversion of these data sets will help us to better understand the sediment type of these soils as well as provide a stronger argument for the need to better account for the geology in future planning and maintenance of the levees.
I’ve come a long way
July 25th, 2016
During processing I had to work on improving the signal to noise ratio. I was given a Perl program made by Dr. Lorenzo called Sudipfilt to do fk filtering. Fk filtering takes your data in time and space and transforms it into the frequency wavenumber domain. This separated seismic events in my data based on how they dipped revealing a noise zone that can be attenuated. When I compared my fk-filtered dispersion images to my original unfiltered plots I did notice a notice an improvement in being able to visualize the curves.
Aliasing was another issues I faced, forcing me to redo my dispersion images to incorporate resampling and interpolation. I honestly don’t have a firm grasp on resampling but I believe it has to do with improving the sampling rate so that the Nyquist frequency is higher than the maximum observed frequency in the data. For interpolation, new geophones were mathematically introduced so that the spacing of our geophones went from 3 to 1m. With these two processing steps and reapplying the fk filter, my dispersion images improved quite a bit. I’ll show one in my next blog post.
Apart from processing, I’m tying this blogpost at 20 past midnight which means today’s my 21st birthday. I’m super excited but working on my poster is going to remain in the back of my head the whole time. I’m complementing how much I’ll really need to get accomplished today. I present my poster Friday with little time to prepare but we’ll see how it goes.
Week 4: Noise and Dispersion
July 24th, 2016
Similar to last week I was tasked with writing another section of my paper on surface waves and dispersion. A primary part of the upcoming processing of my research is placed upon mapping the dispersion of Rayleigh waves as they travel through the shallow subsurface. Dispersion is a property of surface waves where the phase velocities of the individual wave components vary in a function of frequency. Understanding how and why the Rayleigh waves we generated in the field disperse at particular velocities is crucial for interpretation. This time around I gave my rough draft directly to Dr. Lorenzo and was surprised by the lack of changes he made. I can see I’m improving writing in a scientific manner.
Despite all of our precautions, when Dr. Lorenzo and I finally sat down and discussed the data, it couldn’t have been anymore noisy. The noise can be attributed to a couple of things. For one, our field mate who was helping us monitor the streamer as we pulled it along was walking up and down the seismic line causing curves in the seismic signal that can be seen just about everywhere in our data. Another potential problem was the source or the plate hitting. While hitting a tiny steel plate for hours, we missed it a few times while recording or hit the plate on the very edge of it causing the plate to flip up while we rushed to grab it and place it where it was the best we could. The plate was also displaced vertically, sinking into the muddy ground about half a foot deep from all the hammer blows. We had to dig it out almost every time. Lastly, our streamer line was touching the shoulder of a road so some of the noise could possibly be from the cars passing by.
I wrapped up the week beginning to process dispersion images for each shot point. Luckily the research I’m doing was done by one of Dr. Lorenzo’s former grad students for their thesis so all their Perl programs fitted with SU commands are at my disposal. All I really had to do was observe the data and pick out where you could see good clean surface waves from our shots. A dispersion image is generated from a program where I specify the number of traces and time intervals that I want to use.
Here’s an example dispersion image:
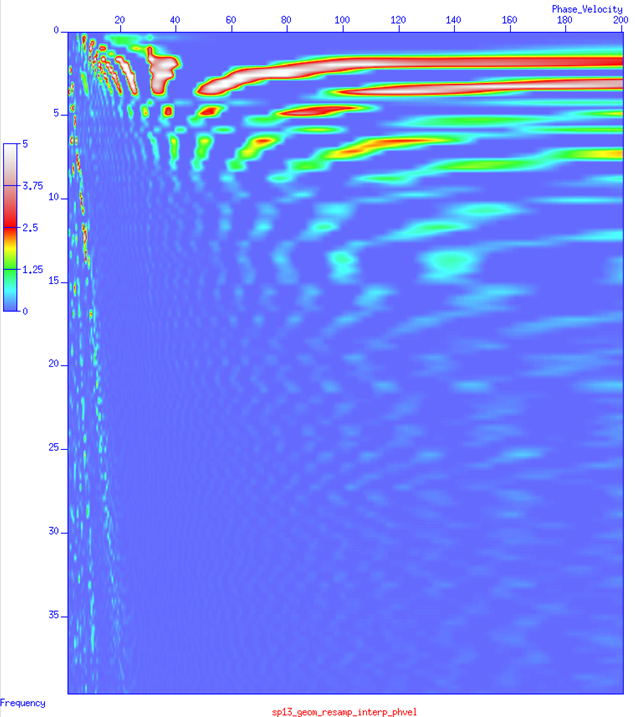
It’s not the best looking dispersion plot but the processing isn’t over yet. Keep up with me.
Week 3: Introduction Destruction and Programming
July 10th, 2016
Oh boy, I knew I should’ve posted sooner; it’s going to be hard remembering what I did in my third week. I recall it not being so eventful so I was originally intending on combining my third and fourth week entries together but after reading everyone’s blogs, I see you’re free to discuss topics not directly research related.
After our weeklong adventure in New Orleans, we made it back to LSU and I was given the task of writing up a general introduction of my research. Initially I thought I would whip something up in a few hours but as I kept reading papers, more ideas kept coming to me and It grew harder to condense it down into a good summary of what I was doing and why. I usually save the introduction for last in my papers due to how complicated I find it.
Once I was confident in my draft I was faced with the disappointment of it being completely destroyed by one of Dr. Lorenzo’s grad students. He was able to read my paper and understand just what my thought process was while I was writing it. He told me in one paragraph I wasn’t really sure what I wanted the main idea to be and that I was jumping between two ideas and in another paragraph I was probably confused on how to support one idea and it shows in my lack of elaboration. Although it was disheartening, it was amazing the level of feedback I received and it really helped me to improve my paper to a point that Dr. Lorenzo had very little criticism on it. Hopefully throughout this experience I will improve my writing skills.
Apart from writing I’ve been reading and getting more familiar with Perl, Seismic Unix, and bash. Orientation helped me grasp a lot of the basic concepts but I still spent the week taking online tutorials. I don’t find the language so bad, but I wonder what everyone else thinks of it because I didn’t hear anyone mention this language at all at orientation. I’ve never done any programming before so I wonder how it compares to other languages.
On the personal side, I’m very comfortable with the environment now. I’m meeting new people and getting familiar with the campus life. I got into a little trouble with law enforcement but all is well now. I also met with Rob but unfortunately I didn’t get to go out and set up stations with him but it’s always fun seeing his reactions to things.
Fun in the Field
June 23rd, 2016
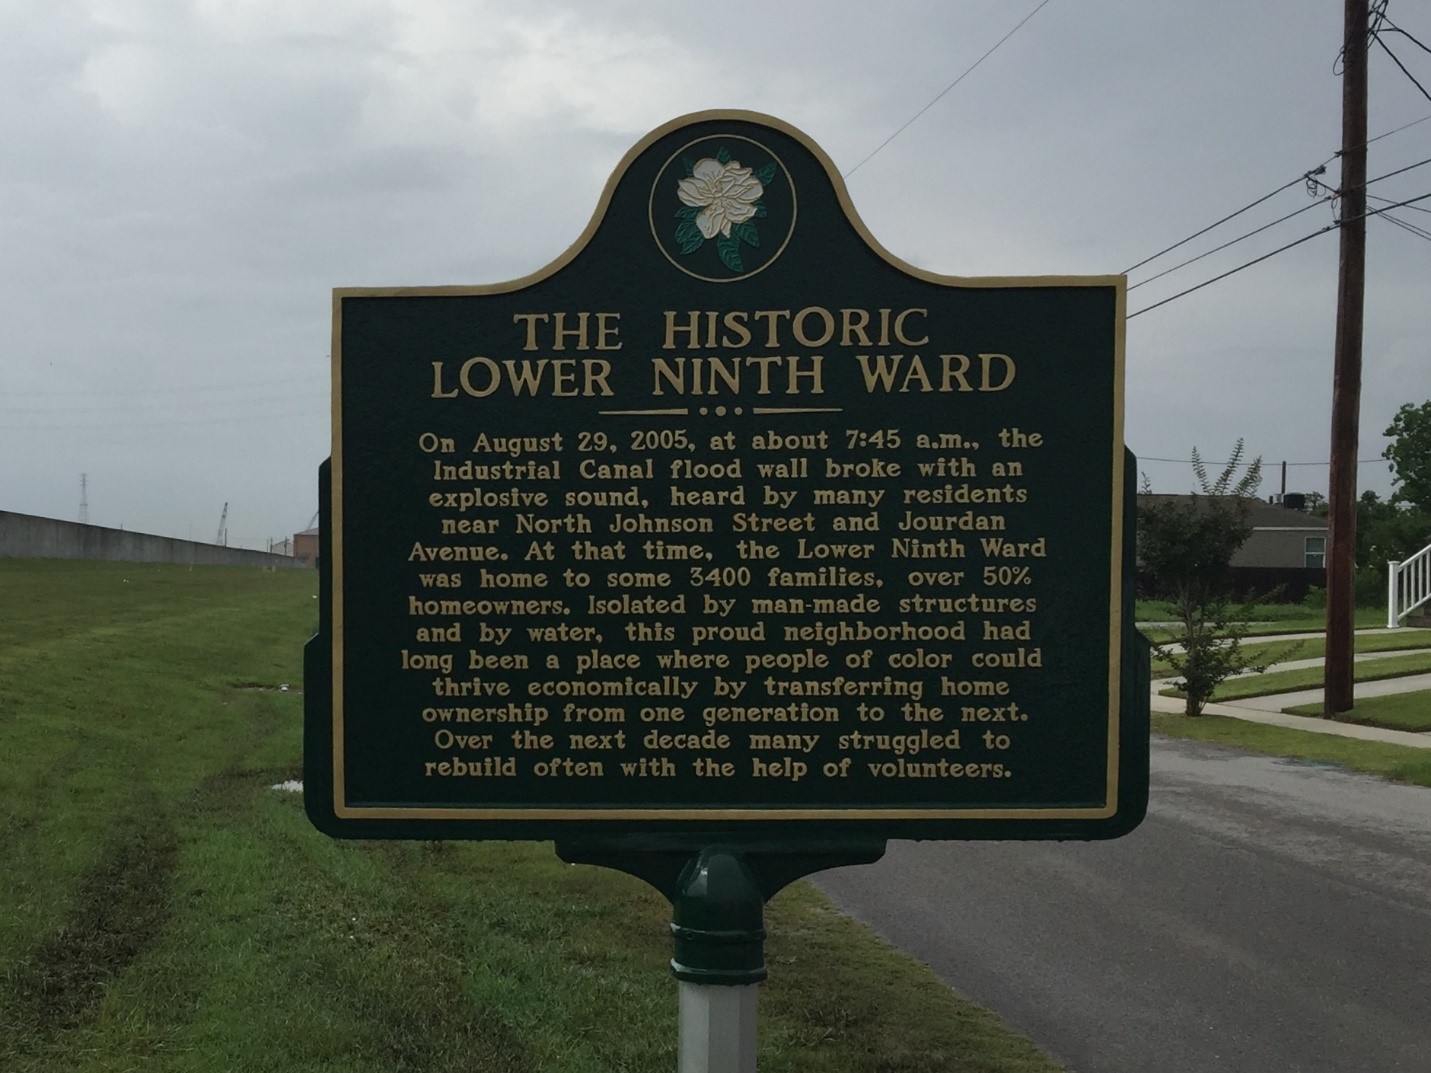
My entire 2nd week was spent in NOLA conducting fieldwork. In a team of five, Dr. Lorenzo, Martial Morrison, and I along 2 of Dr. Lorenzo’s colleagues, Koichi Hayashi and Mitchell Craig surveyed the Marrero V Line, 17th Street, Inner Harbor Navigation Canal/Lower 9th Ward, and London Avenue levees. We surveyed the first levee due to the Cone Penetrations Tests (CPT) there that we could compare our data with. The remaining 3 sites are well known, as these are the levees that were breached during Hurricane Katrina to cause the catastrophic flooding, in many parts of the city that sit below sea level. The methods we used were Multi-channel Analysis of Surface Waves (MASW), Capacitatively Coupled Resistivity (CCR), and Spatial Autocorrelation passive seismic (SPAC).
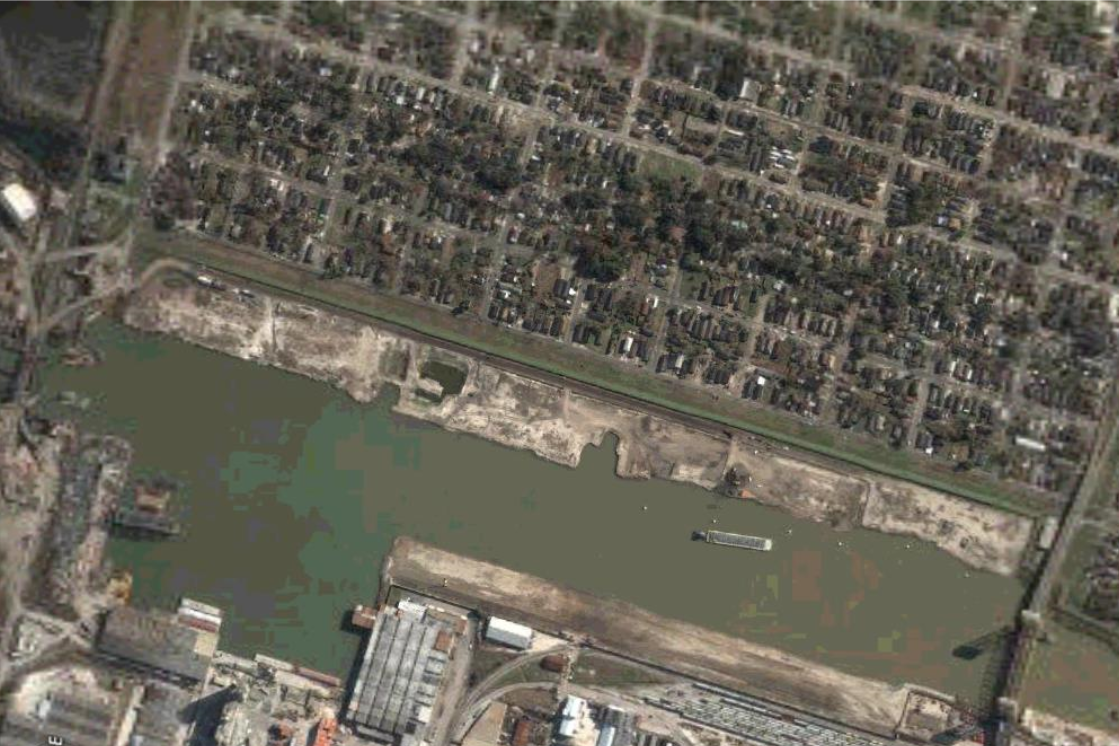
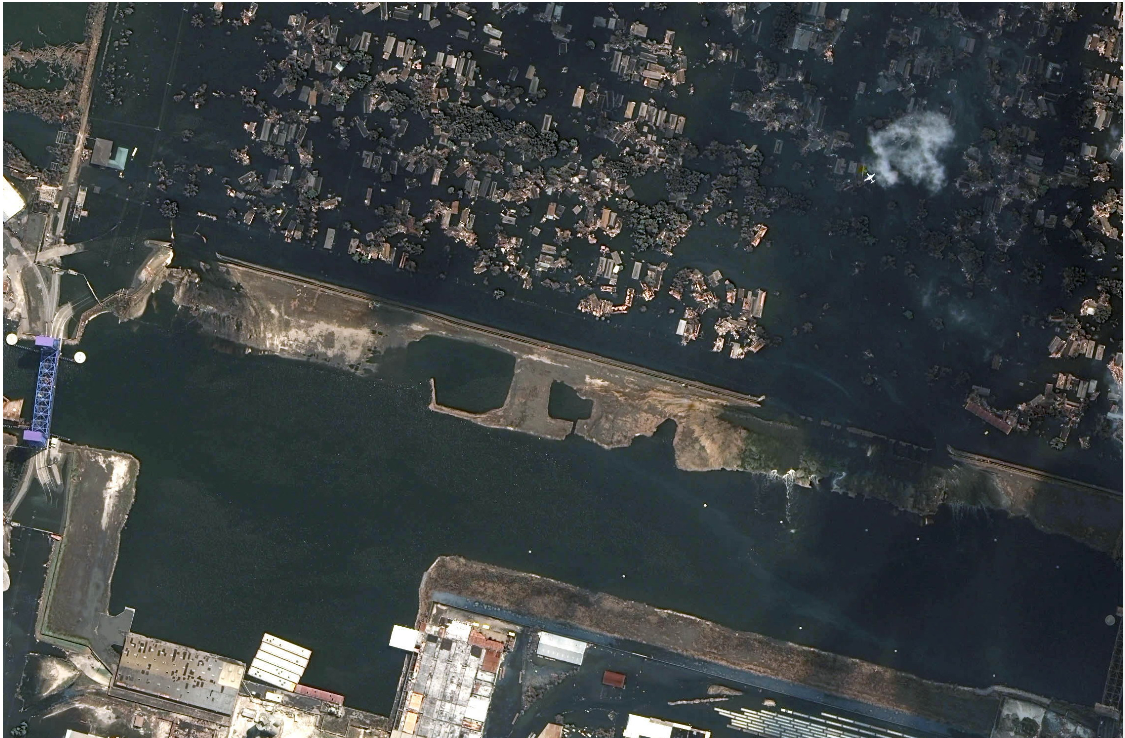
Lower 9th Ward before (^) and right after (v) Hurricane Katrina
MASW is the method I described in my last blog post: 24 plates, with geophones screwed to each, attached to a truck like a streamer.
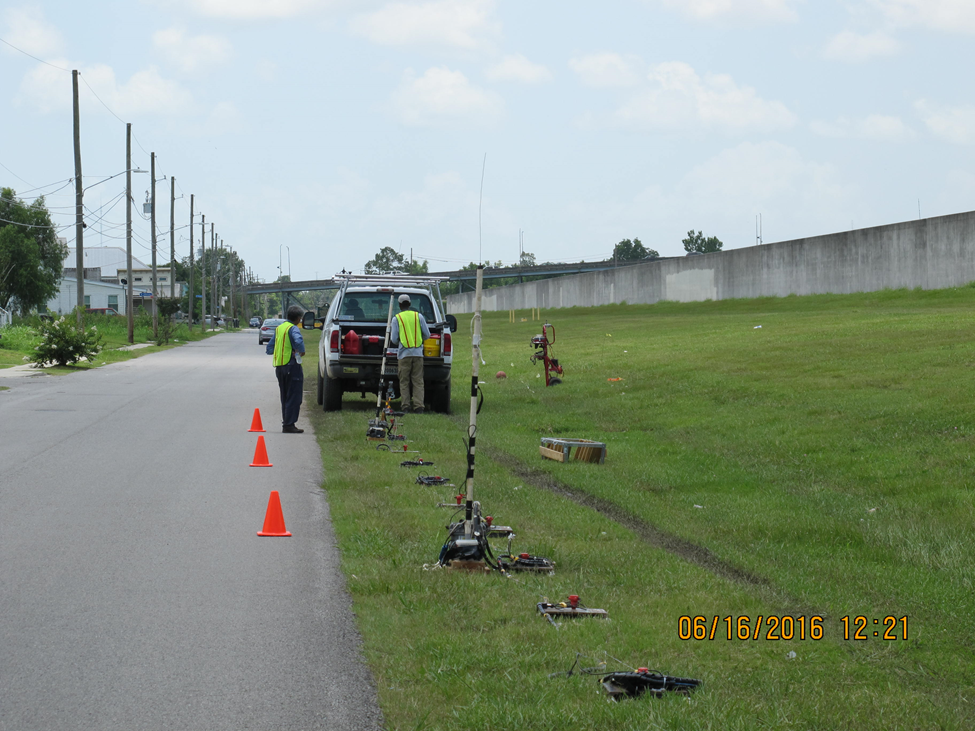
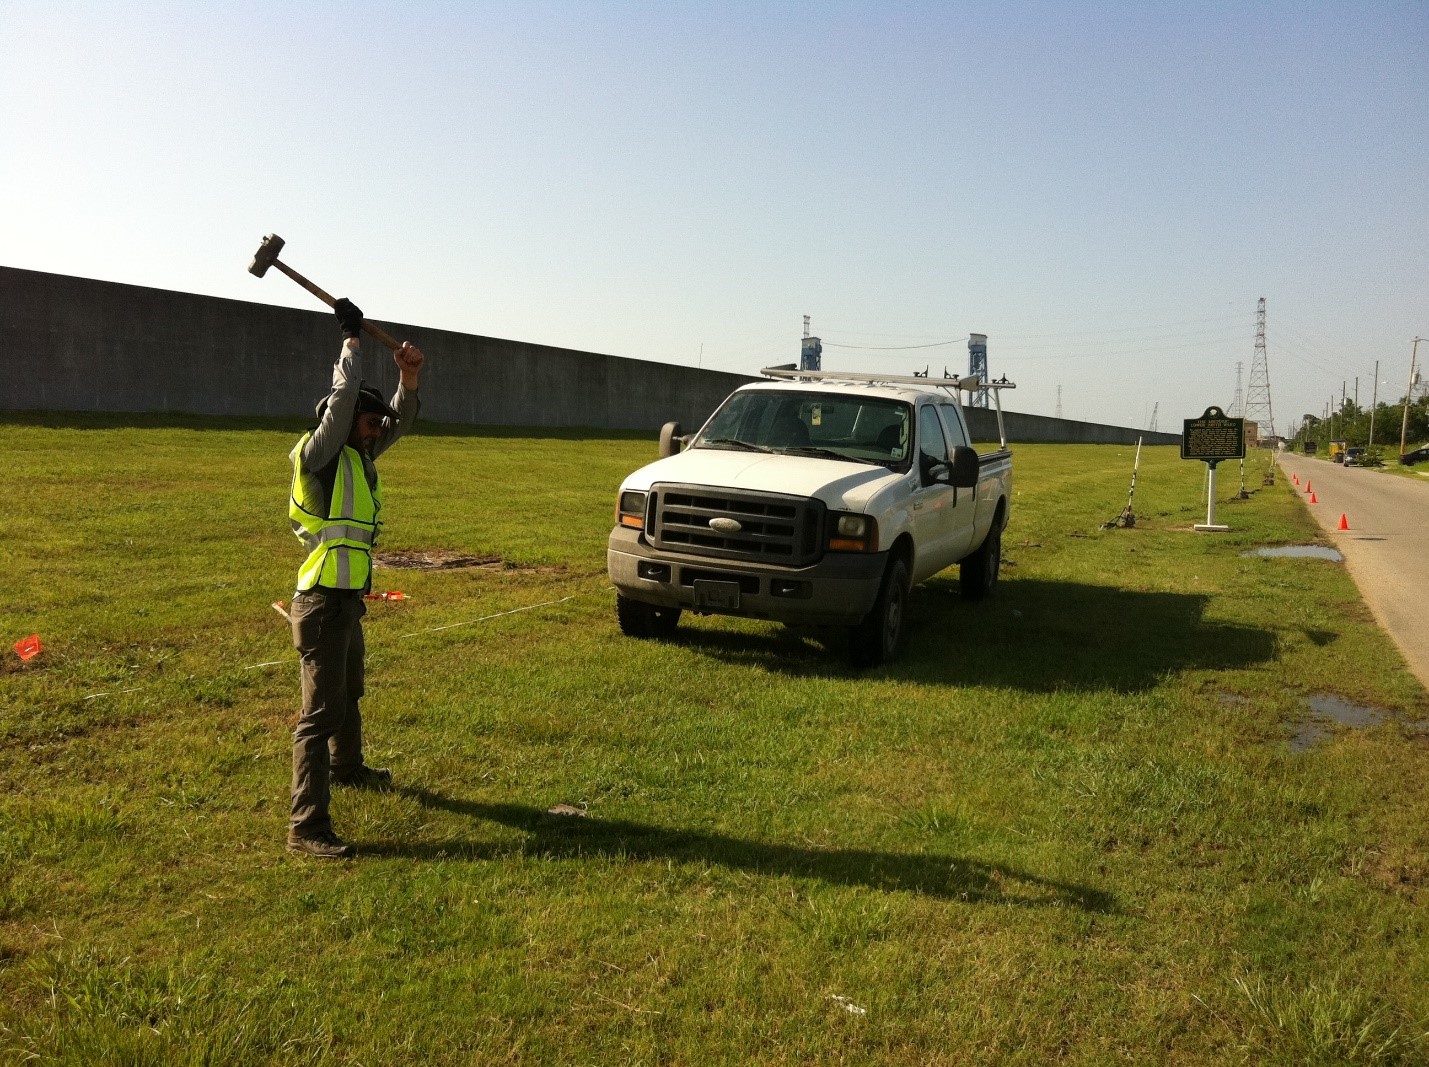
What we basically did was drive a truck 12 meters to each new shotpoint then hit a steel plate with a sledge hammer in a series of five 26 second shot time periods. Martial and I had to hit the plate 20-40 times at 20 different shotpoints for 3 hours straight. The other 6 hours of the time spent out there was focused on resolving errors and setting the streamer up. It was the longest day, rough, but a fulfilling experience.
CCR and SPAC were significantly easier and were mainly handled by Koichi and Mitch. This resistivity method was new to me, as I’m use to seeing the set up with electrodes being hammered into the ground.
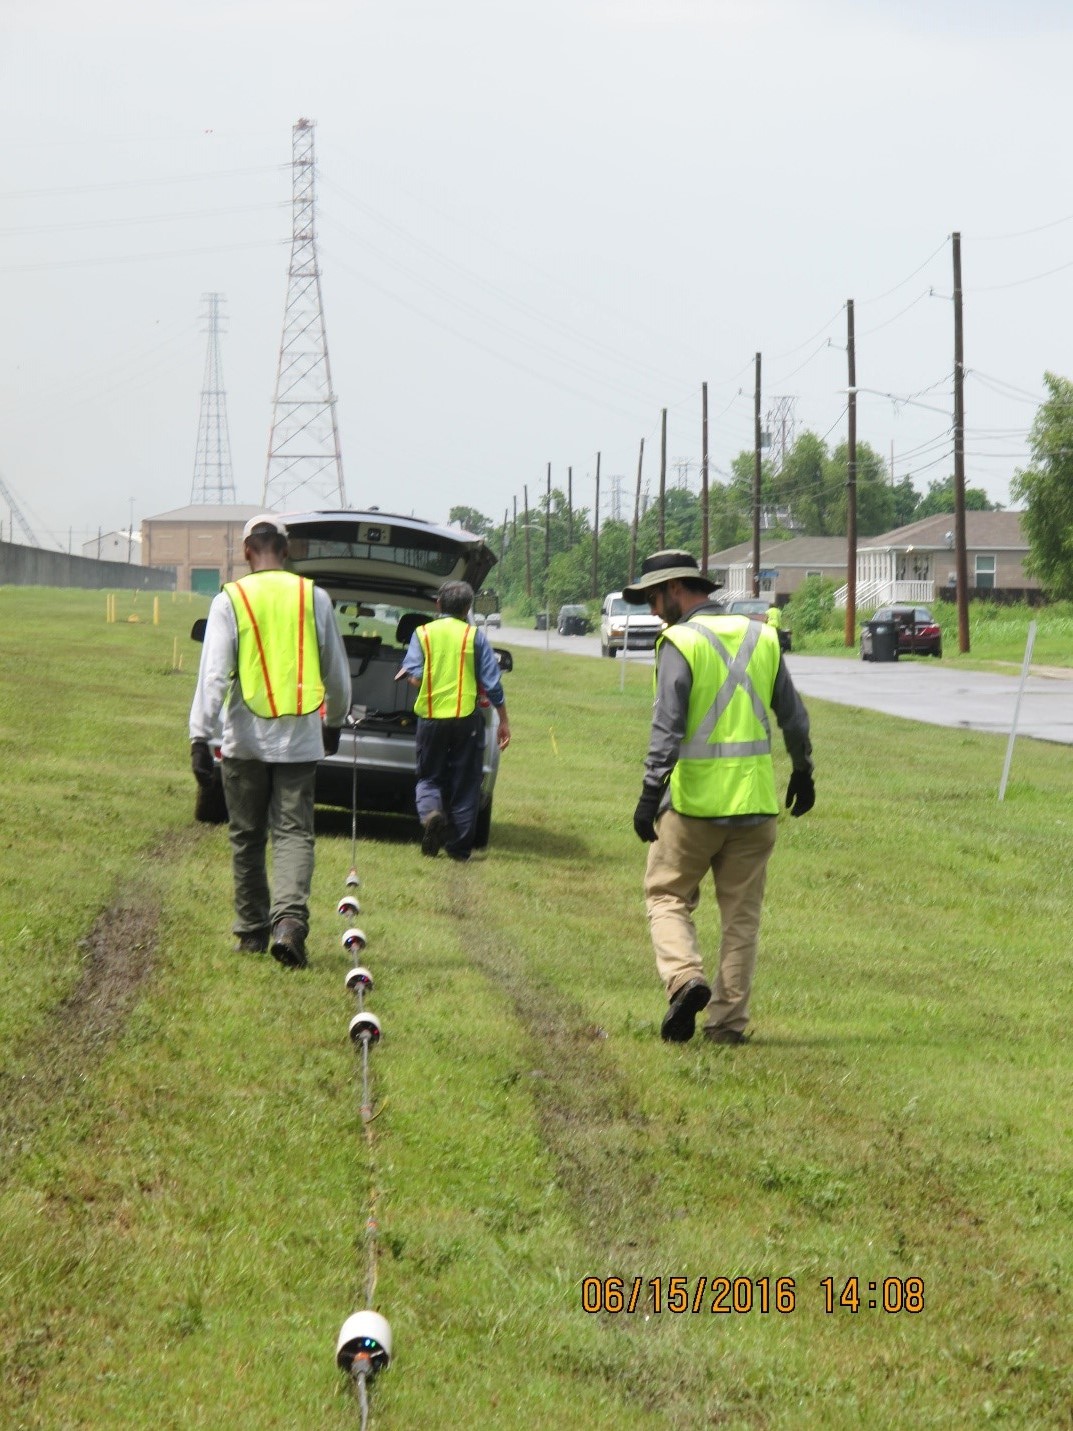
This set up used just 1 transmitter and 4 receiver cylinders connected by cable and dragged along by car with data collected at the Lower 9th ward and Marrero.
SPAC was by far the easiest. You just shake the little yellow boxes twice, and they start recording, all we had to do was put them at equal distances from each other.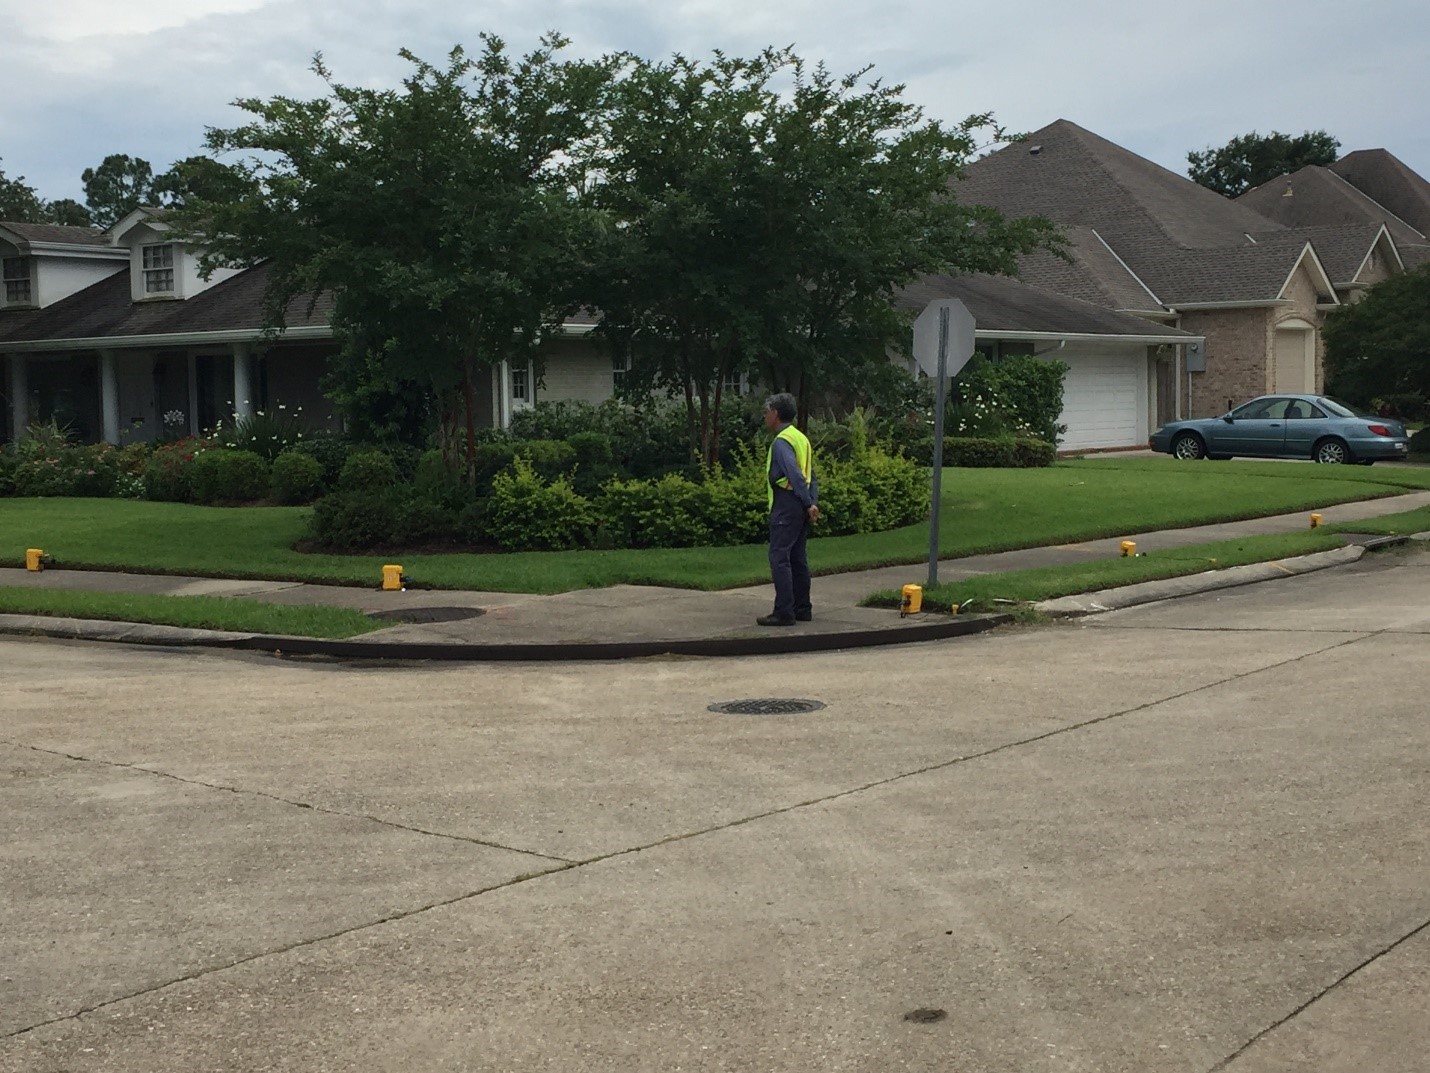
It’s pretty cool, the fact that all it requires is city noise as a passive source to collect seismic data. We collected SPAC data at all sites.
In all it was a fun experience; everyone in NOLA is pretty chill and friendly. I didn’t get to see the touristy French Quarter of the city but I’ll be back. Also NOLA has great food; the little restaurants we went to tucked away in the corners of shopping plazas surprised me with the amazing quality of food at cheap prices. I ate better than I had in months.
Week 1 Field Prep
June 19th, 2016
Here’s a little summary of what I did for my first week at LSU.
My first week was spent working in the lab doing field prep. Dr. Lorenzo’s set up consists of 24 geophones each on their own steel plate connected to four receiver boxes with take-out cables. The entire line of geophones which roughly measures out to about 74 meters is dragged by a pickup truck as a steamer in essence sending information to a seismobile trailer where Dr. Lorenzo receives the data and communicates back to us. I never seen a seismic set up like this, so I was very eager to see it in action.
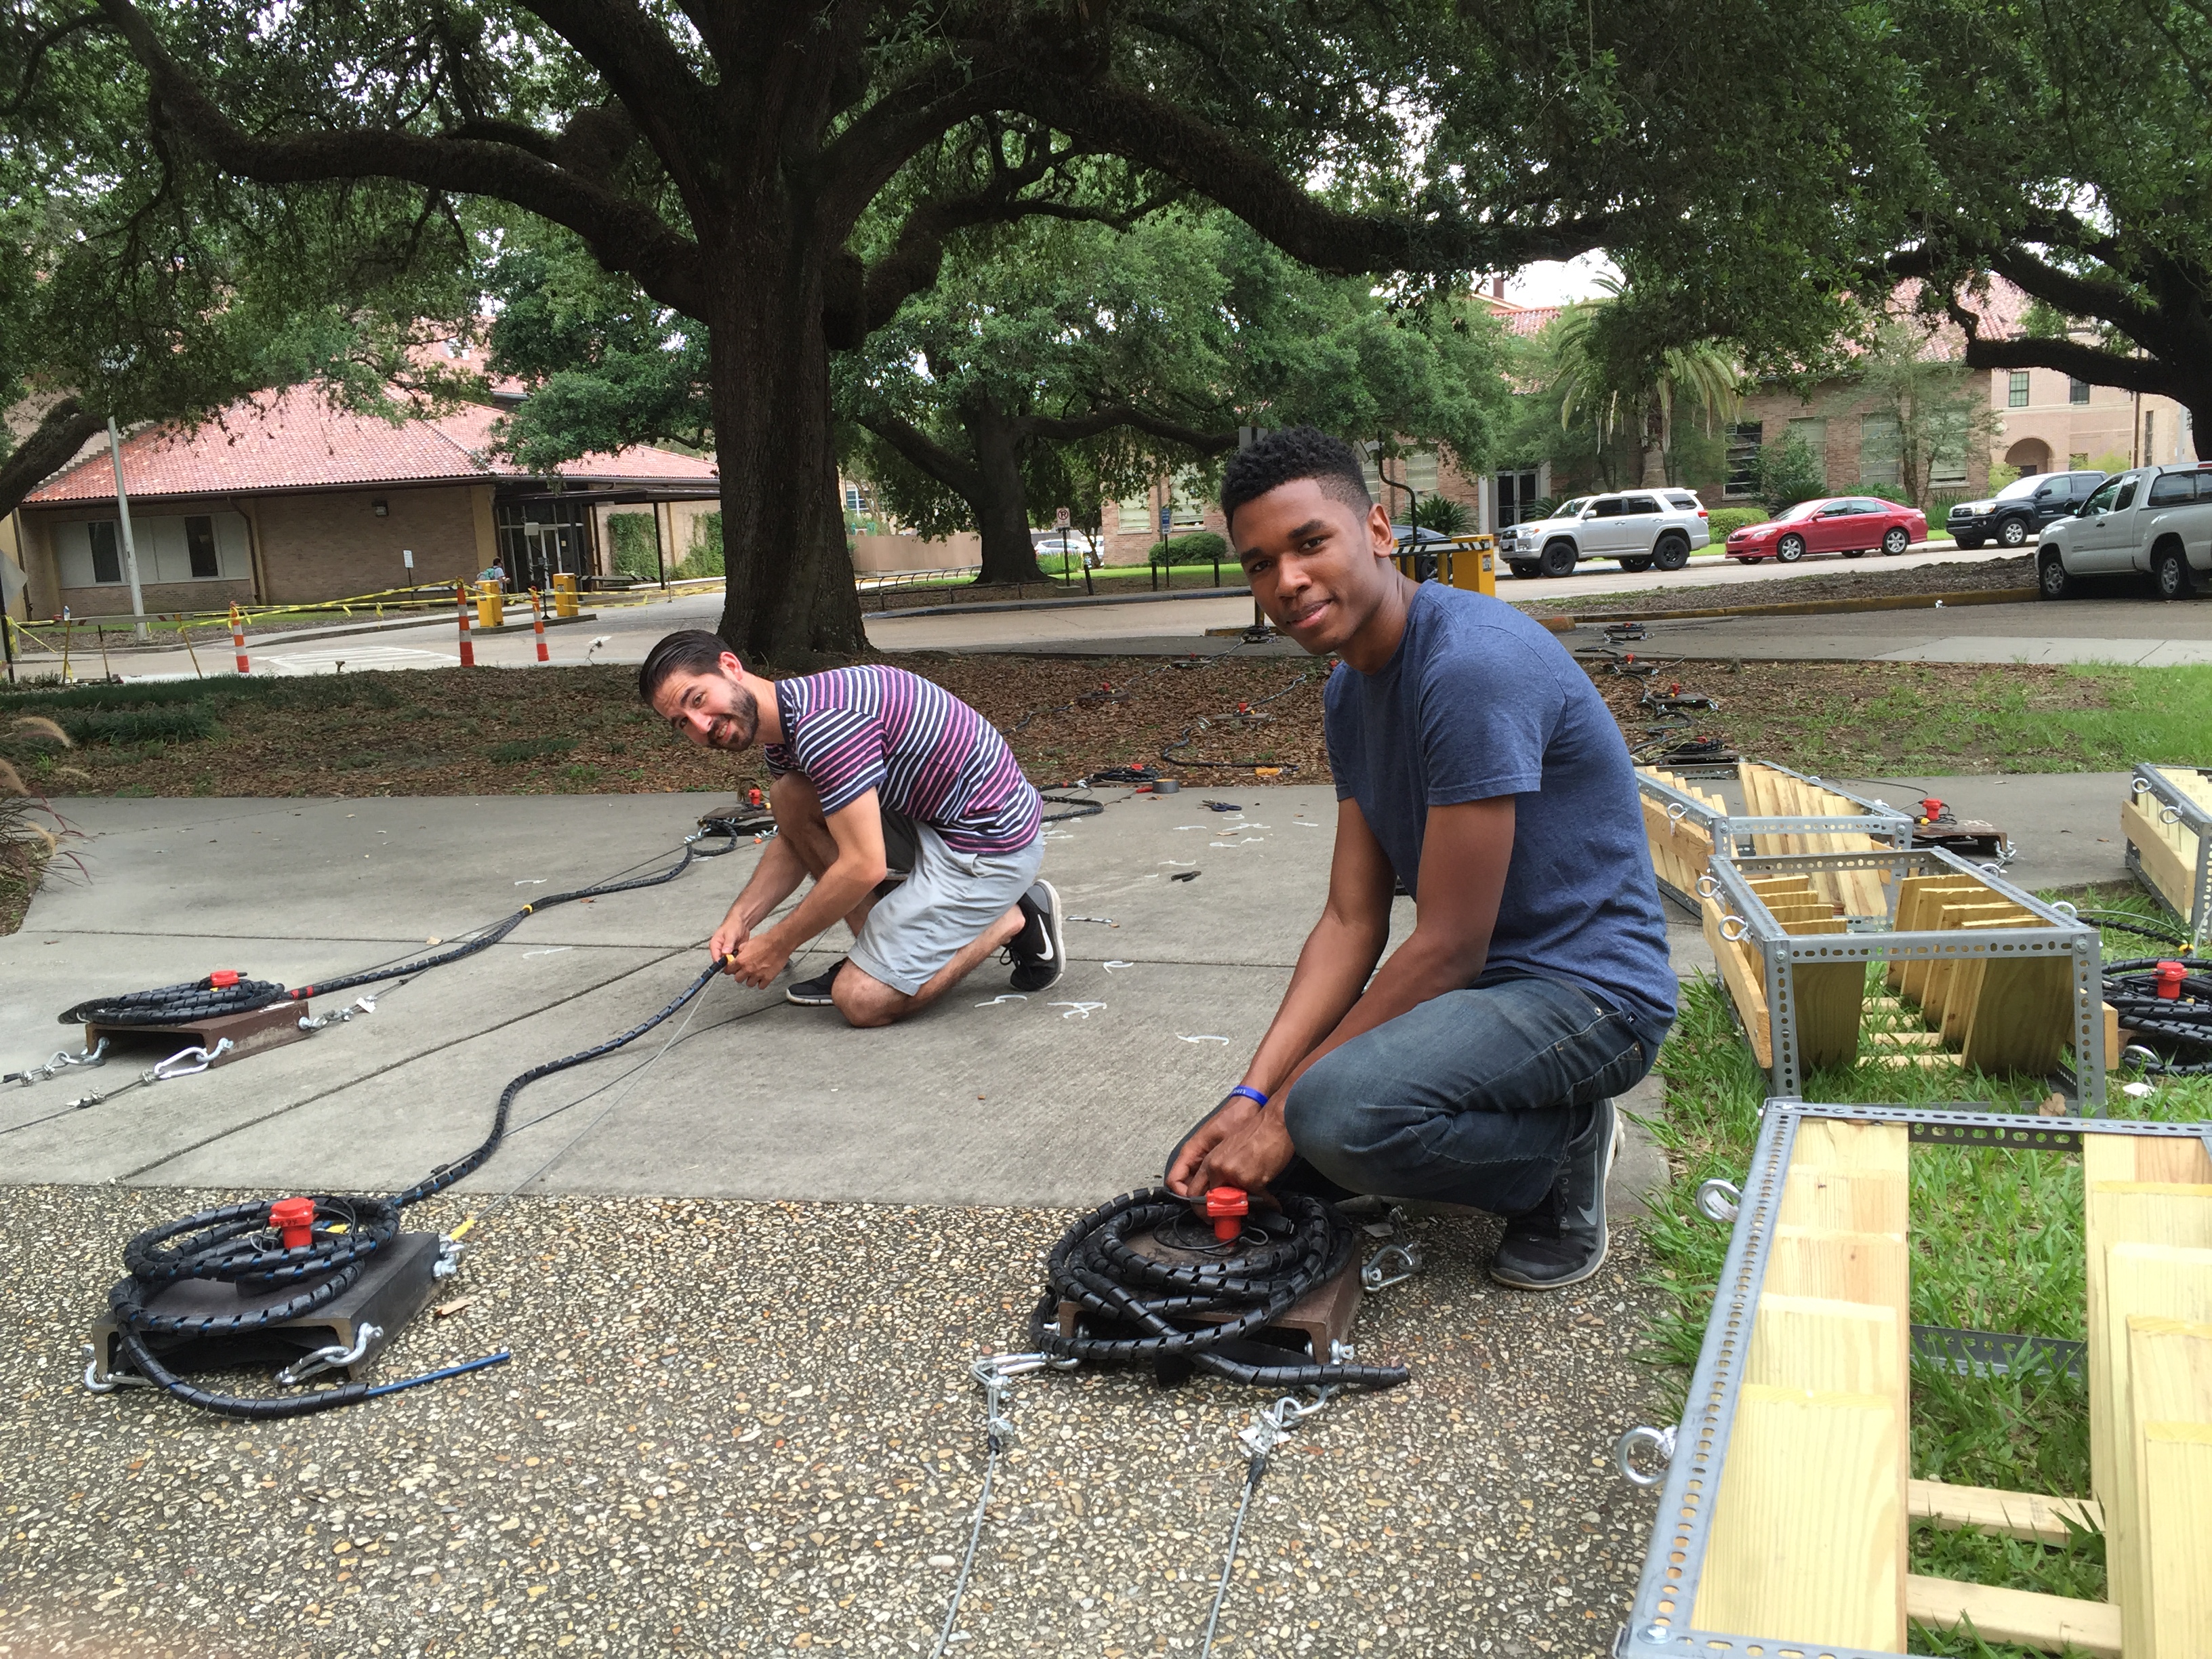
This week consisted of me and one grad student of Lorenzo (Martial Morrison) building this set up, which is more involved than it looks, and deploying it in a series of test runs that took all day because everything and anything can and will go wrong. We can spend hours checking every cable, geophone, transmitter, and receiver to find out that the problem was simply just the battery being unplugged or we had to hold the button and not just push it to turn the device on. There were definitely problems more complex but it’s nice to find out early of simple errors like that. Doing this field prep really helped shorten the time it took in the field to collect data.
My goals for the summer:
- Learn how to interpret good seismic data from the signal and correlate it to resistivity, CPT, and bore log data.
- Become proficient in Perl, the main programming language I will use throughout the summer.
- Gain field experience utilizing new techniques and equipment( MASW, CCR, passive seismic prototype)
- Use shear modulus calculations to approximate the structure and stability of levees.
I really enjoy my placement; LSU has a good campus vibe, many events to keep me entertained, and I can get around fairly easy.
Bloggin
June 3rd, 2016
In New Mexico. Forgot this state existed. It's a pretty nice place.


