Arnold Eatmon
Arnold Eatmon is a student at Fort Valley State University currently completing his research at Lamont-Doherty Earth Observatory under Dr. Donna Shillington .
I will be spending the summer at Lamont Doherty Earth Observatory campus of Columbia University using First Arrival Seismic Tomography to image the rift basin of Lake Malawi, part of the East African Rift System
Inverse Modeling, and the Dolphin Soup thing
June 28th, 2016
The next step in our project here at LDEO is to use a program called fast to do inversion which will give us a model of what the earth looks like using the data from the arrivals. The advantage to inverse modeling versus the forward modeling method that I described in a previous post is that you're going in with no presupposed ideas about the data you're working with and you get back out a model that doesn't include features you think may be in the model, rather features that are supported by the data fed in.
When my mentor for the summer, Dr. Donna Shillington, was first explaining the idea of inverse modeling I made a remark to her that I would have no idea what she meant by the concept if it hadn't been for an activity during orientation week with IRIS. We had the activity where we were to sit in a circle and one of the faculty mentors named Alex told us that a guy walked into a bar, ordered dolphin soup, ate it, left and immediately shoots himself; the idea of the challenge was we all had to figure out what happened to make him do so but we could only ask yes or no questions. I feel the need to clarify this was not where I saw our day headed, before that we'd been playing golf and eating burgers. Anyways, an example is we asked, "Does it matter that it’s a dolphin in the soup, or could it be something else?" which was returned with a no. We couldn't ask questions like "What was he doing an hour before that?" because they required more than a simple yes or no answer.
By the end of the game, we figured out what happened and I personally thought it was an entirely morbid and strange experience. Fast forward three weeks and it's so relevant and applicable to our project. Just like we had to formulate questions to tell us about what on earth about dolphin soup was so off putting that it would make a man commit suicide, we need to formulate questions that can be answered to be either true or false that will tell us about geological events that occurred in the past. Just like we couldn't ask questions that required a detailed response, no one can talk to the Earth. Well I suppose you could talk to the ground, then put your ear against it and listen for a response but I would be quite alarmed if you got an answer back.
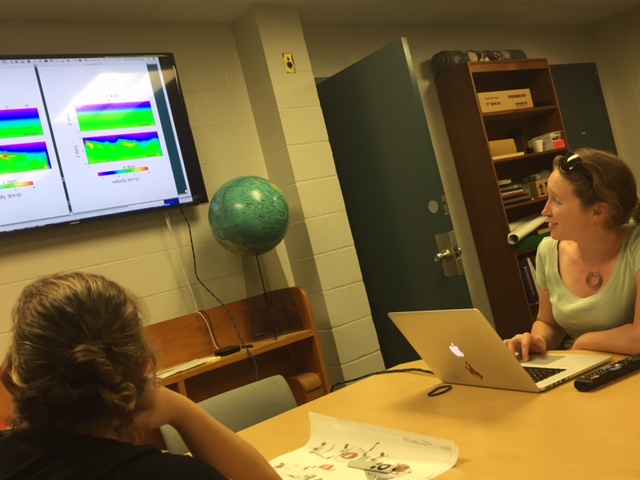
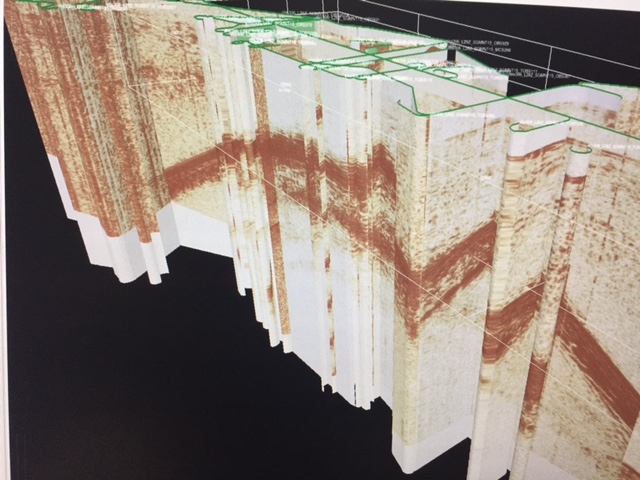
This is our meeting about FAST inversion
This is me trying not to look suspicious while getting a candid picture of Evans
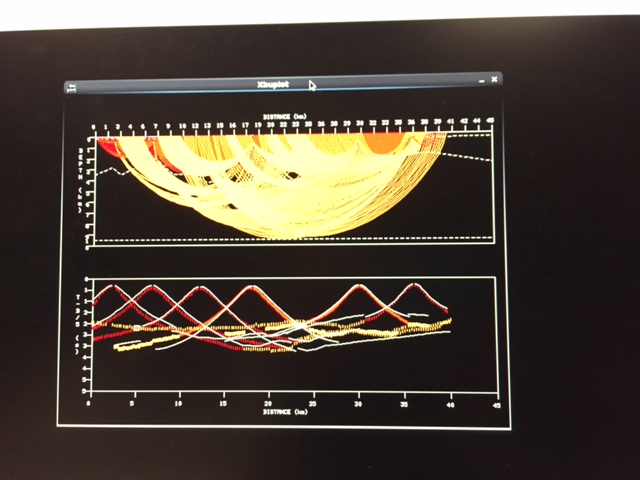
And this is what we were actually discussing : - )
Ray Inversion
June 28th, 2016
Now that we have a series of first arrival picks from the data set, we're spending time doing some forward modeling on the data. What that entails for our case is we take the first arrival picks and export them into a format that’s essentially a text file. Then we take those pick files and with the help of our wonderful graduate student mentor, Natalie Arcado (who shall hereby be referred to as the wizard who fixes all our problems), we convert those files into a the format used by our ray inversion program conviniently called rayinvr.
Once we have rayinvr up and running, we're returned a user interface in which we can generate a model and see how that model "fits" the data with using the chi squared misfit value returned. We start with a very basic model that assumed a flat plane over the area with a constant velocity in most of the layers. For our particular case, my mentor had some information about the topography of the sea floor beforehand that read she imported into rayinvr. From there, we make small changed and see if those changes to the model are supported by the data, resulting in a lower chi squared misfit, or not. This process has the advantage of allowing you to really get a hands on feel for the data and develop an intuition for what sorts of features you expect to see. It's really beneficial in guiding the rest of the seismic processing and allows you to add in specific features to see how the data responds.
This is where personality plays a big part in doing the task. Doing it is something you either love or hate. Some of us do it for an hour and just can't take it anymore when the chi square we finish with is higher than the one we started with (which by the way is truly maddening). Others enjoy it and take their time, while simultaneously humming jazz rhythms despite no music playing at all, let alone up tempo jazz. Well as the saying goes, got to whistle while you work.
Living in NYC for the Summer
June 28th, 2016
This is another one of those blogs that isn't exactly related to a research topic but hopefully gives a little more practical info to students who are interested in this opportunity next year… Or if any of the other IRIS interns who… I don't know, got bored and started reading blogs on a weekend. I know I read some blogs before applying so for the very prepared students out there, this one's for you 😊
For the duration of the internship I'm living in a neighborhood of Manhattan called Morningside Heights which is wedged in NYC between Harlem and downtown. The dormitory I chose housing in is used by the Lamont intern program to house their interns every summer, so it's full of students we see every day at work which is a lot of fun itself.
The dorm is called Cathedral Gardens which is a part of Barnard College. As a bit of a tangent (then again, isn't this all just a huge tangent) Barnard is a women's only college associated with but separate from Columbia University. It resulted from Columbia's history of being a men's only university. Separate admissions, separate graduation, shared classes. I was really wondering what the deal was when originally looking so hopefully that answers someone's question. Fun fact, Martha Stewart is a Barnard College grad.
Rooms are quite nice and shared by 5 people and is surprisingly spacious. I imagined it being like a shoe but this is actually on the larger side of dorm rooms, in my humble opinion. The dorms come with a small but full kitchen area and utilities are included. Its also 20 blocks from the bus to Lamont so overall it’s a great option for students looking to stay in the "center of the action" while working with Lamont. Morningside Heights itself is actually a pretty quiet college neighborhood, but its pretty easy to walk downtown south of 90th street where pedestrian traffic really picks up.
The best thing about NYC if you're incredibly lazy like I am on the weekends is you have access to (almost) everything at any time. Especially food. I love using the Seamless app to order pretty much anything I can imagine eating to the door of the complex. And, let's not even get started with how amazing and yet somehow cheap Uber happens to be.
Behind the scenes of when I write blog posts.
Reciprocity Checks
June 28th, 2016
Once all the picks are done and exported, if you're like me you're probably a little confident in your decisions but mostly concerned about the off chance you did an awful job that will result in a garbage in garbage out thing. Well fear not, reciprocity checks are here to save the day!
In all seriousness, it's important to check the validity of the picks which is done in our research using reciprocity checks in a cshell program called recip_check. Once the first arrivals are picked and that information is exported to ASCII format, the program recip_check reads the data in and generates a map that visually compares the picks from one OBS (ocean bottom seismometer) to another. The idea here is that the arrivals you pick are ideally the same across all instruments. I'll include visuals below of what the output of a reciprocity check looks like. If the check returns an image where the dots (representing your arrival picks on one instrument) overlap the circle (representing your pick on another OBS in the same location) then your picks are consistent and you're good to go. If there's a large gap in between the two, that's something to go back and check.
Generally my picks are pretty consistent, so the reciprocity check process goes well. However when things get noisy, the data can be difficult to interpret and the first arrivals can be cumbersome to follow out consistently.
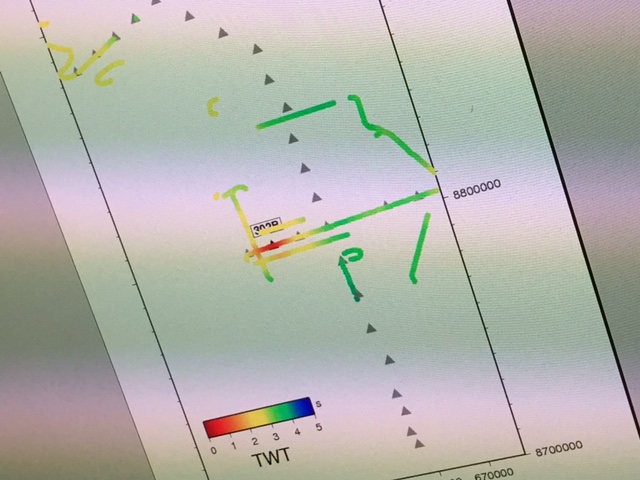
Another way of checking the accuracy of the arrival picks that my mentor and graduate mentor introduced to us is a gmt map that visually shows the offset of picks as you get further away from an OBS. The idea with this method of checking is that the shots near the OBS will be near offset (short times) and the time of the arrivals will increase the further the offset becomes. Visually this is displayed on a gmt map of Lake Malawi that has the OBS plotted and labeled, then shows the picks. The colors are red at the center; the ideal is for the color to gradually change outwards in a radial fashion according to the color map reflecting further offsets.
A strange feature we saw consistently through my picks are some regions with offsets that are a little off in the top left. We're planning to check to see if that could be due to the depth of the water in that area since it's a consistent feature across multiple checks. Hmmm.
By the way, we’re in New York and there’s stuff to do
June 28th, 2016
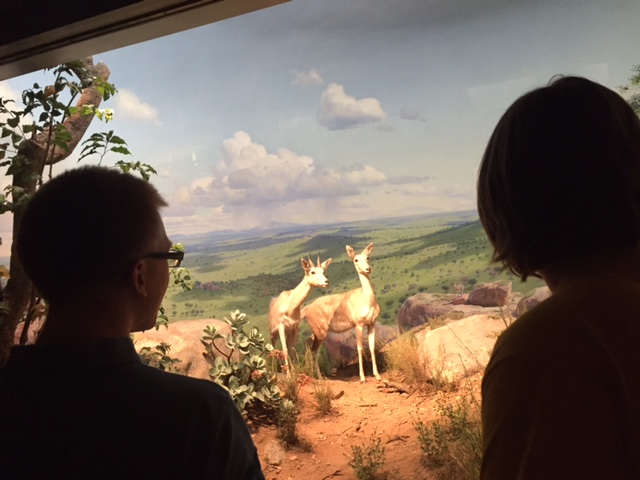
While it isn't entirely relevant to the project, me and some of the other interns got together to go to the American Natural History Museums.
I have never been in a museum so. epically. huge. Had a great time, and downtown NYC is beautifully upscale (and apparently priced to match, yikes).
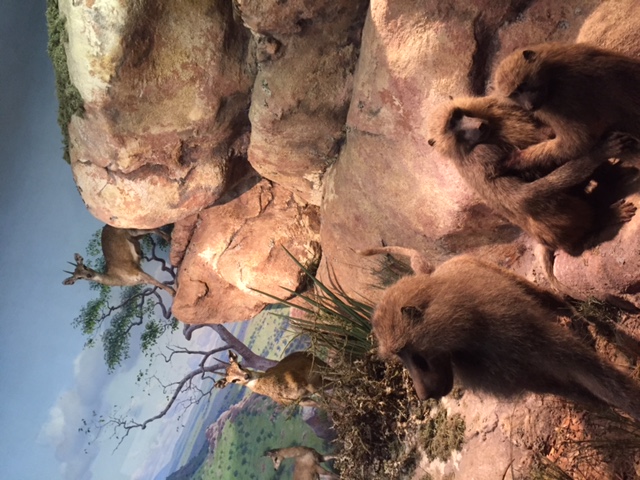
Unofficial theme of the museum is the circle of life. You can't really tell from the photo but off to the side, there's a predator and the circle is about to happen.
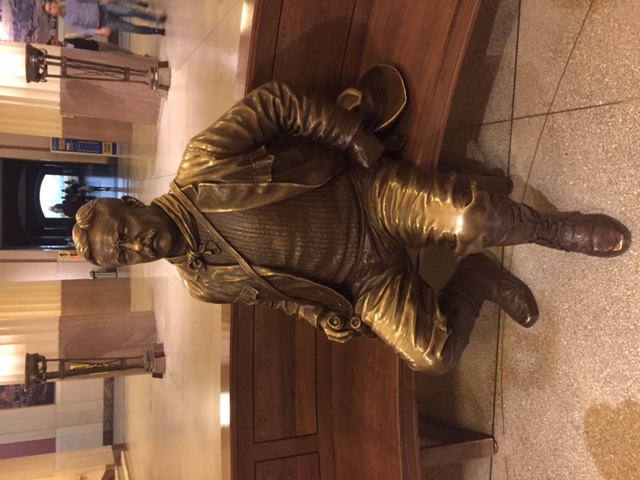
I checked my phone at the end of the day and we'd walked about 5 miles in the museum itself. At the end, we saw a statue of this guy
Huge. In an epic way.
Picking First Arrivals
June 28th, 2016
Once we returned from IRIS orientation, we dived right into our data and got acquainted with picking first arrivals in the seismic data. The first arrivals are associated with refracted arrival times, or the beginning of when waves as they moved out radially in the earth turned, or refracted, through mediums with different velocities until they returned to an OBS.
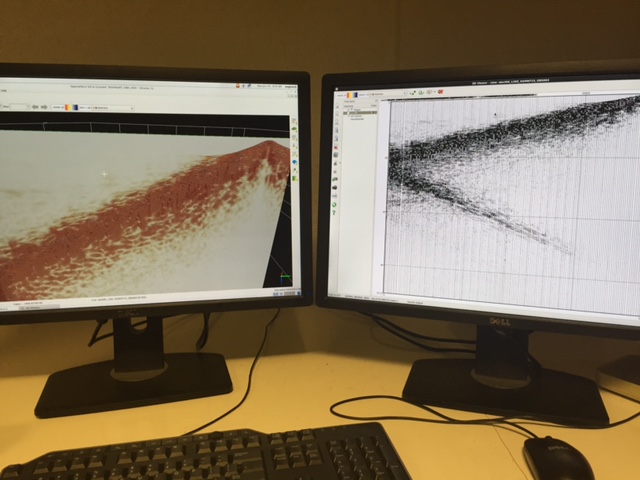
To do this, we're using a free and open-source software called OpendTect available for windows and linux at [url=http://www.opendtect.org/]http://www.opendtect.org/[/url] for download. Once the data is loaded, we view the data in a wiggle trace with the horizon tracking tool selected. After that, the fun part is figuring out your personal preference of settings that help you best view the data. I like to add a lot of vertical stretch and gain, then select the setting of 0 overlap to create a prominent, square clipped shape to any large positive amplitudes. Then, I zoom out and have a look at the data using two screens. On one screen, I see the slice containing the seismic data zoomed out featuring the entire geometry and on the other I view the wiggle trace with the aforementioned settings. Personally, I like to go ahead and manually do a rough trace of the data just following the arrivals out while keeping my eyes on both views. Then, I'll put something on spotify, relax, and zoom in to more accurately pick along the arrivals.
There are several places along the arrivals that people may choose to pick on with consistency being key. For our purposes, Evans and I are picking on the first positive amplitude of the arrivals. Other people may pick in the center of along the small negative amplitudes that precede the positive. The tricky part is consistency, it's quite easy to "get lost" in the data and pick things that aren't the arrivals themselves, especially in noisy shots.
Overall the task is repetitive at first, but once you really lean into it and put something to listen to on it's quite nice. Kinda soothing.
Data for Days… Months in Fact
June 28th, 2016
This summer we'll be working here at Lamont Doherty Earth Observatory on seismic refraction and wide angle reflection data collected using a combination of land seismometers, ocean bottom seismometers, and a streamer. Let's dive in to all that…
The Lamont campus is located about 16 miles out from the Columbia campus in Palisades NY. LDEO hosts its own intern program that Evans and I have also joined for the summer. Every morning interns rise early and catch the 8:30 bus that goes straight from Columbia to Lamont. The route is really beautiful and travels along the Hudson from Morningside Heights (the neighborhood interns reside in) through Harlem and then onto the interstate until we've reached Lamont. The very first day we arrived, a photographer took a picture of all the interns leaving the bus and walking into LDEO for the first time. The woman in the red bucket hat at the very beginning is the intern coordinator here, Dallas Abbot
The Lamont campus itself is quite large and really residential in comparison to Columbia's monolithic campus. It really looks like someone used to live there. And fun fact, someone did! The entirety of the Lamont campus used to be an estate. At the time of death of the owner, the estate was donated and became LDEO. Anyways, we get off the bus each morning and head over to the oceanography building with our mentor Donna Shillington and graduate student mentor Natalie.
Our first day was actually a week ago before orientation, and that was the day we had our introduction to the project and data set Evans and I will be working on this summer which is seismic data collected from Lake Malawi, part of the East African Rift System.
The East African Rift System is one of few active continental rifting sectors in the world today; studying it provides insight into the mechanisms of plate tectonic process and the process of continental rifting that led to the modern orientation of continents. There are two major models regarding continental rifting, one that is purely mechanical and one that is both mechanical and due to magmatism. Seismic exploration of active rifting can help explore these models as well as illuminate other details about the mechanics of continental rifting.
The data we're working with this summer was a sort of active source "marine" seismic exploration done in a less traditional fashion by incorporating not only the streamers as recording instruments but also a combination of land seismometers and a geometry of ocean bottom seismometers deployed in Lake Malawi. The active source used was an air gum set to fire at a variety of ranges as the ship sailed. Aboard the ship collecting the data were none other than my mentor and graduate student mentor- so I guess you could say we're getting an exclusive first look at the data they collected.
The orientation of the OBS are shown on a map and labeled Line 1 (the long center line), Line 2 (the north most horizontal line), and Line 3. Using this array, our hosts for the summer recorded a variety of refraction and wide angle reflection data. The advantages to this method are numerous in allowing checking across multiple OBS and having multiple methods of attaining a model available to us. The disadvantage would be less related to the method of acquisition itself, rather just the data is inherently quite noisy and difficult to interpret at very far offsets. Also turns in the data set are somewhat tricky to navigate in the 2D viewer. However, there is such an abundance of near offset data that it isn't really much of an issue at all.
The data is stored in a series of seg-y files in a directory on the linux workstations in the oceanography building here at LDEO. So every morning, Evans and I walk in, log in, and get to hammering away. It's going well by the way.
Internship Goals
June 28th, 2016
As we got back from the orientation week with IRIS, we were sent a rubric that led to a discussion of our goals for our research this summer. Personally I really was not looking forward to the evaluation until we actually did it which left me like "Oh, that was nice and actually quite helpful!" For my research project, the direction my mentor and I decided on was to use the seismic refraction data to create a broad 3D model of the rift basin in Lake Malawi. I also commented that I'm really looking forward to visualizing the data in new and creative ways using what I learned at my last internship to guide that. I've seen a lot of RGB "rainbow" color maps so I'm looking forward to hopefully bringing something new to the table at the end of this summer. Spoiler alert located here [url=https://datascience.lanl.gov/data/papers/chi2015.pdf ]https://datascience.lanl.gov/data/papers/chi2015.pdf [/url];
However my goal for the day is to stop skipping meals and get something to eat that doesn't require walking far away.
Concerning the blog itself, my goal is to make this blog interesting and readable in a way that ditches the traditional "format" and moves in a way that's both topical and somewhat chronological. I say somewhat for a reason that the people reading my blogs as soon as they are posted will figure out pretty fast quickly 😊 Topics here are going posted in the order they occurred and in the order you'd do them to accomplish a similar project. Hope y'all enjoy!
Test post
June 3rd, 2016
I'll probably post a lot of stuff to this blog in the future. For anyone reading this wondering which blogs to keep up with, miiiine 😊 Stay tuned


