Juan Acevedo
Juan Acevedo is a student at Texas A&M University currently completing his research at Missouri University of Science and Technology under Dr. Kelly Liu.
Shear wave splitting analysis is a common method used by geophysicists in studying structural seismology. The main purpose behind shear wave splitting is to study anisotropy present at the core-mantle boundary (CMB) as shear waves travel through the outer core and split up into their different radial and transverse components in the mantle. The splitting of the P-to-S converted phases along the CMB will have a specific polarization that can aid in determining the splitting parameters such as polarization direction of the fast wave and the splitting time between the fast and slow waves. The purpose of this study is to identify any anisotropy present at the CMB beneath Alaska where the Pacific plate is subducting underneath the North American plate. Project is funded by the National Science Foundation.
Final Blog Entry
August 16th, 2017
Greetings everyone,
My time at the Missouri University of Science and Technology came to an end sooner than I expected, 5 days to be exact. My project had a deadline for completion to be on August 5th and I was able to finish all my duties as an intern by July 31st. I even did more tasks that were originally expected of me from this project. I was told in the IRIS contract that my duties would end whenever I completed my power point presentation of the work I had done throughout the summer. However, once I finished my presentation it became clear to me that Dr. Liu wanted to keep me as part of her team for as long as possible, which was a good thing. She made me go back and check up on all the individual measurements I had provided for our project, making sure I had no errors in the data. Once that step was completed I then started working on my abstract that I eventually submitted to the AGU website and worked on my poster.
Overall my internship experience was decent. I was able to complete my project and leave a good impression of my co-workers. My life outside of work was not nearly as exciting as I hoped for, but my only reason to have been in Rolla, Missouri was to work on my project.
This project has been similar and different to my other undergraduate research projects in many ways. It has been similar in the sense that there are specific goals I would like to achieve within the project and I have to do some extra work in order to accomplish them. It has been different, however, due to a number of resources I had at all times throughout my project. Whether it was the grad or post-doc students or even just the posters that were all around my office, I was able to quickly check up on the things I had questions about and had them answered clearly and concisely.
To finish off this blog entry, I'd like to thank IRIS for the opportunity to complete this research project and for the chance we have to present our work at this years AGU conference. I'm looking forward to traveling to New Orleans in December and to see all the other IRIS co-interns again.
Thank y'all for keeping up with my blog posts,
Juan P. Acevedo
Blog Entry 7
July 27th, 2017
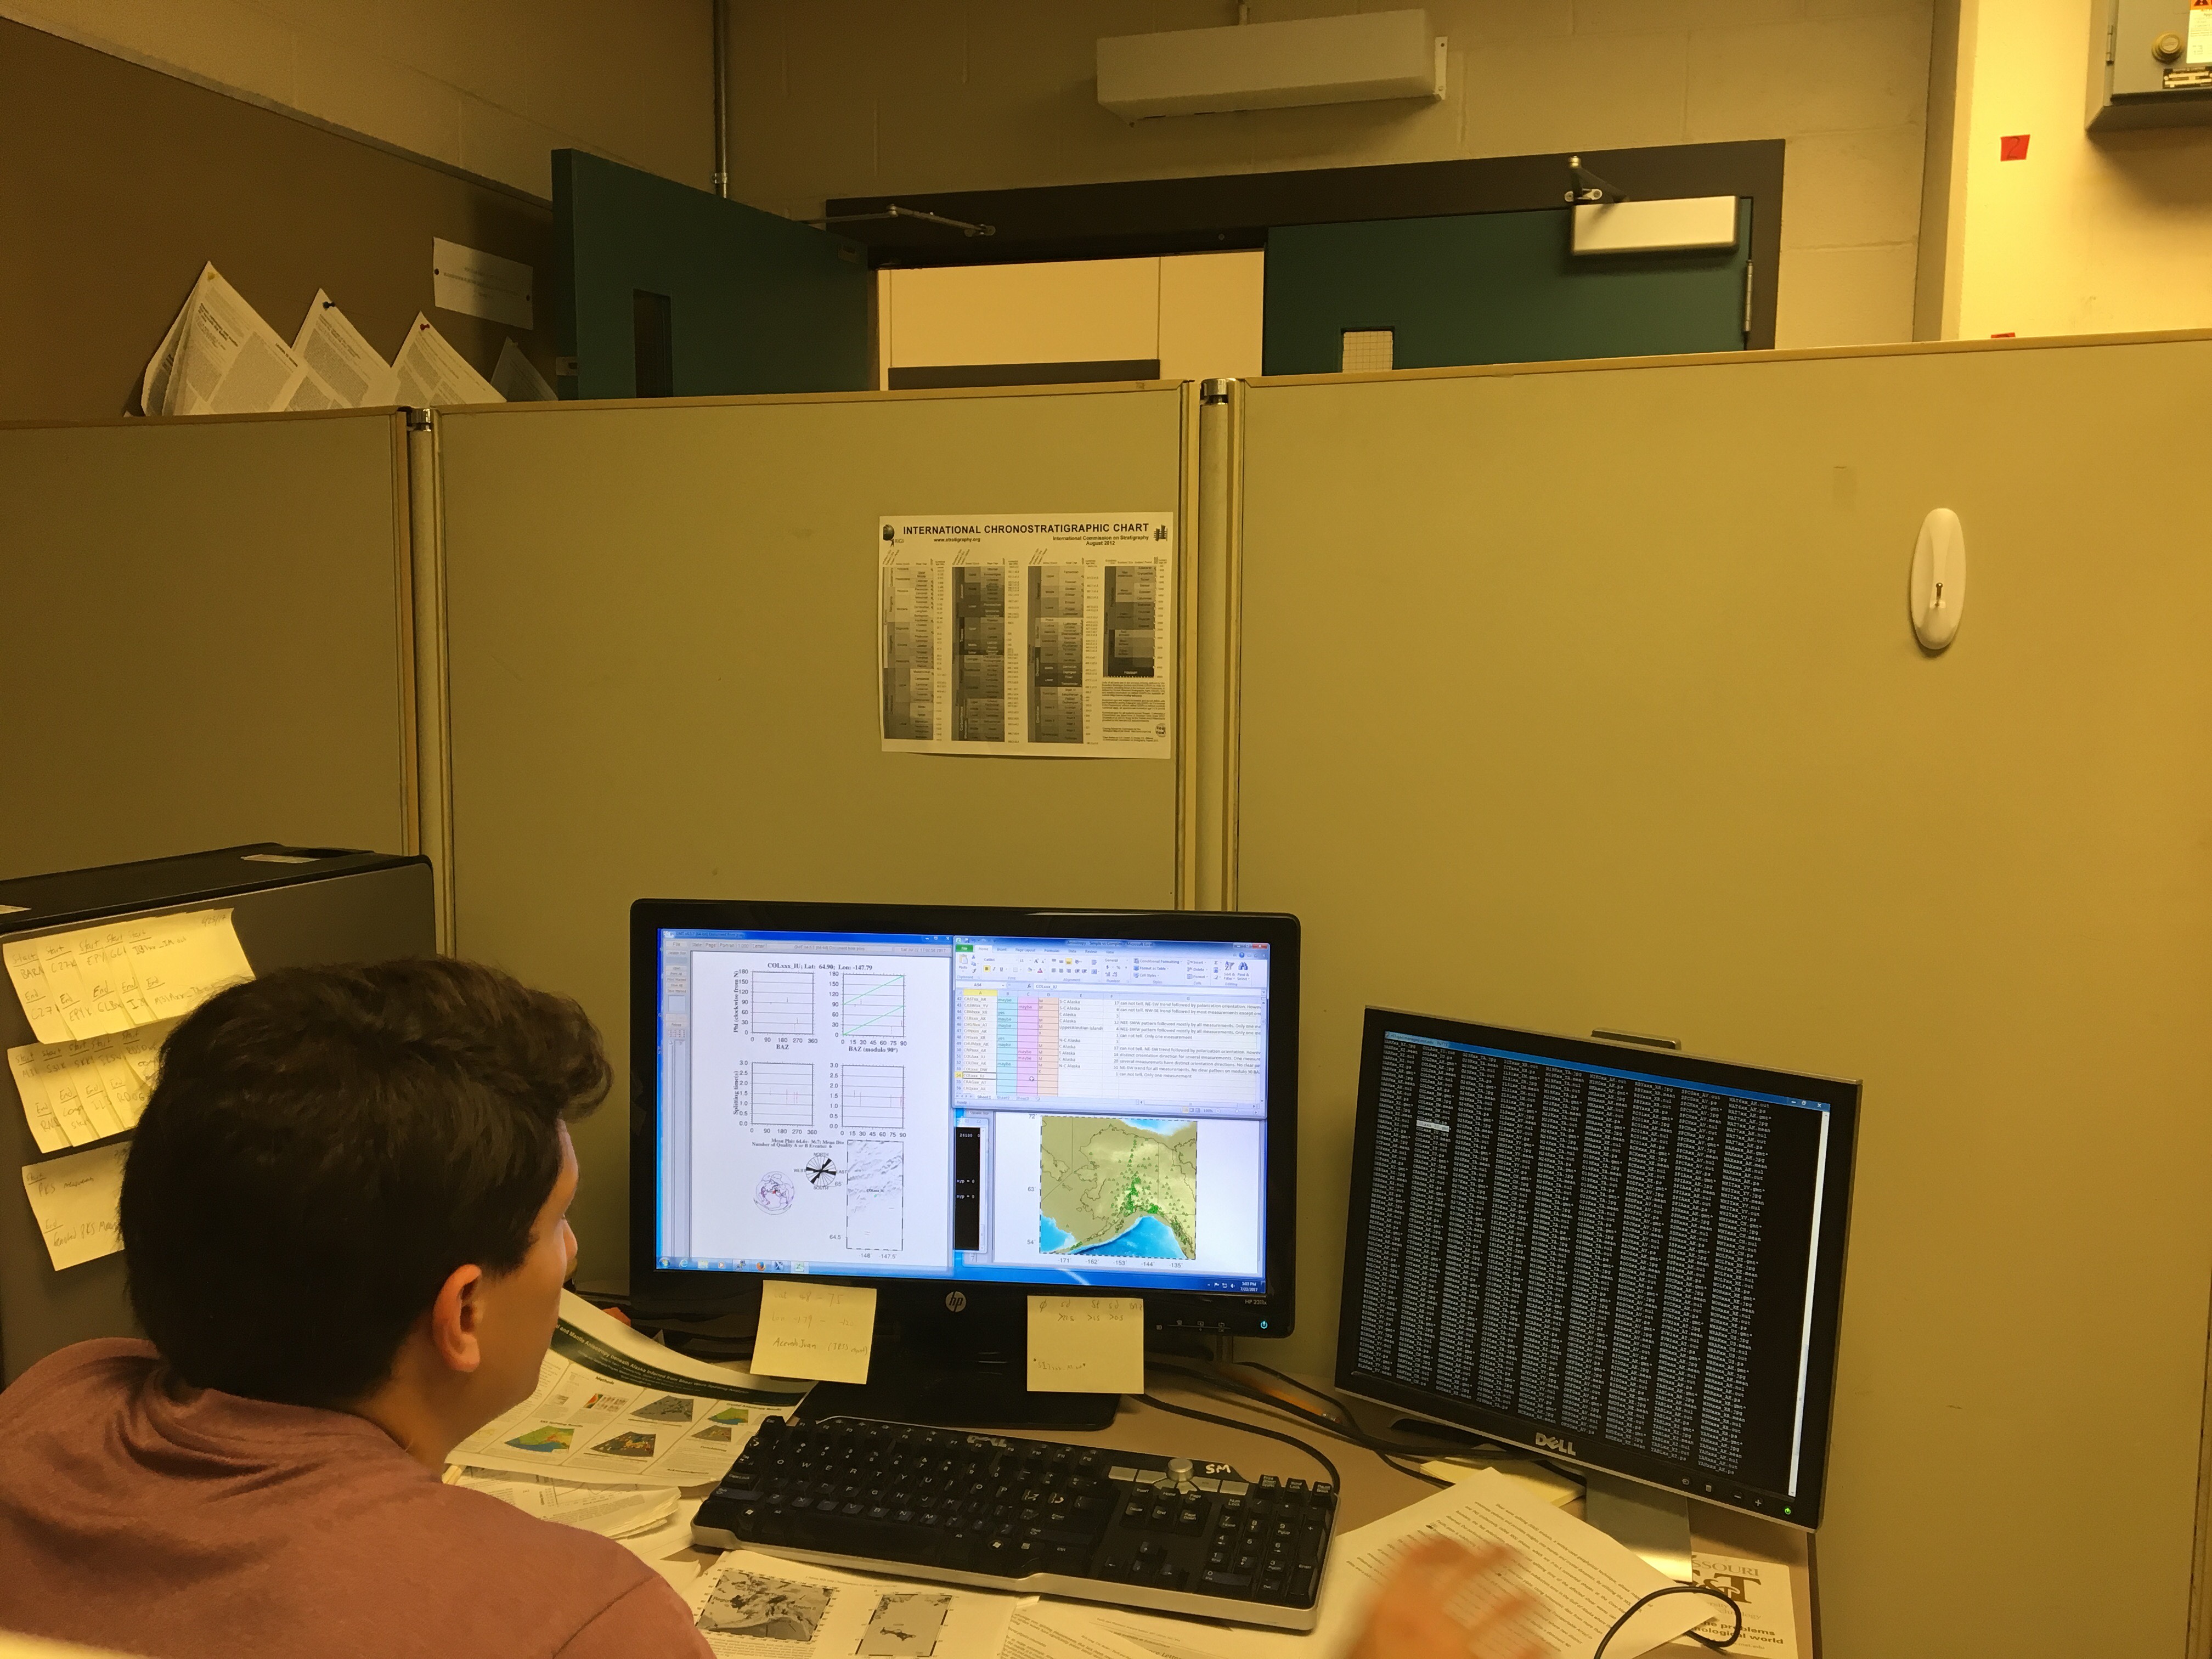
Greetings everyone,
As I am writing this blog post, I reflect on all the things I have accomplished this summer.
I came into this research project with minimum knowledge of the Shear Wave Splitting method and why it was even important. I can now confidently say that I am very familiar with the method, how it is applied, what sort of analysis is required but most importantly, what it means. Pictured above is my workspace, the little cubicle I was in throughout my internship, room B40 of McNutt hall at the Missouri University of Science and Technology. I spent hours on end in this cubicle, and would sometimes even come in on the weekends. But I finally believe I have completed my project, or am really close to. I already submitted my abstract to our AGU session and I'm in the final stages of finishing up my poster.
My experience this summer was similar and different to my experience as an undergraduate in several ways. It has been similar because this is not my first undergraduate research project, in fact, it is my fourth. Therefore, I've had some previous experience with the nit-pickiness and the overall endless amount of edits required to complete a project. It is different, however, due to the amount of time I've had to complete this project and the amount of focus I was able to put in. Normally when I had an undergraduate research project it was during a semester where I was also busy with other classes, sports and other things in general. This project was different from that since it was the only thing I had to focus on, therefore providing me a sense of obligation every day as I came into work to focus on one thing, and one thing only.
Overall, I can say I have very much enjoyed my project and internship experience. I was able to accomplish all of the goals that Dr. Liu wanted me to complete before leaving, and even more on top of that. However, I was not content with my experience outside of the internship. Living in Rolla was pretty dreadful if I'm being honest. I did not make any friends throughout my time here in Missouri so my experience was lonesome. There were very few people in town since everyone was back home for the summer, and because Rolla is such a small town there was nothing to do other than walking to the park or going to the gym, which was my regular activities outside of the job. However, I still am grateful for the opportunity provided to me by IRIS and the Geophysics team at MST. I can see how this internship has benefitted the rest of my career as an undergrad. I am now able to present my work at the most prestigious international conference in New Orleans this December, as well as being able to put down on my resume the fact that I participated in this internship and presented my work at AGU.
Until next time,
Juan P. Acevedo
Blog Entry 6
July 12th, 2017
Greetings everyone,
Currently, I'm in the final stages (hopefully) of my research project. I say hopefully because I'm doing the final task Dr. Liu had requested of me for this summer internship, however, considering she is out of the country at the moment I could be mistaken. If for some reason there is still more work for me to do then I will stay here in Missouri until my project is complete, I don't want to leave any task unfinished.
As mentioned in last week's blog, this was the output figure generated by the automatic data compiler.
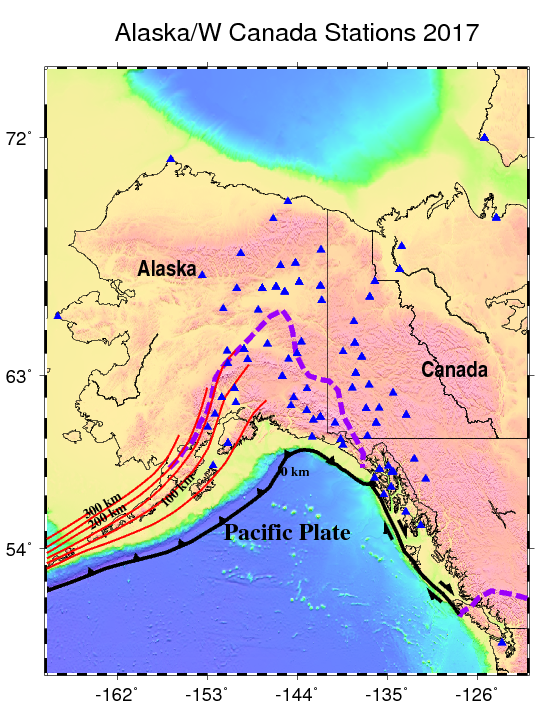
My goal from the previous week was to create a map with all the stations used in the study on top of a topographic relief map showing the Pacific plate subduction zone and the depth of the subducting slab underneath the Aleutian trench. After asking around the office how I was able to create such a figure one of the post-doc students, Dr. Fansheng Kong, was able to guide me in the right direction and I was able to produce the following figure.
The black line represents the northern edge of the Pacific plate boundary with the black triangles indicating the subduction process in the Northern and western side of the plate and the arrows of the Eastern side of the plate show the transform plate boundary motion. The red lines are indicative of the subducted Pacific slab with contour lines at every 50 km. The purple dashed lines in the central part of the map are indicative of the subducted Yakutat microplate and the dashed lines on the eastern side of the map are showing the southern edge of a subducted slab window. The blue triangles are all the station locations for which we have data gathered.
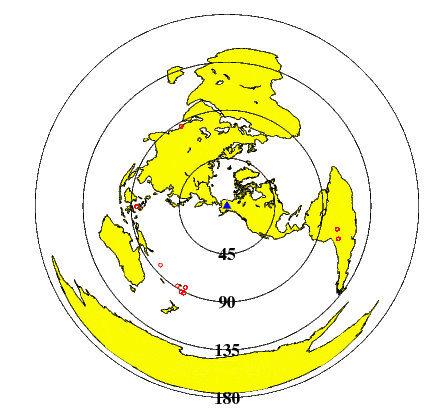
I also wanted to generate an equidistant projection centered in Alaska showing the distribution of earthquakes used for this study.
The blue triangle is centered in Alaska and the red circles are the different earthquake events that generated the data for our SWS study.
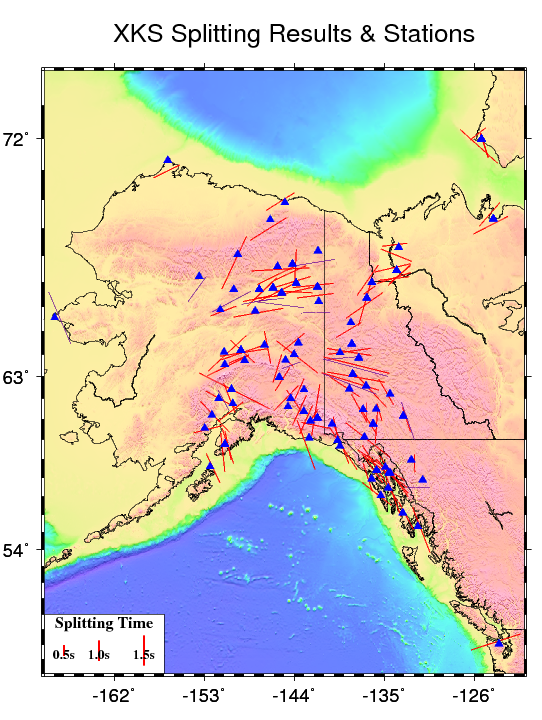
From the automatically generated image, I was able to remove the station names as well as adding a legend and changing the color scheme of the SWS output. Producing the following plot.
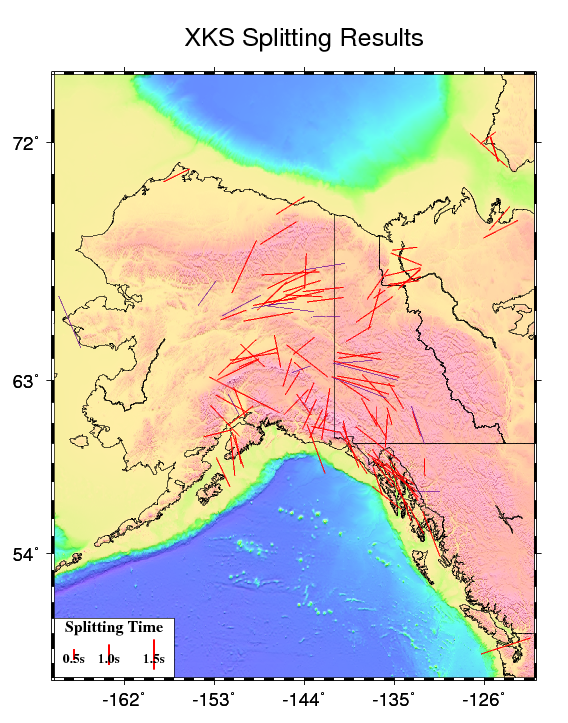
The red lines indicate the SKS phase of the Shear wave split. The purple lines indicate the SKKS phase of the shear waves and the blue triangles are the station locations used in this study. The second image is the same as the first however I removed all the stations from the map in order to better visualize the SWS measurements.
Since I have completed all the measurements required for this study I am now creating a power point presentation summarizing all my research activities this summer. I assume this is a way for Dr. Liu and the Ph.D. students to see if I was able to understand the project in its entirety. As far as I'm concerned my understanding of Shear Wave Splitting (SWS) is at a good level. I am able to see how SWS can be utilized in the analysis of crustal anisotropy and how the different polarization directions and splitting time of the shear waves help us visualize whether we are dealing with simple or complex anisotropy.
Our interpretation of the results from this study suggests that there is a combination of both simple and complex anisotropy present in underneath Alaska. We see a change in the direction of polarization from the SWS results. The southern part of Alaska, where the subduction of the Yakutat microplate and Pacific plate is occurring, the polarization direction of the split shear waves is orthogonal to the direction of the trench, suggesting a mid-crustal flow system responsible for the anisotropy present. However, The northern part of Alaska is dominated by polarization directions parallel to the absolute plate motion of the North American plate. This suggests a case of simple anisotropy where an asthenospheric flow is responsible for the observed XKS splitting parameters.
There are still some things I need to add to my figures such as the direction of the absolute plate motion of both the Pacific and North American plates. By doing so it will hopefully reveal a more concise interpretation of our results.
Until next time,
Juan P. Acevedo
Blog Entry 5
July 4th, 2017
Greetings everyone,
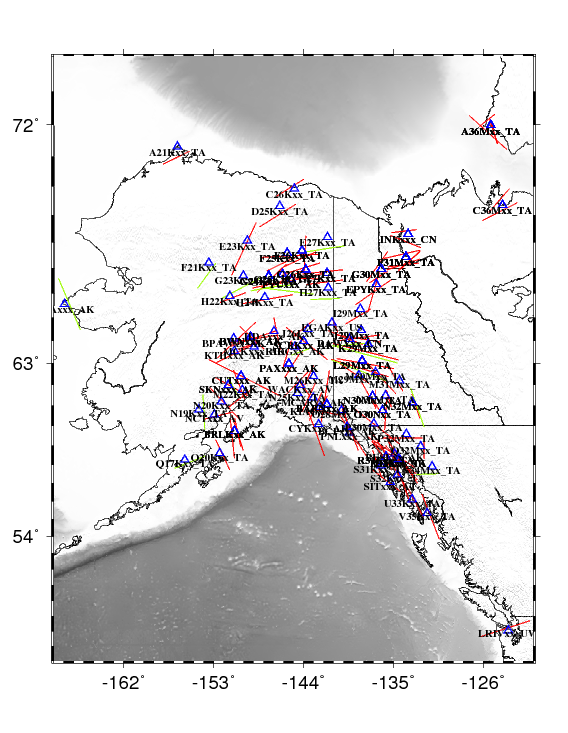
This blog will provide y'all with an update on how my research is coming along. So far the most excruciating and monotonous part of my work is in the past. I have completed all the XKS phase measurements for the Alaska stations. I was able to generate some good data for the SKS and SKKS phases, however, the PKS phase did not have a single set of usable data, therefore my project is consisted of only Shear wave converted phases. From the data that I've collected, I have been able to produce the following GMT plot, however, keep in mind that this map is not complete I still need to add topography and delete the station names.
The red lines indicate the SKS phase split. The length of the bar is dependent on the splitting time and the direction of the line is indicative of the back azimuth direction.
The green lines indicate the SKKS split. There are much fewer measurements for the SKKS phase due to the tectonics of wave travel. An SKKS wave has to reflect twice in the outer core before being converted into an S wave in the mantle, this means that the waves have to come from a greater distance from the source to the receiver and the wave has a higher chance of being attenuated within the Earth's body.
My goal for this week is to create a map of only the SKS and SKKS waves over a topographic relief map, as well as a map portraying the tectonic setting of the Pacific subduction slab underneath Alaska with all the stations' locations used in this study as well as plate motions from the North American and Pacific Plate. Creating these maps will be an important step in my research because I will be able to identify the possible causes of anisotropy. One of the main causes of anisotropy is hypothesized to be an interplay of subcontinental asthenospheric flow within Northern Alaska because the split time direction is parallel to plate motion. Second cause of anisotropy is considered to be a contribution from the mantle wedge within the Pacific subduction zone, causing a decrease in splitting time and rotating the fast direction orthogonally to the North American plate.
I still have a considerable amount of work to do in this project. I need to keep reading scientific literature on the topic and familiarize myself with the area, this will benefit my understanding of the data and will make my research more credible.
Until next time,
Juan P. Acevedo
Blog Entry 4
June 23rd, 2017
Greetings everyone,
This week was much more relaxed and not nearly as fast paced as last week. I've gotten into the most monotonous part of my internship assignment which is just looking at seismographs and trying to identify any sort of Shear Wave Splitting (SWS) present in the software visualizer. However, this week we were given an assignment by IRIS that seemed to be easy at first but as I started to work on it I realized, in fact, how complicated such a task could be. We were supposed to create an elevator pitch regarding our summer project which was basically a 30-60 second summary of our study and why we think it is important. This assignment will be useful for us in the future, especially whenever it comes to AGU since there will be many people interested in our projects but won't want to hear the presentation as a whole. It is the perfect time for us to bust out our elevator pitch and if the listener is then interested in our research we can further engage them in the smaller details of our work.
As mentioned before, this assignment was much more of a challenge than originally expected. As I started writing down what could possibly be my elevator pitch I realized that explaining my project in simple terms was rather complicated. I also realized that it does not sound very exciting or important for that matter, as I kept reading my drafts over and over I was visualizing that people would just think "Ehhh..." and move on. I wanted to make my project sound not only interesting but also crucial to our understanding of crustal properties beneath Alaska, it was important for me to be able to actively engage my listeners with a short, easy to understand summary of my work. I finally completed an elevator pitch that I was content with, total length at around 42 seconds describing what I do and how SWS will be a useful tool to understand better the crustal dynamics of the lithosphere at the Pacific subduction zone beneath Alaska. It *only* took me a total of 2 & 1/2 hours to complete this assignment, however, I'm pretty satisfied with my work and am able to use this elevator pitch not only at AGU but whenever anybody else asks me "what are you doing your research on?"
Until next time,
Juan P. Acevedo
Blog Entry 3
June 19th, 2017
Greetings everyone!
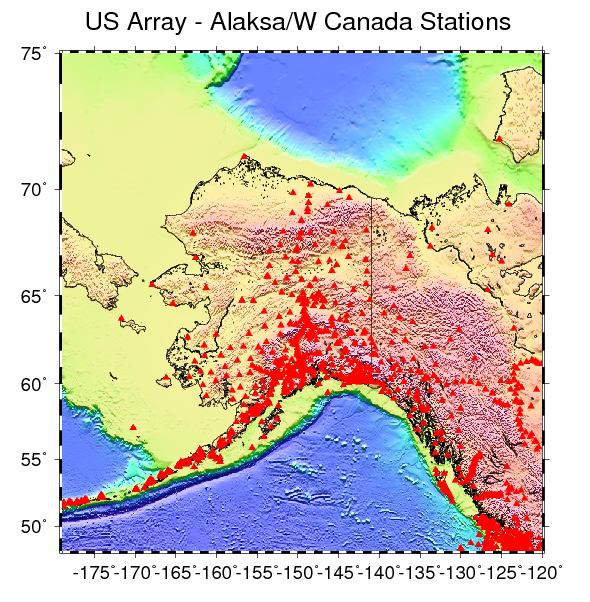
My second week of the internship was extremely busy and fast paced. I started off the week by creating a map of the study area that I would be focusing on and plotted all the possible US Array station locations on the map itself. A total of 734 stations currently active in Alaska and data was requested from all these stations in the IRIS Data Management Center (DMC). However, whenever we requested the data sets from the DMC many of the stations did not have any active data for our time period of study which starts on Jan. 1st, 2017 - May 31st, 2017; only a total of 266 stations did have data that could be used for this project.
This is a plot of all 734 stations present in the US Array in Alaska and Western Canada.
The data set that we have collected is passive source data of earthquake recordings from each of the 266 stations that have do have present data. Each of these events then goes through an automatic filtering process written by Dr. Steven Gao and my advisor Dr. Kelly Liu. Since the purpose of the study is to analyze any anisotropy present beneath Alaska through the use of Shear Wave Splitting the seismic readings are divided into the different phase components. The filtering process itself then ranks the measurements received and assigns them a value based on the quality of data, the different values that can be assigned are A (outstanding), B (good), C (bad), N (null) and S (special). We then have to go through a re-screening process of all the data ranked A, B, N or S (all automatic C values are discarded) in order to verify the accuracy of the automatic filtering process.

A plot of data file with a rank of A (outstanding).
The first plot shows the original and corrected Radial and Transverse component of the SKS wave. We try to look for energy present in the original Transverse and no energy in the corrected Transverse.
The second plot shows original and corrected fast and slow wave from the shear wave split. We try to look for a match of shear waves in the corrected plot.
The third plot is showing original and corrected particle motion. We try to look for an elliptical orbit in the original plot and a linear movement in the corrected plot.
The fourth and final plot is an energy plot showing the different parameters we take into account. We try to look for a clear minimum in splitting time and fast direction contour plot which is represented by the star. The value of the minimum are shown at the top of the graph as ø (fast direction) +- the standard deviation (we want values below 22.5) as well as the δt (splitting time - we look for values lower than 1.5) +- the standard deviation (we want values less than 0.5).
Currently, I find myself in the data processing part of the project; I have data for all 266 stations and have started the re-screening process for all the seismic readings. This is considered by my project advisor to be the most painstaking part of the whole process, however, I find it to be a crucial part to the project and my personal work as a geophysicist. The skills I'm acquiring through this process will not only help me become a more experienced seismologist but it will help me understand better how the project unfolds.
My goals for this upcoming week is to update the Alaska map to reduce the numer of stations present in the figure and only show the stations for which we have data. I also want to continue with the re-screening process and work through it as swiftly and efficiently as possible.
Until next time!
Juan P. Acevedo
Blog Entry 2
June 9th, 2017
Greetings everyone!
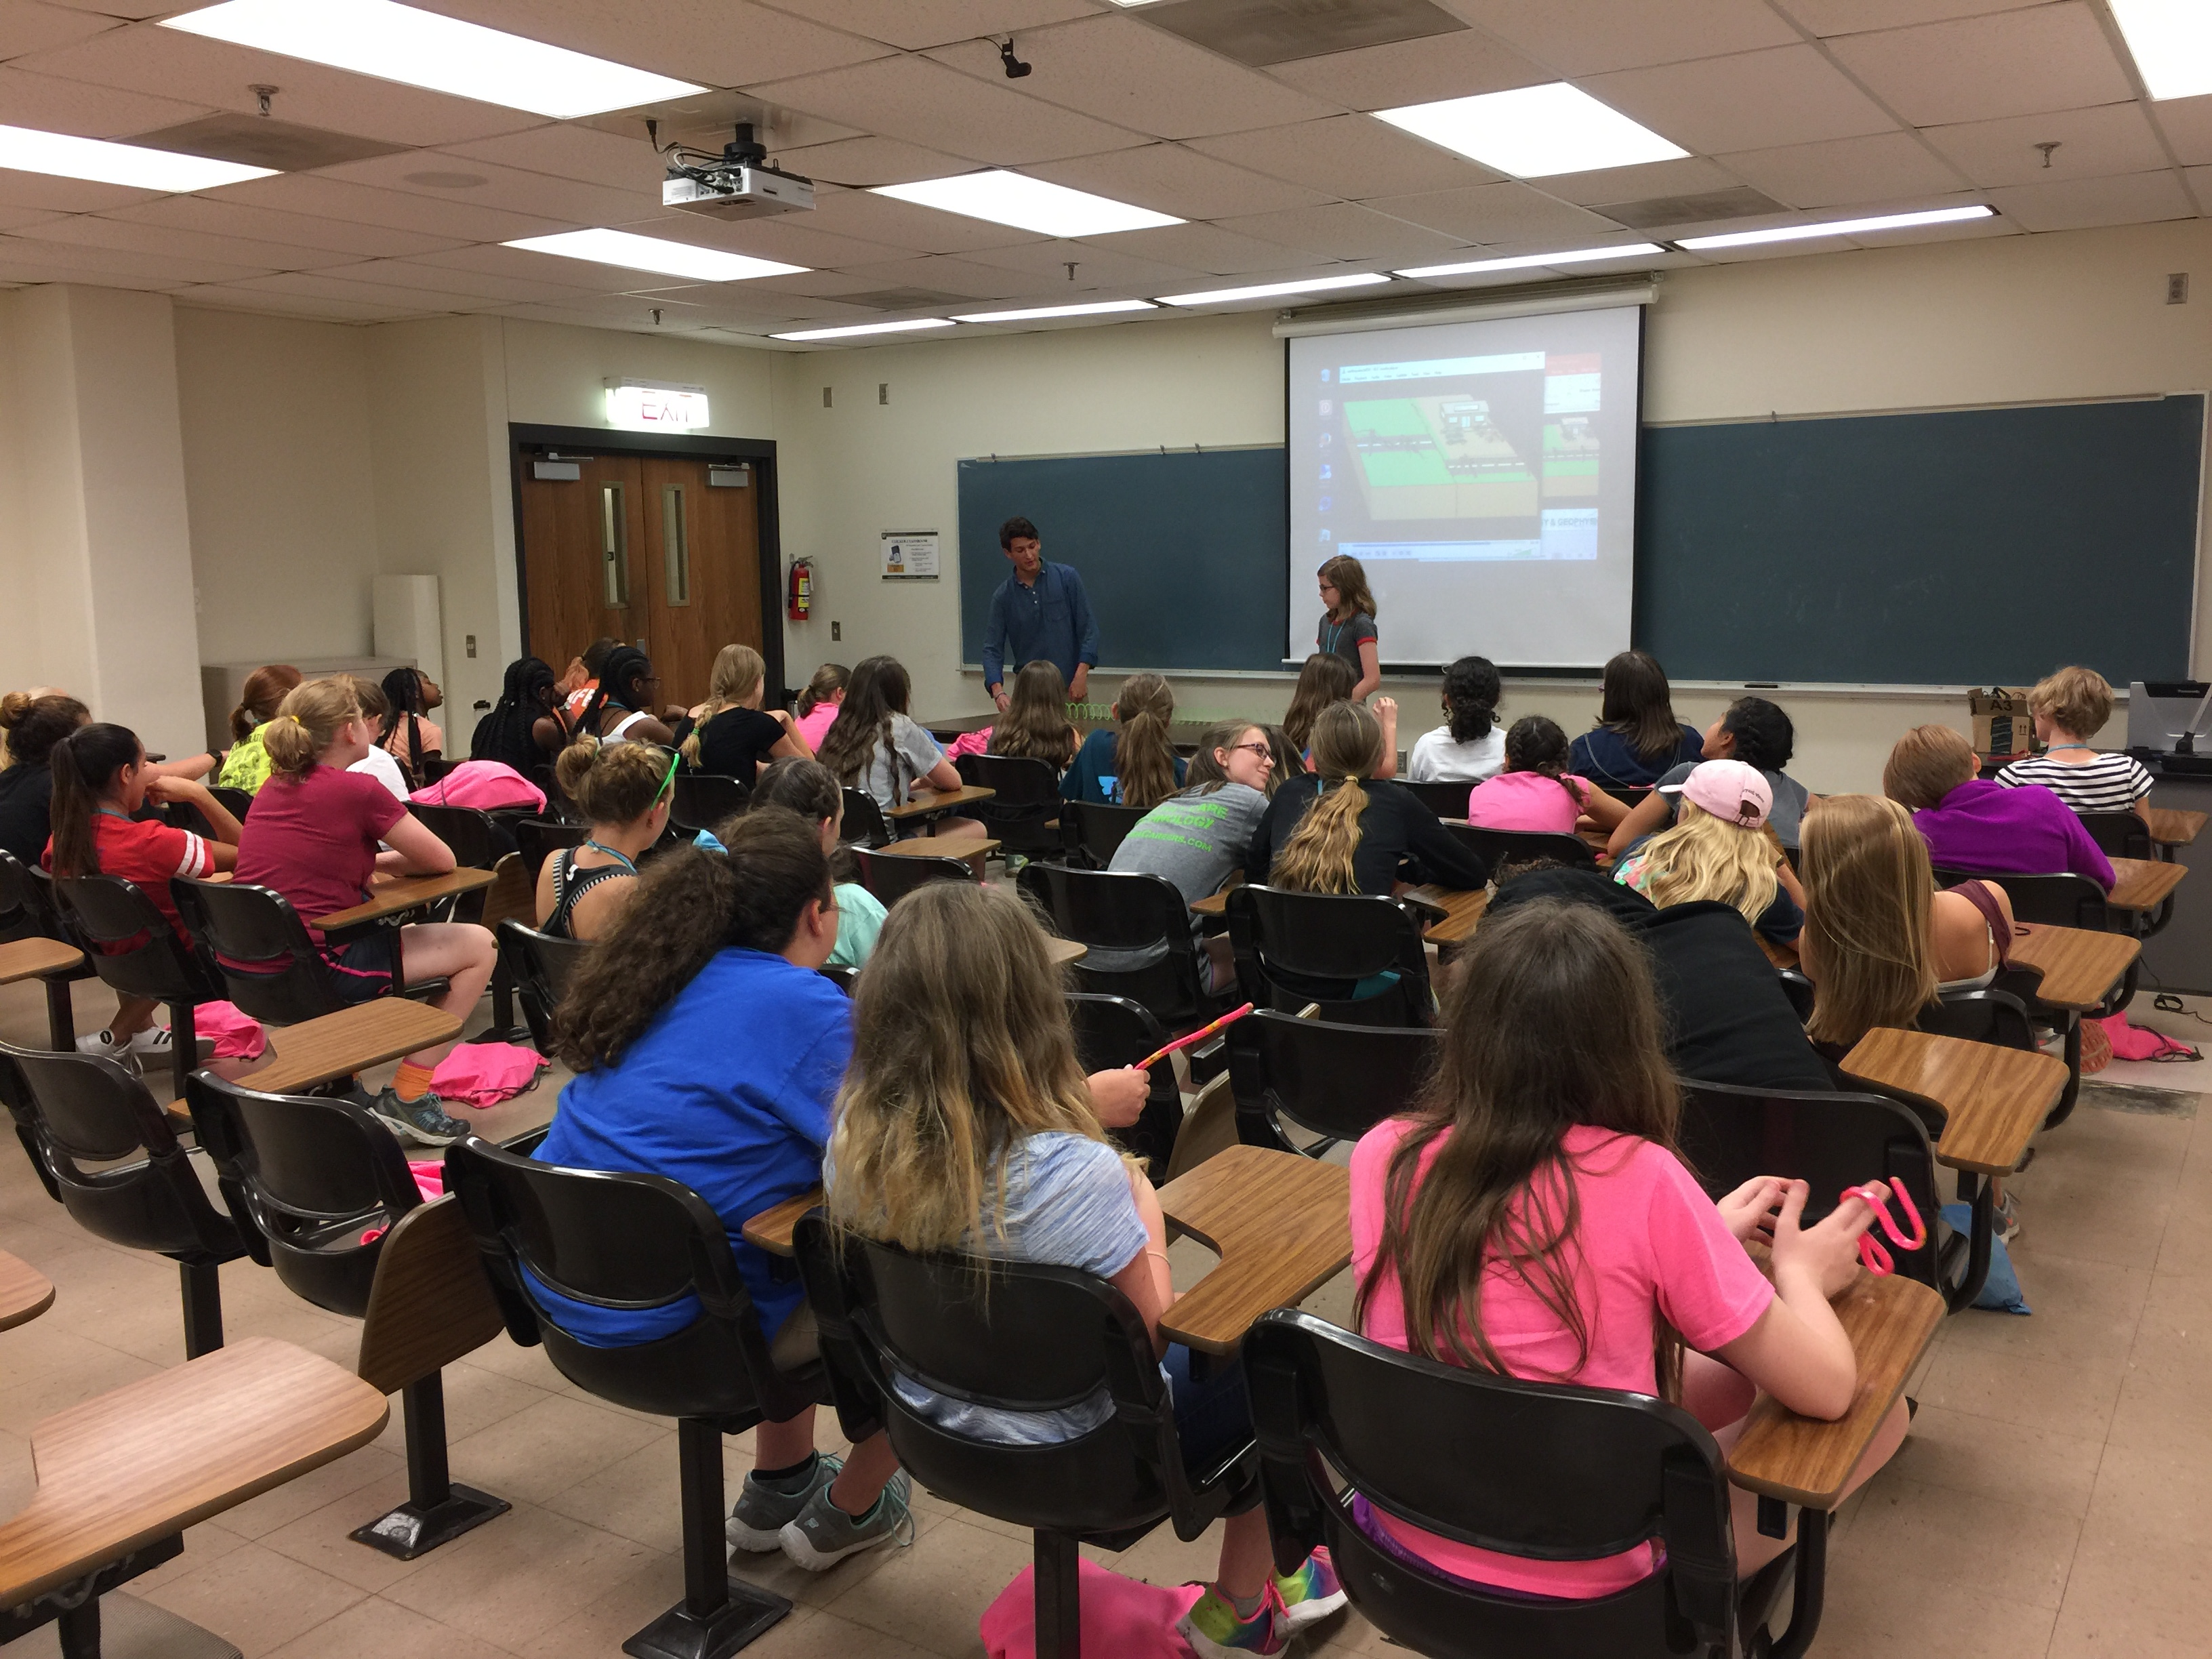
Today marks the final day of my first week of internship for IRIS. It has been a pretty slow week for me; I still have not been able to gain access to the computer systems, therefore the start of my project has been delayed up until next Monday. However, I did have some excitement within the last couple of days. I had to prepare a short presentation I was going to be giving to a girls summer camp who were all interested in sciences. Dr. Liu asked me to focus more on a hands on explanation as opposed to a power-point presentation which is what she had planned herself to do. I decided I was going to teach these girls about seismology and how geophysicists use seismic waves to study the Earth's interior.
The presentation started off with Dr. Liu talking about herself and what the role of geophysicists are within the scientific community. She had some short explanations as to why we want to study the Earth's interior and why it is importatnt to continue this field of study. When she finished giving her presentation it was my turn to demonstrate what I had planned. I was very nervous at first, this was my first real teaching experience so I was worried that I would not be interesting or I would stumble on my words. That was not the case, however, as soon as I started talking I saw the girls interest peak and they began asking questions and being extremely interactive. This gave me a sense of encouragement, I realized that these girls were eager to learn and their intesrest really seemed to intensify whenever I was showing them the simulators I had for the earthquakes and volcanic data. I then set up a passive source, three componet seismometer and had them al stomp their feet really fast and really loud in order to trigger the alarm system in the seismic software. Whenever the STA/LTA readings gave a value above 4.0 an automatic alarm would set off letting us know that there is a potnetial earthquake being recorded. The girls stomped away, they were having lots of fun until they finally triggered the alarm system. The whole clasroom lit up with cheer and people were clapping and high-fiving each other.
I can definitely say this was an unexpected task for me to do this summer, I was mostly thinking I'd be doing computer work and analyzing seismic data. However, I had loads of fun teaching these girls about geophysics and it really gave me a feeling of productiveness and sympathy. I'm glad I was able to take a part in this learing experince for these girls and hopefully I could've inspired at least one or two of them to become geoscientists.
Until next time,
Juan P. Acevedo
Blog Entry 1
June 7th, 2017
Today marks the second day of my official internship here at the Missouri University of Science and Technology in Rolla, MO. However, let me give y'all a quick flashback to my journey from Texas to Missouri. The drive from College Station to Rolla was pretty decent, I didn't have too much trouble on the road except for a big storm that hit eastern Oklahoma while I was passing by, the wind was so strong I could feel my car drifting. As soon as I got to Rolla my first objective was to find some food because I was starving. I headed over to the sports bar that was a five-minute walk from my apartment and I had THE best french dip sandwich of my life (I liked it so much probably because I was extremely hungry, nevertheless I enjoyed every second of it). Once I was satisfied with the meal I went back to my apartment, unpacked everything and then made a Walmart run to purchase any necessary things for my time here.
The next day was my first day at the University where I officially met my advisor Dr. Kelly Liu and her Ph.D. students whom I will be working closely with throughout the summer. However, due to unfortunate circumstances (*cough* I.T. Department *cough*) I wasn't able to get access to a University computer account and was not able to start any actual work on my research. I spent the rest of the day sorting out my IRIS assignments and reading the papers that Dr. Liu recommended for me to read in order to gain a better understanding of the research I'll be doing this summer. Once the day was over I made my way back to the apartment where I went out for a run and rewarded myself by cooking a big dinner as soon as I got back.
Back to the present. I have been in the office for a little less than an hour now and my first order of business was to go talk to the I.T. department who still have not been able to get me a computer access account. I'm supposed to always give it at least a 24h processing period so I will ask again tomorrow. Hopefully, this process doesn't take too long, I'd like to get started on some actual research as soon as possible. Looks like I will be reading and annotating some more research papers again today.
That's enough of an update, now I'd like to switch to some of the goals I'd like to accomplish this summer with my project.
1- Enjoy my work. It is important for me to be able to have a good time while I'm working on my project, I feel productive and motivated especially when I'm genuinely interested in the work that I'm doing.
2- Become familiar with Unix. This is the software that I will be using mostly throughout my project and it is an important skill set to have as a geophysicist.
3- Understand the SWS method and how it relates to anisotropy. This is probably the main purpose behind my research project, therefore it is important for me to be able to fully understand the shear wave splitting analysis and how exactly it is contributing to our understanding of anisotropy beneath the Alaskan subduction zone.
4- Explore Missouri. This is my first time in the state of Missouri and I've only heard good things about it, I'm excited to be able to go on lots of outdoor adventures such as hiking, camping, and even swimming.
5- Keep in touch. As much as I love my independence and to be able to do things on my own, I'd also like to put an effort into keeping in touch with my friends and family throughout this summer (Yes, this includes all the other IRIS interns as well).
Until next time,
Juan P. Acevedo
Orientation Blog Entry
May 31st, 2017
Today marks the third day of our orientation as IRIS interns. So far we have all had a good time getting to know each other, we can see how each person has a unique knowledge in their particular field and we can all work together as a team. Our assignments so far have been quite extensive, we have early morning meetings and we sometimes go late into the night still working on whatever task it is we have at hand. The most important thing for the IRIS internship program, in my opinion, has been all the team building exercises we have done, they really help the dynamic of the group and help each person feel included in the whole process of this internship. Many geophysical tasks we have had to do really give you a sense of the process of what it is like to be an intern and a professional, whether it is individual tasks such as MatLab, or group tasks such as setting out the seismometers that we did on the first day.
So far I have enjoyed the first couple of days as an IRIS intern and I'm excited to see what will happen throughout the rest of the summer!


