Abraham Wallace

Abraham Wallace is a student at University of Oklahoma currently completing his research at University of Washington under Dr. Erin Wirth.
I'm working at the University of Washington, studying Mount St. Helens, using data collected from the iMUSH project with Dr. Erin Wirth. (check out imush.org for more information!) We're going to perform a shear-wave splitting analysis on the seismic data, with the hopes of determining the state of deformation and strain of the mountain.
It’s Been a While…
July 12th, 2017
Hey guys! I haven't posted much, and unfortunately, I don’t have a lot of results to show for my work… yet.
I’ve spent the past few weeks running down falling down different rabbit holes, that ultimately turned out to be relatively useless. To summarize, I’ve spent a considerable amount of time doing the following:
1) Setting up some pre-packaged MATLAB code designed to take measurements on SKS waves to take measurements on Local S waves
2) Debugging said MATLAB code (Note: This task is both infinitely long and frustrating)
3) Creating a custom catalog (using another script) of earthquakes larger than magnitude 1.5 that occurred around Mount St. Helens. The catalogs that came with the script only went down to Mag 4, which wasn’t as low as we would have liked.
4) Meeting with professors, learning that there are still some major bugs in this code, and that it would probably be best to go back to taking SKS wave measurements.
5) Re-downloading the prepackaged code and just taking SKS measurements
To say the least, this has been frustrating.
I guess what has been really surprising about this experience is that you really do have to be flexible when it comes to research, because sometimes the project just won't pan out in the way that you had hoped. Nevertheless, we'll adjust our goal, and keep trying.
Luckily, I’m back on track, and the research looks promising! I’m giving myself the rather ambitious goal of looking at all of the iMUSH stations within the next 4 days. This is, without a doubt, one of the more boring parts of the research; there isn't a lot of fun to be had while sorting through mountains of data, but it has to be done. Once I'm done, however, I can start making some figures, which seems to be a bit more enjoyable!
Until then, you’ll probably find me at my desk, staring at either a seismograph, or a python script.
Cheers,
Abe Wallace
Elevator Pitches
July 2nd, 2017
Hey guys!
Sorry about the delayed response; I've been a little preoccupied in Seattle, and haven't given myself much of a chance to sit down and blog for a while now. That being said, I drafted an elevator pitch for my research this summer...
More specifically, I drafted three separate elevator pitches for my research project this summer.
I wrote one for other siesmologists, one for a general scientific audience, and a very general one that touches on the main points of the research and its potential outcomes and the effects thereof. I found that this assignment was not really that difficult, mostly because I had been practicing it since before I left Norman for the summer. I always had people ask me what I was doing for the summer, and when I told them I was in Seattle for an internship, I usually was asked to elaborate, and as a result I have had a "spiel" ready for a while now. (On a sidenote, I'm also pretty good at explaining what IRIS is to people quickly and effectively. This particular speech has come in handy multiple times!)
I suppose the thing that has changed the most since my first explanantion of the project is that I understand a lot more about what is going on in the research. When talking about the project, however, this can be both a blessing and a curse; I find myself spending days looking at siesmographs and generally wading through data. This is of course a useful and necessary part of the scientific method. However, if I were to tell people that I'm going to look through over ~7,000 siesmographs to hopefully take ~700-1,250 measurements that may or may not tell us something about Mount St Helens, they would say that my summer research project sounds a bit dull, and not very exciting. If, however, I were to focus on the big picture things, like how this data was collected, and what the ultimate goal of the project is, the project seems more exciting and useful. The elevator pitch, I think, really embodies the latter of these two explanations, and is a really good way to make the research more approachable to people that aren't experts in the given field.
While the elevator pitch is good for communicating science in an effective way, I imagine that this skill will also be great to have when it comes to writing grant proposals. As researchers, our livelihood partially depends on our ability to "sell" our project to people like the National Science Foundation, so that we can continue to ask and answer questions, and it seems pretty obvious to me that the easiest way to sell an idea is to present it in a such a way that is not only easy to understand, but also shows how it might benefit society.
Cheers,
Abe
Week 2: Filled with papers, maps, and stories of misadventures in the field.
June 18th, 2017
It’s the end of week two of the internship, and I’ve done my best to hit the ground running, and keep moving. In these nine days, I’ve looked at over 2,000 seismographs (and we’re just getting started!), and read 10 scientific papers on shear wave splitting and Mount St Helens. To be honest, I was expecting to read a decent number of papers, but I wasn’t really prepared for how intellectually engaged you have to be while reading them; you can’t just gloss over sections and expect to fully understand all of the writer’s main points. When I mentioned this to my dad, a retired OU professor, he just laughed and said, “Well, yeah. That’s part of the business!” Knowing that this of course would be a part of my summer, I could only reply with “touché.”
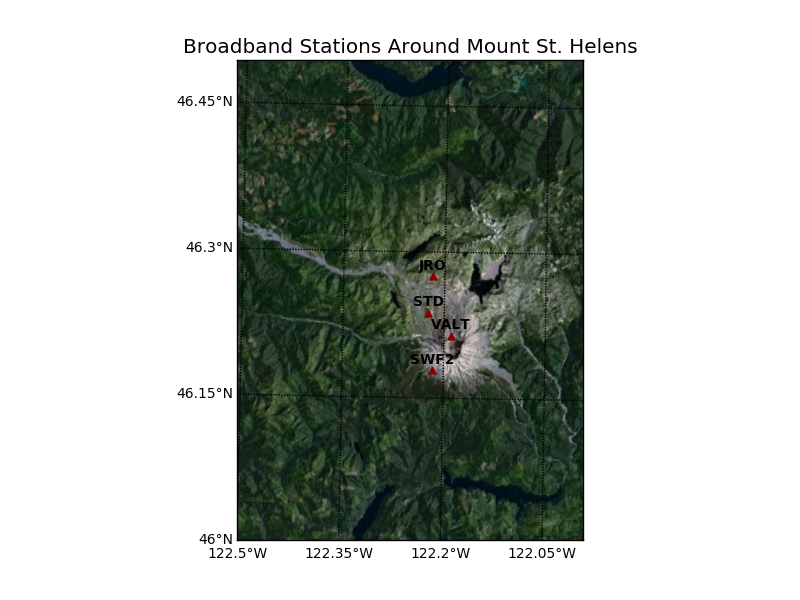
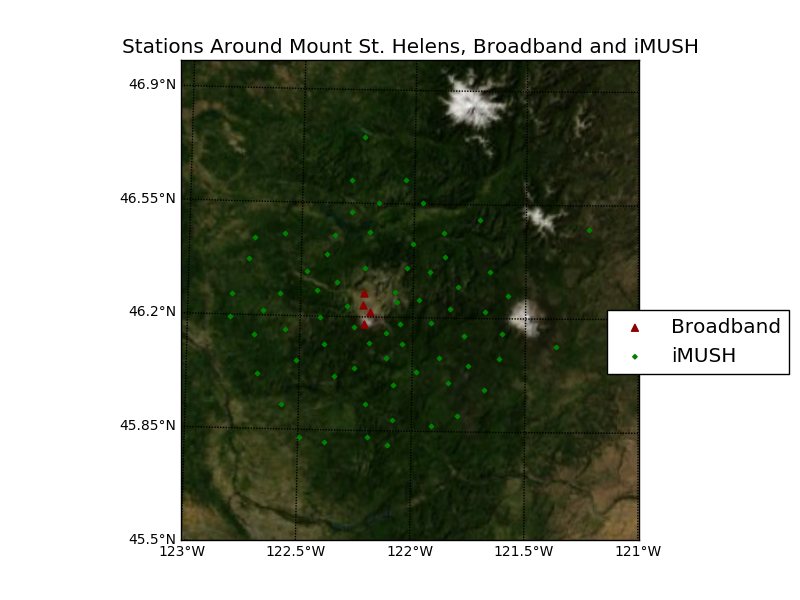
I’ve also started to learn to code in Python, and have managed to make a couple of maps. I think they look pretty nice! I’ve put them in this post below, so you can judge for yourself if they deserve a spot on the AGU research poster.


The maps are of the seismometer stations deployed around Mount St. Helens. The red triangles are the four broadband stations that are continually collecting data on the mountain (one of them had recorded > 800 magnitude 6+ earthquakes!!), and the green diamonds are the iMUSH stations, which is where we’re getting the majority of the data for this project.
The iMUSH stations were deployed as a part of the iMUSH (Imaging Magma Under St. Helens) experiment in 2014. On the whole, they comprised an array of seismometers that passively collected earthquake data for 2 years. Deploying them, and then retrieving them later, turned out to be quite a challenge! I talked to Dr. Ken Creager, and Carl Ulberg, two of the people heavily involved in the iMUSH project about the experiment, and they were all too happy to share some stories. At each of the 70 locations, the deployers had to dig a hole for the seismometer, place said seismometer in a “vault” that was then put into the hole and cemented in the ground, then set up a digital recording system, as well as a solar panel to power the whole thing. Dr. Steve Malone, another professor at the University of Washington, posted quite often in the blog for the experiment, and explains the process of deploying stations very well (and with pictures!) here: [url=http://imush.org/blog/2014/06/22/a-day-in-the-life]http://imush.org/blog/2014/06/22/a-day-in-the-life[/url]
While deploying was rough, sometimes it was difficult for the instruments to stay operational in the field, due to natural or human interference. Dr. Creager had a lot of good stories about these ‘interruptions!’ One concerned local apparently also saw a station and reported it to the FDA, saying that the setup was most likely a meth lab. The FDA phoned Dr. Creager about the seismometer, and proceeded to take apart the entire setup, and left everything there in pieces. I can only imagine what a strange phone call that was… Another site actually caught fire, and when the researchers came to extract the data and equipment, they only found the charred remains of a breakout box, solar panel, and seismometer. (I’ve put in a pic of the box, too. It was pretty incredible.)
On the left is what used to be a car battery, which provides power to the operation, and is normally supplemented by the solar panel. The other parts include a power monitor, a recording system, and a lot of wires.
Nevertheless, the experiment has yielded some very good data, and some results have already been published! (Hansen et al. 2016, Kiser et al. 2016). My part of this project will be doing a shear wave splitting analysis of local S waves just below the mountain, as well as SKS waves that travel through the core, all of the mantle, and then the crust to the stations. I’m pretty lucky, because there is already a program called SplitLab that makes these measurements relatively painless. I think the hardest things will be determining the criteria for which we’ll do the analysis. We’ll have to choose earthquakes to view based on their magnitude and place of origin. We’ll also have to figure out exactly how we want to filter the data, something that will almost definitely be different for the S wave analysis and the SKS wave analysis. Despite these small weaknesses, I’m really excited to dive into this dataset! What is really neat about my part of the iMUSH project is that shear wave splitting analysis hasn’t actually been done on any volcanoes in this region, and definitely not with such a dense array of instruments. With any luck, we’ll find out some really cool things about the anisotropy of the volcano!
During this coming week, there will be a small convention of everyone working with the iMUSH data, and I’m lucky enough that I also get to go and see what everyone else has been doing with the data and learning about Mount St Helens. I hope that this will end up being a good opportunity to practice explaining my research to other scientists in a comprehensible manner. This task includes talking about where the data came from, what specific parts of the dataset will be used, what the measurements tell us about the volcano, and how those inferences relate to the geology of the region. More importantly, it includes saying all of those things in a way that is easy to follow and understand. As an undergraduate, this is not something that I am not used to doing, but it was pointed out to me, and the rest of the IRIS interns that it is definitely an important skill to have, for obvious reasons. Hopefully this convention (and this blog) will help me hone that skill!
Anyway, that's all of my updates for now, I guess. I don't have a funny story about me tramping around a stranger's backyard for this post, but I'll what kind of trouble I can get into for next week!
Cheers,
Abe
Day 1: Apple Maps, and My Personal Roadmap for the Coming Weeks
June 7th, 2017
After finishing orientation in Socorro last week, I began the long rive to Seattle, WA. Despite fires and 50+ mph winds in Idaho (These made for an intense few hours!), I rolled into the city Monday afternoon, June 5th. I had arranged to stay with a family for the summer, and decided to find out where I would be sleeping before exploring the city. Here's the catch: the family with which I am staying was not home when I came to the house. "No worries!" I thought, "They told me that if they aren't home, then they'll put out a hide-a-key that I can use!"
Little did I know that when I had taken directions from my iPhone, Siri had led me astray. As it turns out, Seattle is laid out pretty systematically, with most streets just being numbers labeled with a cardinal direction (for example, N 40th St). There is however, a set of streets labeled "North," and another set of streets labeled "Northeast." Apple maps has a hard time distinguishing the two...
I spent the next twenty minutes walking around that backyard, looking for that stupid key, only to come to the realization that I was in the wrong backyard. Thankfully, I realized this before anyone came home to a poor, lost stranger from Oklahoma wandering around their tomato plants.
Since then, I am happy to report that I found the house, and the family's daughter was kind enough to help me orient myself in this new place.
Today, June 6th, was my first day working on the project. First days usually consist logistics, and getting set up for the tasks that lie ahead. This one was no different. Erin Wirth and I met that morning, and we set up a wireless account for my computer, and got me set up in an office. After a quick tour, and a lot of introductions, we downloaded a program called SplitLab, and began taking Shear Wave Splitting measurements with a well-documented data set. This took up the rset of the day, and will serve as practice for when we take these measurements on the research prject. These calculations turn out to be pretty tedious and time consuming! Neveretheless, they're fairly enjoyable to make. The general theory behind what we're doing has to do with the fact that the transverse component of an S-wave can be described as the sum of two orthogonal vectors, and that these vestors move faster of slower in a medium, depending on the anisotropy of the region. For our case, this anisotropy has to do with faults and strain under Mount St. Helens, and it seems (as far as I understand it) that the waves traveling parllel to the faults travel faster. As a result, they arrive to the seismometer first, and the other half of the wave arrives a bit later.
The program runs as an extension to MATLAB, and essentially lets you load in a bunch of seismic data and pick a waveform. From there, it sees if there is a similar waveform in the data appearing at a different time. If it finds something close, we can take the measurement, and look at the "fast direction" of the wave, and use that to interpret the direction of faults, etc. under the mountain.
Hopefully, I will be able to explain that a bit better after doing some more reading on the subject. (that was also given to me this morning!).
So here's the general roadmap for me for these next few weeks:
1) Download Google Maps so I don't end up tramping around someone's backyard again.
2) Read the papers given to me by Dr. Wirth. Hopefully, this won't take longer than a week or two.
3) Begin learning Python, with the goal of making maps of the stations from which we are pulling data. This will take all summer, but I'd like to have the first map done within a couple of weeks
4) Finish this practice set of data, so that we can start looking at iMUSH data. To do everything right will take time, but a few weeks should be fine. From there, we can start to look at some of the more interesting stuff!
5) (for the second third) Begin taking SWS measurements on the iMUSH dataset. First,we'll look at SKS arrivals (Shear waves that propgated through the outer core as P-Waves, and converted back to S-Waves), and make maps and figures of what we find!
6) (the final third) Repeat #5, but for shallower earthquakes near the mountain, as they'll be indicative of shallower anomalies.
7) (throughout) prepare an abstract and begin working on a poster for AGU in December.
8) Get lost a few more times in Seattle. This is a really wonderful place, and I wouldn't be doing myself any favors if all I did was stay inside and read/make maps!
So here we are. The first day was very good, and I'm really excited to work with Dr. Wirth on this project. Here's to lots of productive days, and a very happy adventures along the way!
Abe Wallace
Hello!
May 31st, 2017
My name is Abraham Wallace, and this summer (2017) I am going to be an IRIS intern working in Seattle, WA with Dr. Erin Wirth studying Mount St. Helens. Our research will use data from the iMUSH project to interrogate the strain and deformation state of the volcano, and we will do this by performing a shear-wave splitting analysis on the data set. Currently, all of the interns are in Socorro, NM for an orientation week, after which we will all drive/fly to our respective project sites. I'm very excited for this summer! I have been lucky enough to do a little research in the past as an undergraduate, but all of that was with professors at my home university (University of Oklahoma) that I knew well from taking their classes. Diving into this is admittedly a little scary, but everyone in the IRIS community is very supportive and helpful, which is comforting.
Hopefully this research will produce some very useable results! I also hope to have some time to explore Seattle; I haven't spent much time in that area of the country, and I hear that there are a lot of wonderful things to do outside!


