Megan Zimmerman (Torpey)

Megan Zimmerman (Torpey) is a student at The College of New Jersey currently completing her research at Harvard University under Miaki Ishii.
The Harvard seismic station has continuous data available for the past 80 years. The ultimate goal of this summer's project is to digitize some of the old seismograms and find a way to do some single station analysis. The digitization is self explanatory. Once I do a quick surface cleaning of the seismograms and scan them into the computer I will be trying to determine the best way to digitize these old records. Currently there is no widely accepted software to use so digitization is proving a bit difficult. However, the single station analysis is a much more complicated undertaking. I've created a database of current earthquakes recorded by the Harvard station and, since we know where these current recordings originated and their focal depths, we can use this database to test our analysis techniques. Once we are confident in our single station analysis techniques we can use them on our old digitized seismograms to try to determine certain information for the earthquakes recorded such as distance, azimuth, and depth.
The End Is Only The Beginning
August 14th, 2010
Well, after spending the last 2 weeks writing up a 145 page report of my summer's progress, I left Harvard yesterday. The 3 months I spent there were filled with interesting research. I must say that the research presented to me was much more challenging than I had expected. Unlike a typical research project where the method of approach is already known - I was responsible for finding and analyzing potential digitization methods. Due to problems with the programs I investigated, I was not able to finish everything outlined in the project description. However, my host was pleased with my progress and explained to me that it is difficult to put time constraints on research projects.
To say I learned a lot this summer would be an understatement! It was a great opportunity to experience what life might be like as a graduate student and confirm my interest in seismology. My host talked to me about graduate schools and gave me great advice about choosing a program that suits me. I will definitely be applying to graduate school programs in seismology =) I'm looking forward to seeing everyone at AGU!
Sampling Rate
August 9th, 2010
Included below is an attempt at digitizing a copied seismogram at different sampling rates.
Conversions, Fortran, and Residual
August 5th, 2010
With only 1 1/2 weeks left it's really crunch time. I still have to work with my advisor to create a code to convert from unformatted ASCII files to SAC files for one of our digitization programs. She uses Fortran and luckily I have used Fortran before as well but this is a different type of code like nothing I've ever written before - it simply reformats the ascii file into 2 columns - time versus amplitude. Once we get that code working I can run all my ascii files through the code and get the corresponding sac files. I then have to include these in my report and take time to analyze which software is best for which types of seismograms.
Another thing my advisor mentioned to me was converting all our sac files to ascii files (a much easier feat) to plot similar traces together (same trace but perhaps manual versus auto tracing) and see how they compare. When you see the digitized files plotted on top of one another it's a good way to see the discrepancies in the digital traces. In addition to plotting the files together you can also calculate the differences in your x y column data and plot that as well. I was able to write a Fortran code to calculate the differences in x and y values for 2 files and then plot the residual. I'm still working on analyzing the residual data but hopefully should have enough information about residual trace data to be able to include it in my report.
A thank you to Rob for helping me with the sac to ascii and ascii to sac conversions!
Digitized Images!!!
July 30th, 2010
Even though I still have to generate a few seismograms in my last digitization program, I've started writing my report for my advisor. My rough draft is 30 pages! Yes, it is a lot of pictures but it's also a lot of very detailed information about what I've done this summer incase future students are asked to continue my work. The outline of the report is as follows:
- Importance of Digitization
- Harvard Station Information
- Harvard Seismogram Descriptions
- Cleaning
-Scanning/copying/imaging
-Image Preprocessing
- Important Parameters for Digitization Software
- Software #1 Info/Analysis/Pictures
- Software #2 Info/Analysis/Pictures
- Software #3 Info/Analysis/Pictures
- Dealing with Tick Marks
- Long Time Series Digitization
- Argument for Best Digitization Program
- Using Current Data
- Fortran Codes
Phew! That's a lot! I'm trying to include everything and it helps that I have a binder full of notes from the entire summer to reference. I've also included a few different images below of different scanning and copying resolutions.
1) 200dpi, 400dpi, and 600dpi resolution copies
2) 200dpi, 400dpi, 600dpi, and 800dpi resolution scans
3) Scanned/Copied versus Digitized Images
Typical Long Period Trace Typical Short Period Trace
And many more similar images!!!!
Digitization Software Summary
July 27th, 2010
Well it's been an interesting summer that's for sure. I've got about 2 1/2 weeks left of my internship so I'm beginning to compile all my results into some semblance of a paper. Overall I've tested 3 different digitization software each using different types of seismograms (long period vs short period) at different scanning/copying resolutions. I've generated some digital seismograms using each program for 5 seismic waveform samples - extreme long period, extreme short period, typical long period, typical short period, and noise waveforms at 4 different resolutions - 200dpi, 400dpi, 600dpi, and 800dpi. I've investigated the auto trace vs manual traceability in each program as well as exploring the sampling rate allowed by each. There are definite distinctions amongst the programs and it really comes down to what is desired in the output seismogram that can be the deciding factor in your choice of digitization software.
Before/After Cleaning Seismogram Pics
July 22nd, 2010
Just for fun I've posted a before and after cleaning shot of the back of a seismogram.
Before cleaning After cleaning
I have a bunch more like this =)
Optimism
July 22nd, 2010
Well I recently reviewed the summer goals my advisor had originally given me and got a little concerned that I would not have enough time to complete everything I set out to do. I talked to her about this and she understood that her project proposal was very ambitious and that the exploration of digitization programs would be a monster on it's own. When I approached my advisor about pressing on past the digitization and doing some single station analysis she explained to me that her priority for the project is the digitization of old seismograms. Single station analysis is easier in a sense that we know mathematically how to go about it. But with the digitization, you need to explore and investigate different methods, note the pros and cons of each, be aware of what is best for digitization, etc. Hopefully by end of the summer I will have a good understanding of the pros and cons of the 3 different programs I've experimented with and be able to write a brief article about notable parameters during digitization such as image resolution, sampling rate, etc.
On a different note, with the program I'm investigating now a lot of image preprocessing has to be done. I have to filter them (the scans are really spotty), rotate them, convert them to .xcf (GIMP format) and crop them (the image sizes are too big) before they are ready to be imported into the program for digitizing. This would take a long time to do for each individual image so I wrote a bash script to automate the above actions. I was very excited about my script because I've never written in bash before so getting an executable bash script is an accomplishment in itself.
Lastly, since I only have about 3 weeks left my advisor asked me to prepare a presentation for August 11th before I leave recapping my summer project. This will be presented to the seismology/geomechanics group at Harvard. I'm really excited about that!
21st Birthday and Boredom
July 16th, 2010
Luckily, I was able to install onto my machine the digitization program I found. It doesn't run well on Mac OS though so I have to use Windows Virtual Machine (Parallels) to run it. Also, the program takes 1000 years to load the seismogram images before I can start editing/digitizing them! When I say 1000 years I really mean 30 minutes. But that's still a ridiculous amount of time to wait for each image. Unfortunately, there is nothing more I can do than to wait for them to load. It is very b.o.r.i.n.g. Once they're loaded I'm going to be checking the possible sampling rates for different resolution images. Thus far it appears to have a better sampling rate than the previous program I was using - which was my main reason for ditching that program.
On a brighter side, I recently had my 21st birthday! For my birthday, my professor made me cupcakes and I made a presentation to the seismology/geomechanics group about the L'Aquila '09 earthquake indictment controversy. It sparked a very interesting conversation about earthquake prediction politics. It looks like for now Seth Stein was right about not being able to effectively predict earthquakes.
Organization
July 12th, 2010
Fortunately I found another digitization program to try out. The installation has been a bit laborious but hopefully it will be up and running tomorrow. In the meantime, I've been working on organizing the seismograms by storing them in better containers (plastic versus wood) and ridding them of rat excrements. I've posted a picture below of the finished result. To transfer over all these seismograms into their new boxes and relabel all the boxes took a lot longer than one might think. It was a whole days work.
Despite the smiling Megan in the photo, smiling was the last thing I was about to do after today.
Program Failure
July 7th, 2010
Well it seems that SeisDig might not be all I'd hoped for. The sampling rate problem that I mentioned in my previous post is turning out to be a real road block. It's only allowing for the digitized seismograms to have 1 sample/second and a bunch of the seismograms I want to digitize need a much larger sampling rate to fully capture the trace. Unless we only use low frequency seismograms for my project (highly unlikely) it looks like it's time to scrap SeisDig. So I need to continue searching for a program to use to digitize these old seismograms. Unfortunately SeisDig was the only program I found when I first began the internship at the end of May. So unless someone has created a seismogram digitization program since then, I really don't know how to solve this problem. This is very frustrating - especially since the digitization is a small part of my ultimate goal of the internship and was not expected to take this long. But it's difficult to digitize seismograms when a good digitization program does not exist. Back to the drawing board.
Digitization Underway
June 23rd, 2010
Well it looks like the ultimate goal for the summer is in sight. I got the digitization program to work with one of the old, cleaned, scanned in Harvard seismograms! This sounds like a small feat but truly it is a success. The digitization program is really neat too. It traces the scans fairly well with some minor/major occasional corrections. AND.... it saves the digitized seismograms as .SAC files! The only thing I'm having trouble with now is tweaking the sampling rate to see what would work best as well as getting SAC to break up each digitized seismogram into frames and not squishing all 8500 seconds of trace into one frame ... that just makes it look like a stripped mess. But once that's fixed I'm well on my way to getting a bunch digitized, followed by an attempt to analyze them.
Old Seismogram Pictures
June 23rd, 2010
Seismograms
.jpg)
Typical Paper
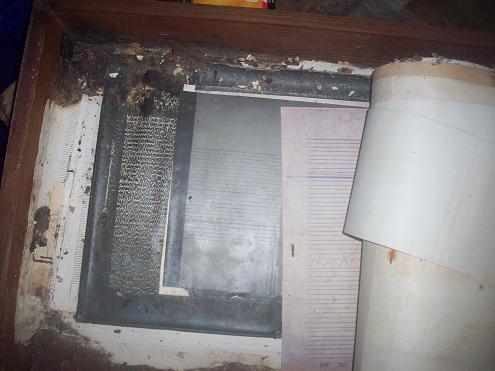
Typical Photographic Paper
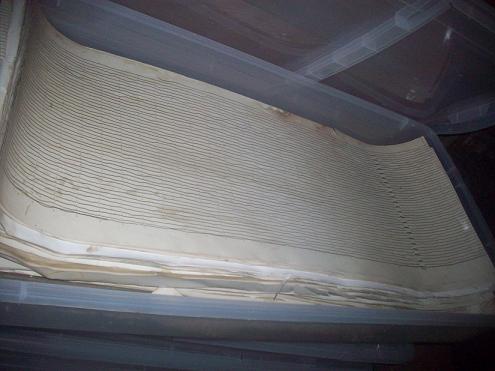
Damaged Paper (with rats nest!)
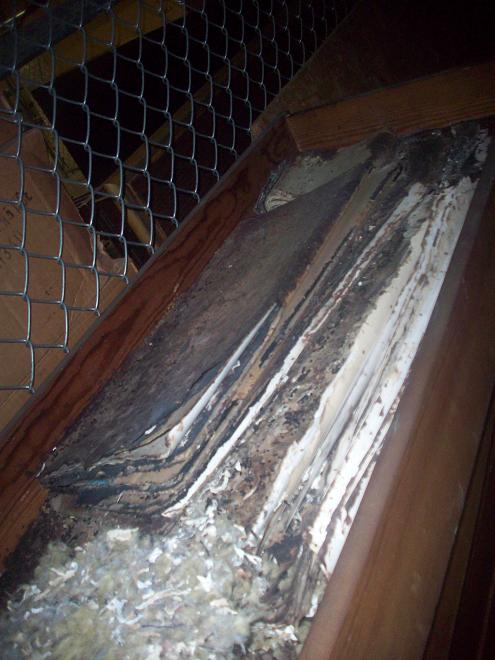
Damaged Photographic
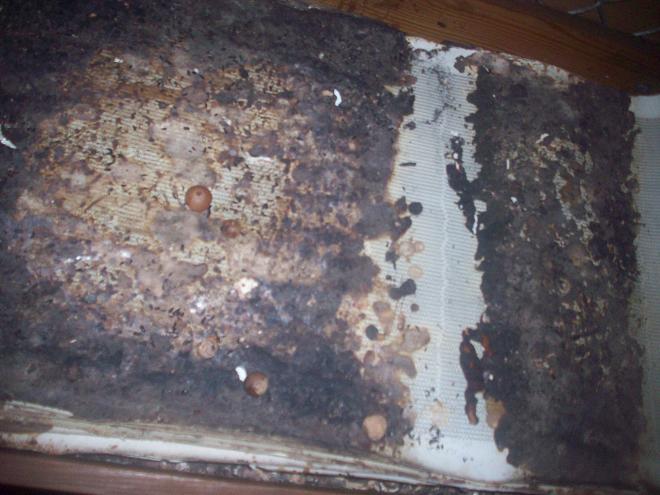
Update Week 4
June 23rd, 2010
This week was fairly productive.
We received the shipment of 50 new boxes to move the old seismograms into. I will most likely take a day to just go over to the seismogram storage area and sort through and label all the old seismograms since many of them right now are mislabeled.
I ran SeisDig on Matlab2007a on a PC and it worked really well. Now the problem is just getting Matlab2007a onto the Mac I'm using for research. I have the Matlab2010 version on the Mac now and it's been very difficult to get the 2007a version but hopefully that will be solved in the next few business days. But ultimately SeisDig looks like a promising program with which to digitize the seismograms.
I also picked out a bunch of seismograms from the 1938 box. The events that I chose are mostly teleseismic events because these show up as longer period waves on the seismic traces and should be fairly easy to digitize. I did choose out a few local events which show up as higher frequency and shorter period waves. These will most likely be more difficult to digitize but I will definitely try it out. Each event consists of about 6 long seismic trace papers. There are short period recordings and long period recordings for each of the E, N and Z components.
I cleaned all the 1938 seismograms that I chose. The cleaning process is pretty straightforward and is a simple dry surface cleaning.
After I cleaned all the seismograms I scanned them into the computer. As mentioned in my previous blog, we were having issues with the mylar sleeves enclosing the seismograms. This problem was solved by using a different type of mylar sleeve. So currently the 1938 seismograms are scanned into the computer and we're just waiting on getting Matlab2007a onto the Mac to get digitization started.
On a different note, Harvard has weekly meetings for the seismology/geomechanics groups within the school. At these meetings grad students talk about important recently published papers or about their own research. At our last meeting my teacher asked me if I could do a presentation for one of these meetings about the L'Aquila earthquake in Italy and the prosecution case that is underway. She thinks it will be good presenting practice for me and I'm actually really excited about it!
I think that's all for now.
~Megan
* I want to post pictures of the old Harvard station seismograms but I can't figure out how to do it =( When I use the "image" icon above and go to the "upload" tab and choose a picture it says something like the image URL is missing? Does anyone know what might be the problem?
Update Week 3
June 13th, 2010
For this past week my advisor has been away at the IRIS orientation but she gave me plenty to do before she left. I took a trip over to the Harvard storage area to inventory all the seismograms from the HRV station. There are 43 boxes and they're all overflowing with seismograms!! We're ordering more plastic boxes to separate the seismograms a little so the boxes will be less likely to break (as some have been). I've also determined that the HRV station used photographic paper in it's recordings until August 1953 when they switched to paper seismograms, which have not held up as well over time. After the inventorying I tried scanning in a cleaned seismogram enclosed in the mylar sleeve to our scanner but when I fed the seismogram to the scanner it did not take well to the mylar enclosure so we will have to deal with this problem. We do not want to scan them in without the mylar enclosures due to sanitary conditions and/or possibly damaging the papers.
In addition, I'm still searching for the best software to use to digitize the seismograms once they are scanned in. We have two options: SeisDig (created at Scripps and used specifically for seismograms but only runs on MatLab2007) and NeuraLog (a program used for digitizing different well parameter graphs).
On a different note, I've finally gotten through enough data to have about 90 seismograms for our Harvard reference database. From these seismograms I've made a couple different graphs. I've picked their S-P times and graphed them against distance to see how well my picks are and I've also graphed them at varying depths to show the time dependence on depth. I've also been going through the current seismograms to see if there is a significant difference in the arrival time windows of the love waves and raleigh waves at different distances.
That's all for now. Got a lot going on!
~Megan
Project Goal
June 4th, 2010
Goal of My Project:
There is a limited amount of seismic data from the early 1900s and fortunately, the Harvard station has been continuously recording data for the past 80 years.Over the summer I will be cleaning and digitizing old seismograms from the Harvard seismic station dating back to the 1930s. Because there is not much information about these past earthquakes, it will be difficult to pinpoint their exact depth and location because you need three seismographs to determine this data. To help with this problem, I will be creating a database of current earthquakes recorded by the Harvard station to see if there is anything characteristic of depth or location for certain teleseismic traces recorded by the station. In addition to learning more about single station analysis, the digitization of these seismograms will add to the current database making more information available to the public for seismic analysis.
First Post
June 1st, 2010
Hey Everyone,
This is my test post. For my current internship update: I've already met with my host professor Dr. Miaki Ishii at Harvard and I have started going through some data that has been recently (within the past 20 years) recorded at the Harvard station for analysis and comparison with the old Harvard seismograms from the 1930s. Even though I have done seismology research previously, I'm definitely been learning a lot with Dr. Ishii. So far so good =)
~ Megan


