Brady Flinchum
Brady Flinchum is a student at University of Nevada, Reno currently completing his research at Miami University under Michael Brudzinski.
As oceanic plates subducts down into the mantle at convergent plate boundaries, friction on the interface with the overriding plate causes a stick-slip behavior. The overriding plate is pulled down by the subducting plate in areas of strong coupling, accumulating strain on the megathrust fault until slip occurs and the overriding plate pops back up. This process generates major earthquakes such as the 2004 tsunami-generating Sumatra-Andaman event. Recent observations have also revealed slow slip episodes on the deeper plate interface with the motion indicating the release of accumulated strain, but these episodes typically last much longer than an earthquake. Corresponding seismic tremor composed of relatively small, monotonic signals also appear to occur near the deeper plate interface. Together the correlated strain and seismic observations characterize episodic tremor and slip (ETS) events, which recur with regular intervals that range from months to years. The processes that govern ETS and the potential relationships to major earthquakes remain unknown. Nevertheless, these events have been proposed to have significant impact on the likelihood of megathrust earthquakes since they appear to occur over adjacent depth ranges along the same plate interface. This project seeks to examine whether there are observable characteristics of the plate interface that could influence the frictional behavior and hence what type of seismic activity occurs.
First Blog of the Summer!
August 24th, 2011
So the week of orientation is almost over, I have to catch a shuttle at 5:30 AM tomorrow. The week has been an amazing experience. New Mexico Tech is a beautiful school and although small they own their own golf course! The weather is nice and warm especially compared to Reno where it was starting to snow when I boarded my plane. I met the other interns from all across the country and they have all been really cool. I have learned that even in the US the cultures on the East and West coast are completely different. I will miss this week and talking to everyone and am looking forward to the blog posts to see how everyone is doing on their research. We hiked up to almost 11,000 feet; the view was amazing:


My favorite part was having all of these professors with clear schedules that I could ask questions to. I have learned a lot and got some awesome scripts for GMT and MATLAB and I feel pretty prepared going into this coming week. I am looking forward to starting my research on fault tremors in Ohio. I am still a little unsure about exactly what I will be doing for the summer but I do have a few goals:- I want to make some new friends and explore Ohio.
- I want to make a good first impression with the knowledge base I have acquired over the past couple of years and apply that to my host’s research project.
- I want to have an amazing poster to present at the AGU meeting in December. I mean I want it to catch a few professors from others schools so I can talk to them about their current research.
- I want to stay in contact with some of the interns and the professors that I met this week at orientation.
- My long-term goal is to get a new way of thinking about research and pick a graduate school based on my experience!
Till next week!
Reflection on Summer
August 24th, 2011
So I am finally back in Reno after an amazing cross-country journey with my girlfriend. Now that I am back I am at full sprint to keep up with everything. There was emails to be sent, a job interview, papers to be signed and the hunt for a new apartment all before Monday when school starts. Let me first begin by reflecting on the summer of research. The research that I was doing was amazing, it was new stuff and we found some interesting correlations that I am saving for my poster at AGU. As an overall experience it ranks up there in the top things that I have done, I learned so much. I learned skills that I will continue to grow when I go to graduate school such as:
• Reading and Understanding scientific papers
o This was really difficult for me at first but as time went on and I read and re-read them I started to understand how they are formatted. One thing that I could still improve on is ranking the papers. Mike said that I should be able to rank the papers and why certain papers are better than others.
• Organizing massive amounts of data
o I knew shortly after I started that this was going to be a challenge. It really took some innovated thinking to keep all the data organized and noted. I succeeded with this project by keeping a spreadsheet with personal notes and taking screenshots constantly. This allowed me to get quick access to data I wanted to glance back at and then I could open the data in SAC for further inspections.
• C-shell scripting
o I did so much scripting this summer. Although C-shell may not be the most efficient language it can be extremely useful. I was able to take my though process and implement it into code. This is a useful skill to have and to maintain especially because it meshes so well with GMT.
• Making maps and graphs with GMT
o At the beginning of summer I had very basic knowledge of this program. As the summer continued I got really good with it. I found that it makes graphs as well as maps and they all look good. This is a very useful skill to have because no that I recognize the format of GMT maps I see them all over all kinds of posters and in papers!
• Managing my time to get everything done in a timely manner
o This was one of my biggest concerns before I left for Oxford because my life was always scheduled. When I go to work I have to clock in and out and I have to be there on time. This summer I had so much freedom about when and where to work. I really enjoyed this freedom and I did figure out how to manage it. I found that if I go to the office my focus seems to be the best, but late at night before I go to bed I tend to get a lot of work done as well. I also confirmed that I am NOT a morning person.
Thos were the main skills that I had honed in on over the summer. I also learned a lot of information about my specific topic, triggered tremor. There are still many unanswered questions. This I found was something that came along with research. As I though I found a correlation there came more questions. It seemed like I would never reach the answer. I could have easily spent a year on this project. I left with many unanswered questions and possible solutions that would just take to much time to try to isolate. I will have a great poster at AGU though and will maintain my contact with Mike to finish it. I will be attending the Rocky Mountain Rendezvous to present my poster and interview with Noble Energy. I really did enjoy the summer and learned so much. I will keep in touch with everybody and I am looking forward to seeing everyone at AGU.
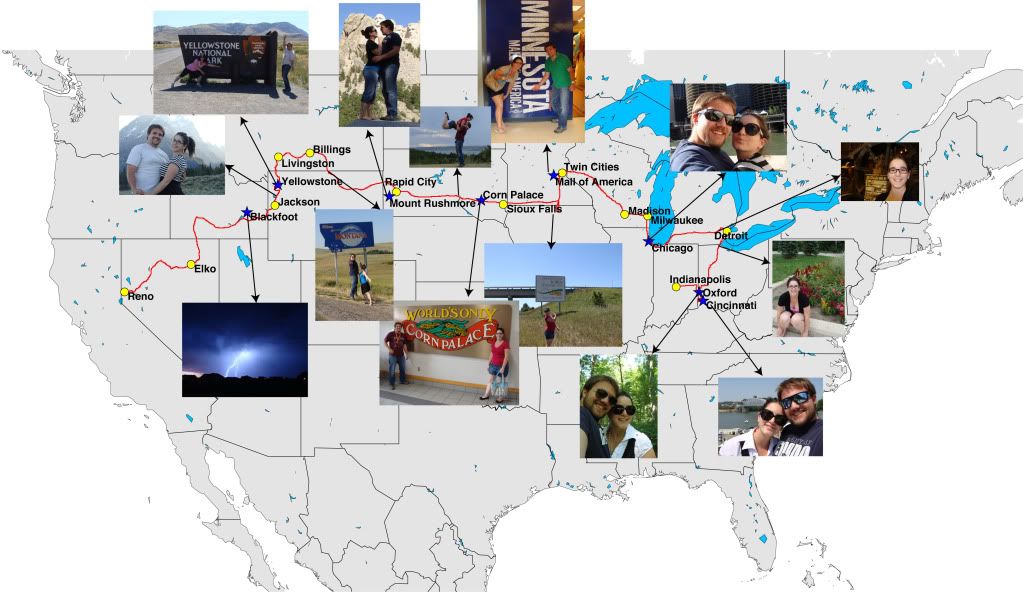
Here is a quick GMT map I did to show my route back with a few pictures a long the way (illustrator):
Thanks for this opportunity I will use the many skill to go to a graduate school and possible get my PhD or go into industry, that is something that I have not decided yet.
Peace out till AGU
Brady Flinchum
One Week Left
August 8th, 2011
So last week was a crazy week with the abstract being do. All of the data I had gone through all sumer had to be organized as well as coming up with some conclusions. After discussing with mike the day it was due we found that the code that I had written could still use a little work. We did come to some conclusions and I really do like my abstract. It reads really well and I think it will make for a very cool poster. Anyways I was super glad to get it submitted and get that off my chest. I have a lot of stuff to do before I depart. This project won't be over even after I leave. Mike will want to go through all the stuff that I have done. This leads me to the first thing that need to be done: a file directory. In order for Mike to understand all my files and organization I have decided to leave him a README file of all my files. This will help him navigate my mess of folders and also has a brief description of all the c-shell scripts I have written. The next thing to do is to make another figure for my poster. This figure is something mike wants to look at as it compares the amplitude and directivity of arriving surface waves with events that triggered tremor and ones that did not. Before I leave on Saturday I would like to have my poster done... or at least close to done because when I get back to Reno the busy life begins again. Another goal is to kick butt on my GRE on Friday. I have been reading the study book and it doesn't seem to bad....except the vocabulary section. I mean Seriously.... I haven't seen those words in any of my textbooks!
On a side note I went golfing yesterday and have been working on growing a beard. It is coming along quite nicely:

2 Weeks Left
July 31st, 2011
I wasn't as good as I would have liked to be on keeping up on my blogs. It seems like I post about every two weeks instead of every week. Anyways I have been busy all week writing scripts to look at my waveforms in different ways. Mike was on vacation this week so I was left to my thought. He will be back in tomorrow so I can discuss with him. I tried to compare the angles at which the surface waves arrive in Alaska and see if there was a specific angle that generated the tremor. I did a fancy GMT map to plot the relationships and I think I may have found something. I want to talk it over with mike first to see if I have enough evidence to claim that though. Anyways I am working on my abstract hope to have it submitted at least a day early. Hopefully Mike will help me get it sounding really good. I have already started putting together figures for my poster. I know it's not due till December but I would like to get most of it done while I have time, resources and all the information fresh in my brain. I watched a lot of X-games this week and plan on being in the office early tomorrow to talk with mike. Hope everyone else’s projects are going well!
Tinkering on…
July 21st, 2011
So once again it has been a pretty productive week. Mostly I have been working on an algorithm to automate location of the tremor I found visually. I have put a lot of time into these scripts and found out that my advisor does not comment his code! This means a lot of my time is spent deciphering through what the code does. I think the most time consuming things is that it always calls specific files, since Mike was the one who formatted it he knows how the columns are organized. I have to pull that file to see how it's formatted to see what is being pulled out of the file. Anyways enough about the deciphering and on to what I have accomplished.
So my idea was to iterate over the section of surface waves where my tremor would occur. I have SAC try to cross correlate the envelope function that has been filtered within the 6-10Hz range. This search uses a base station as reference and searches 400s on each side of the interval for peaks similar to the reference station. I wanted to iterate so that I could get a lot of locations that should be in the same region (this turned out to be lot of work), so I could get good average. So that as the basic idea, here is the first attempt of the code trying to locate one event:
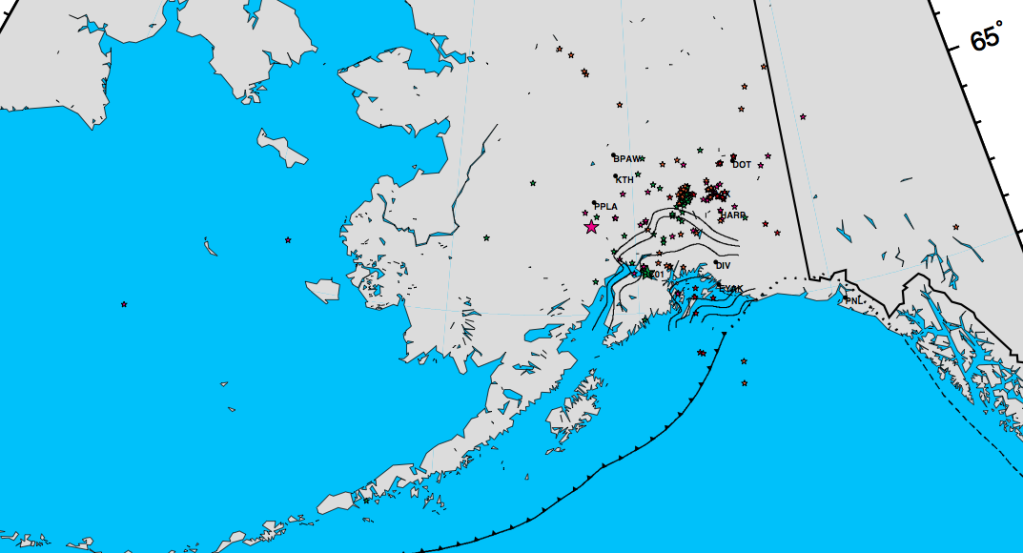
I say again, this was supposed to be ONE event. This was not the greatest first attempt. I mean the good news is there is clustering in two different locations, which means there is some promise. I tried a few different things with this code. I tried changing the search from 400s to 100s and everything in between. I also tried changing the iteration value from 25s to 10s all the way down to 5s. None of these adjustments really made a difference, everything still seemed pretty scattered. So I went back to the drawing board. I still felt like I had the right idea of iterating over the tremor event so I stayed with it. I took a closer look and I had lots of locations that were using only 2 stations! I also realized that the cross-correlation value, the ratio of how similar the waves are, was only .5. So for the next attempt I ended up struggling through some code to make sure that I had a correlation value of at least .65 on 4 stations. This new code zoned in the locations! I still had a few locations outside the area of where tremor can occur. So i took a region and decided to throw out all the values outside the box, as they can't actually be locations and then averaged all the points and I have the final location. Here is the new map:
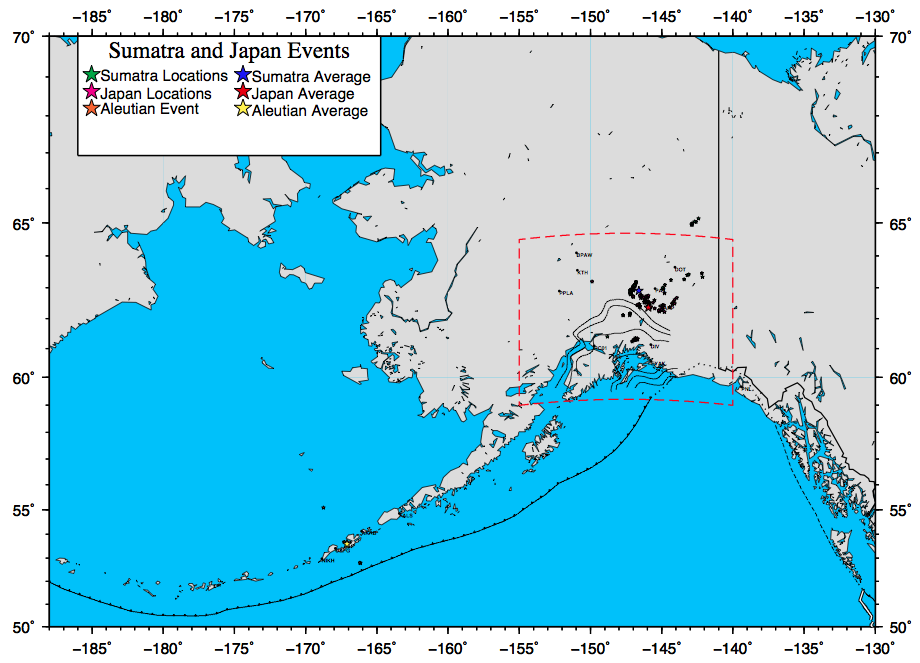
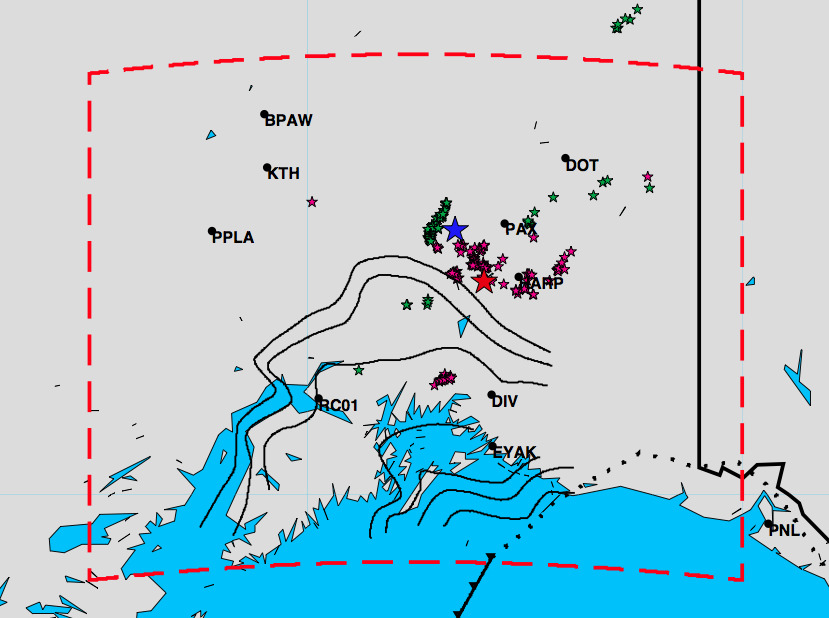
The red box is where I decided (and talked with Mike) that tremor would not occur out of the box. So the green cluster up top would be thrown out when I average the points. This map shows two separate events. The Green stars are the Sumatra locations, the Pink stars are the Japan locations. I need to change the color of the average stars but that easy to fix, these are just for me to visualize everything.
Anyways that's what I have been doing here for the week. Lots of coding and I have had a few frustrating days. AWK kicked my butt for a while but I think I am finally starting to get the hang of it. Let me tell you doing math in a c-shell script is not easy. And here in Ohio along with the rest of the Eastern US has been really HOT. It feels like you’re in a steam cooker, literally. The humidity has been up around 70-80% and it has been in the upper 90's. We did have a really cool thunderstorm yesterday though! Anyways in light of the heat bubble of the Midwest and East coast:

IT FEELS LIKE 107!
Keep it cool till next week!
Making Progress…
July 12th, 2011
This week has been a very productive week for me here in Oxford. At the beginning of the week Mike gave me a couple of scripts for a new way to look at the data. I say a new way because I have already gone through all the big events (Mw>7.9) over the past 10 years or so and visually looked for triggered tremor on various stations in Alaska. I used the code I had written to filter through the data and plot it in a spectrogram. This new code does a lot more! I have to work it remotely on one of the servers here at Miami U, which means lots of terminal work, and a lot of linux/unix commands and shell scripting, which lucky for me I find actually rather fun. This being the case I made my new work area a little better by buying a cable and making dual monitors:
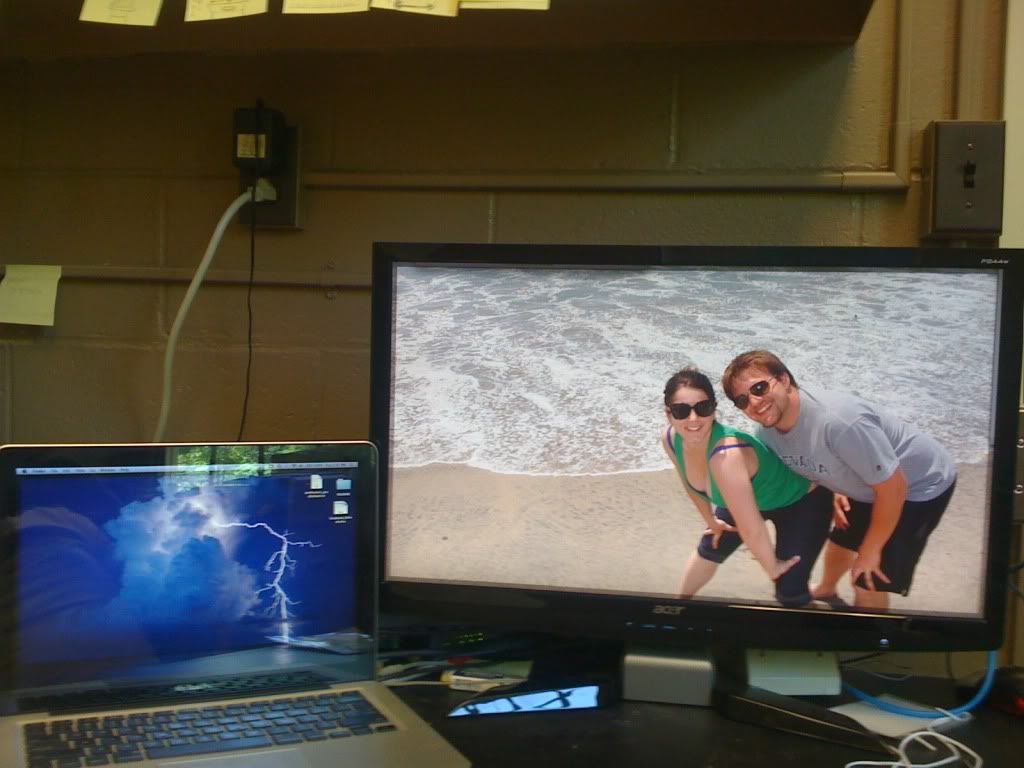
Thats my girlfriend and I in San Diego right before I left
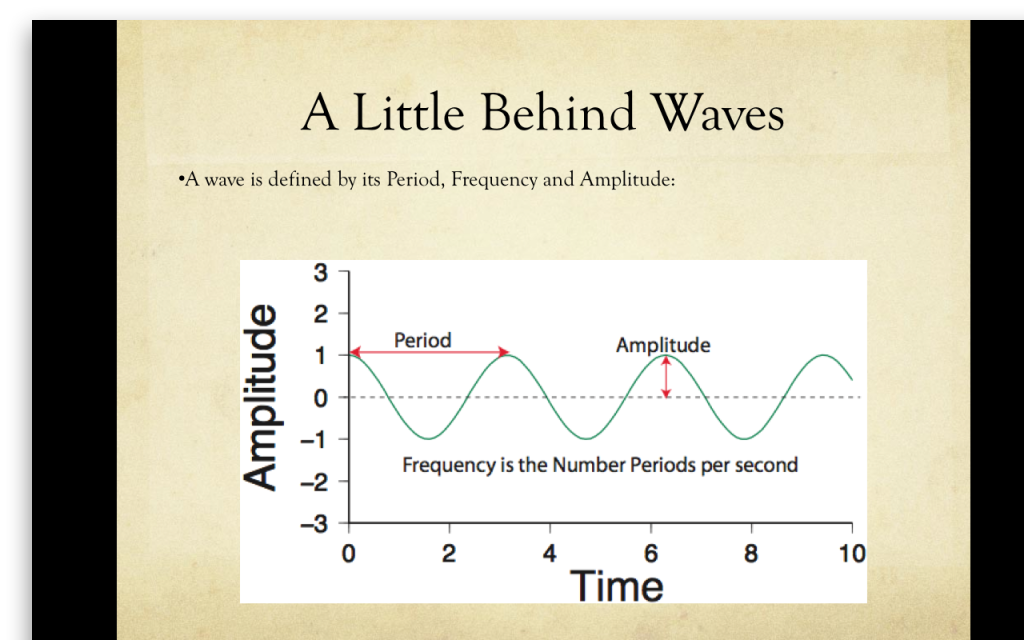
The new code takes the .seed file that I download from IRIS and extracts it. This extraction is a lot more complex that what I was doing before. It looks through the header files and only pulls out an hour of data, since I am only looking at when the surface waves arrive, and then it does a deconvolution. This deconvolution is based off of information in the header file, and it is necessary to filter out the response of the station to the ground movement to make sure I am only looking at earth movement not station movement. After it extracts and does the deconvolution it also creates a seismic envelope, which in a nutshell takes the absolute value of the seismogram, making it all positive make the new seismogram look like an envelope instead of a seismogram. The benefit of this is that tremor shows up as kind of a elongated bump, a raise in overall amplitude and a gradual fall of amplitude if that makes sense. After I extract all of the data and deconvolute it, I run another code, this one is a little over my head still (and still needs work), but this code is the important code. The code essentially gets SAC to compare waveforms. It compares all the stations for similarities and saves them as a ratio file. The ratio file is an ASCII file that plots the values of two different frequency bands: 6-10Hz (tremor!), greater than 6Hz (earthquake band). It also plots the values of the original envelope function and also the values of the tremor band vs the earthquake band. This of course is all made possible by using the fancy command/language (not sure which) AWK. This comparison is the part of the program that still needs work. I am hoping to improve on it before the summer is out. The main problem It doesn't correlate the stations properly. This more than likely has to do with the fact that I am in Alaska and don’t have a dense array of seismometers and because the subduction zone in the Aleutians is so active there are always little earthquakes going off. I have also plotted the stations on Google Earth and found that there are a few that are right of main roads and once that is less than a half km away from a train station! Unfortunately in order to fix this problem need more understanding in how SAC correlates the waveforms. It correlates stations that are 6-7 degrees apart, that’s like half of Alaska! In these columns of the correlated waveforms are the values of the envelopes. After these ratio files are made, of what the computer thinks tremor looks like I plot the bands using GMT. I plot the original envelope, the earthquake band, the tremor band and the ratio of the two. If it is tremor the ratio of the bands should be really high because that means there is more energy in the tremor band (6-10Hz) than the earthquake band (>6Hz). This new method is time consuming as it takes SAC a few hours to compare all the stations, but it does work pretty well. After I visually go through these plots of the ratios I try to correlate the stations using one more code. This code actually tries to locate the tremor. I need to talk to Mike about it alittle more but essentially to locate tremor you need to match peaks in the waveform itself as defined P-S waves are not there. This program I pick a time and SAC once again tries to cross correlate the selected stations and then spits out a location with errors. This is the part I talk briefly about on Thursday, but I still need some more understanding.

It's hard to see, but the different colors are supposed to be the same location. Each color was when I used the same station for reference but a slightly different time. I was playing around with the script that cross-correlates the data and as you can see by picking various times and different stations for reference I get dramatically different results.
Well that was what I did for work this week, as the title suggests it’s been an extremely productive week. On a tangent, I did get to go out with two people who are working for Earthscope and help them pick out a suitable location for a seismometer site for when the transportable array arrives in Ohio. We looked at three local sites, two of which were way to close to main roads as you could still hear traffic. The last site ended up being on some land owned by the university where they do Ecology research. It was a suitable spot as we found a field that was a away from trees (Hard to do in Ohio!) and that had decent satellite signal. I didn’t realize how much paperwork needed to be done in order to approve this site. It involved taking GPS reading (DUH) and lots of pictures; pictures from the site, Google Earth, Topography, and even photos on the road to get there so that when Earthscope goes to put in the seismometer they can find it. That was probably my fieldwork for the summer so I though I should mention it.
I have also been working on the project to explain my research to a non-scientific audience. This is actually a little more challenging than I though it would be. I of course did a powerpoint because I feel that pictures are absolutely necessary to explain what I have been doing. Also in the process I messed around with GMT more, finding out this program, despite the hard learning curve, is extremely powerful and awesome. I made all the figures in my PowerPoint using it and Rob Porrit was right, GMT plots do look nice :D.

On the fun side of things Martin and I kicked ass at volleyball the other night and we went the National USAF museum, which was awesome! My favorite plane by far was the SR-71. We also discovered that there is a lake about 7 miles north of here with all kinds of things to do. They have a beach, paintball, mountain biking, and boat rentals, putt putt golf, horse rentals and riding, and a golf course (rated 4.5stars by golf digest).
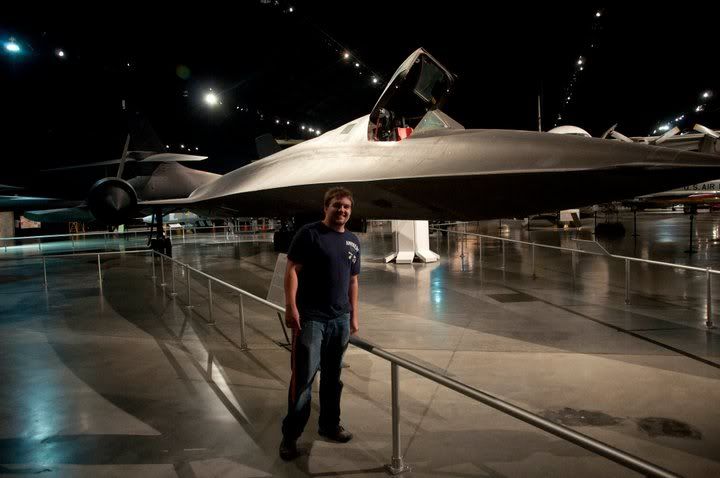
Just so you know it took 4 days to get from Reno to Oxford in a car. This plane cruises at 80,000+ feet at 2,000+mph. That means it could go from Reno to Oxford in a little under an hour! Thats the ride I want :D.
Anyways till next week!
I sense a tremor in the force…
June 28th, 2011
In light of having a Star Wars marathon last week that phrase really stuck out! I wish I had Darth Vader's ability to sense tremor, but since I don't I have find tremor using SAC and GMT. I was successful in writing a few scripts that make my life a whole lot easier. My daily routine during the week consists of me finding a decent sized earthquake, larger than magnitude 8.0 and downloading the information of of IRIS's Wilber site. As I am looking for triggered tremor in Alaska I select the Alaska Regional Network and if it's available the Alaska Volcanic Observatory stations. Depending on when the Earthquake occurs I have anywhere between 17-56 stations to work with. As I found out it is much easier to find tremor if you have more stations. I need to confirm it on more than one station, preferably three, but when I only have 17 stations that becomes very difficult and I have to throw out what looks like really good tremor because I can't confirm it on any other stations (this is really frustrating). The goal is to find triggered tremor by hand and soon I will start working on a code to hopefully automate the process. I found tremor by hand and I will be seeing if my code can find the same thing, it should be fun, I enjoy programming.
My attempt at organizing my data:
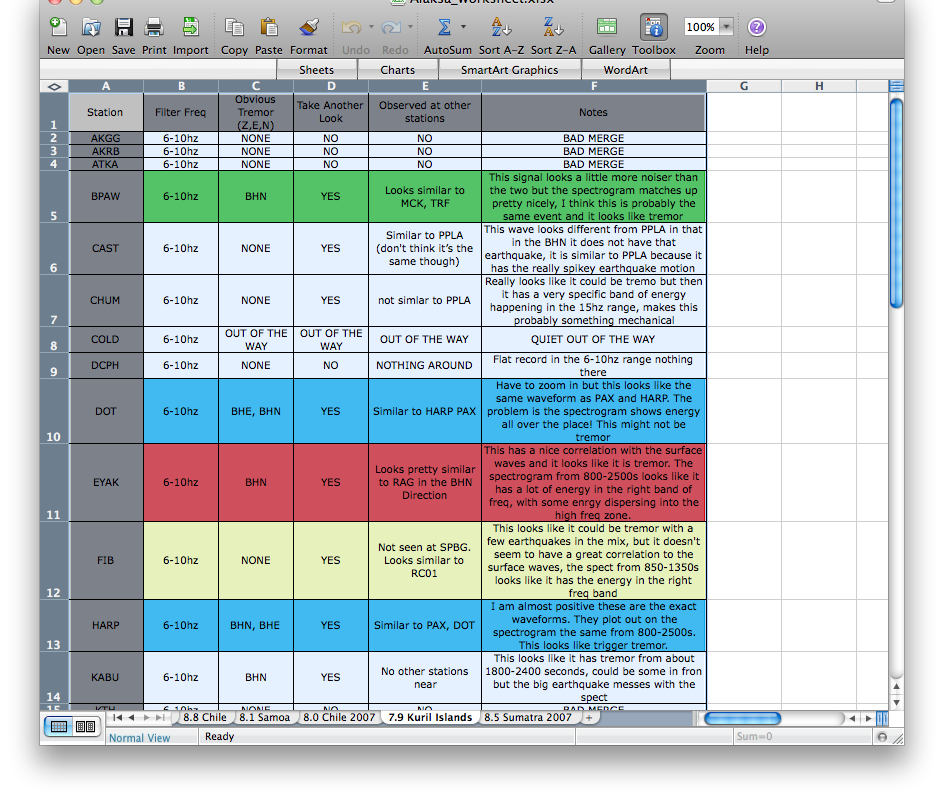
The hardest part of this whole process has been the challenge of trying to keep everything organized! I have worked through 7 big teleseismic events. I found the easiest was to use a spreadsheet and mark stations that had similar signal. If I do this I can go back and look at them in detail grouped together because if it's by itself I can't use it anyway. I have also been using screenshots like crazy! They seem to be the best way to allow me to go through and glance at the data because even though I wrote scripts and it only takes a few commands to filter and display my data it is still very time consuming. If I take screenshots I can quickly glance at what I think is tremor and what is not, if I am not sure I can pull up the data. I usually go through an earthquake group similar signals, then go back through the similar signals that might have tremor take screen shots and mark them so I can go back to them easily.
I USED THE FORCE TO FIND THIS TREMOR!
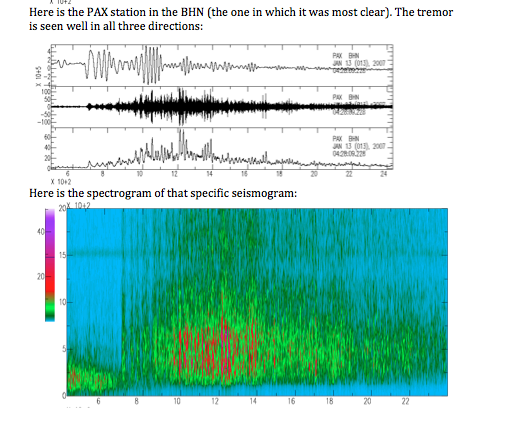
I have also been reading a statistics book, since I don't know anything about statistics and also studying for the GRE which I am going to try and take before I head back to Reno. Martin, Lizzie and I are thinking about going to a Reds game and possibly a shooting range in Kentucky! Oxford is pretty quiet but there are a lot of people in the apartment complex and Martin and I played volleyball with a lot of people last night for a couple hours. It was really fun.
Till Next Week!
3…2….1….Commence Research!
June 18th, 2011
So it was my full first week at Miami University this week. A lot of time was spent reading papers and familarizing myself with GMT and SAC (Seismic Analysis Code). The first part of the week this is all I did. But on thursday Mike made it into the office and gave me a brief overview of what I will be doing. In my own words, not in the description above, I am looking for triggered tremor. Tremor from my understanding is very low frequency earthquakes without defined S and P waves (this makes them hard to locate, especially in the vertical direction!). Tremors baisically look like noise and they are very low in amplitude. So this summer I will be filtering through seismograms of different earthquake events (I started with the most recent 9.0 in Japan) to look for this noise that is triggered by surface waves. From seismograms of triggered tremmor mike showed me it looks is like noise in synronization with the body waves. It is important to understand this "triggered" tremor because there is a lot of debate (due to the lack of constraints on location of tremor) if tremor is caused by friction between the surfaces of a fault zone or if it fluid flowing through the area. If I can locate enough "triggered" tremor it is a very strong support for the tremor being located on the surface of the plates supporting the frictional hypothisis because it is triggered by a stress change which means it was locked at the fault interface.
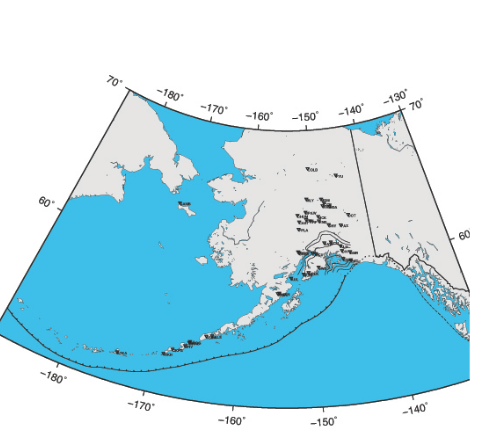
Have to post it cause I am getting pretty ok at GMT :D, here are the stations I am looking at with my data. (that is the subduction plate interface with the gradient of the estimated depth to the bottom of the plate near the center.
Today I did some laundry and had some food but have been working on locating all of my stations. I looked up the location of all the stations and then made a quick GMT map of the stations I will be looking at. I am still trying to work out how I am going to keep all this data organized because I have so many stations and not all of them will have tremor. I need to find a way to keep track of the stations I have looked at and the stations I haven't looked at. My idea right now is to keep a spreadsheet of all my stations and just keep my observations as notes. The other thing I did today (took me forever) was to create my own shell script that lets me control the filtering and then plots the filtered seismograms on the screen so that I can review them. This is a lot less tideous as I only have to type one command per station instead of about 20. I am going to take the day off tomorrow and get my classes back home figured out, but looking forward to using and abusing my code come monday.

This is what I will be looking at all summer. Those are two filtered wave forms from the same seismogram. That is close to tremor but I am pretty sure it isn't.
Anyways till next week!
Made it to Oxford!
June 14th, 2011
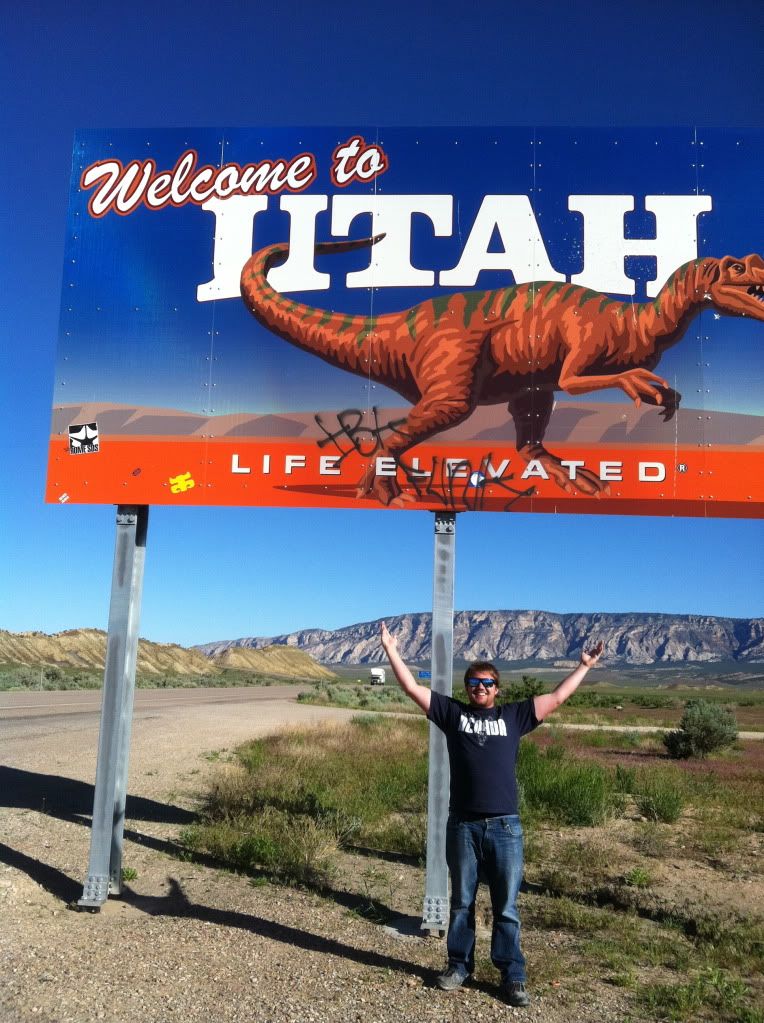
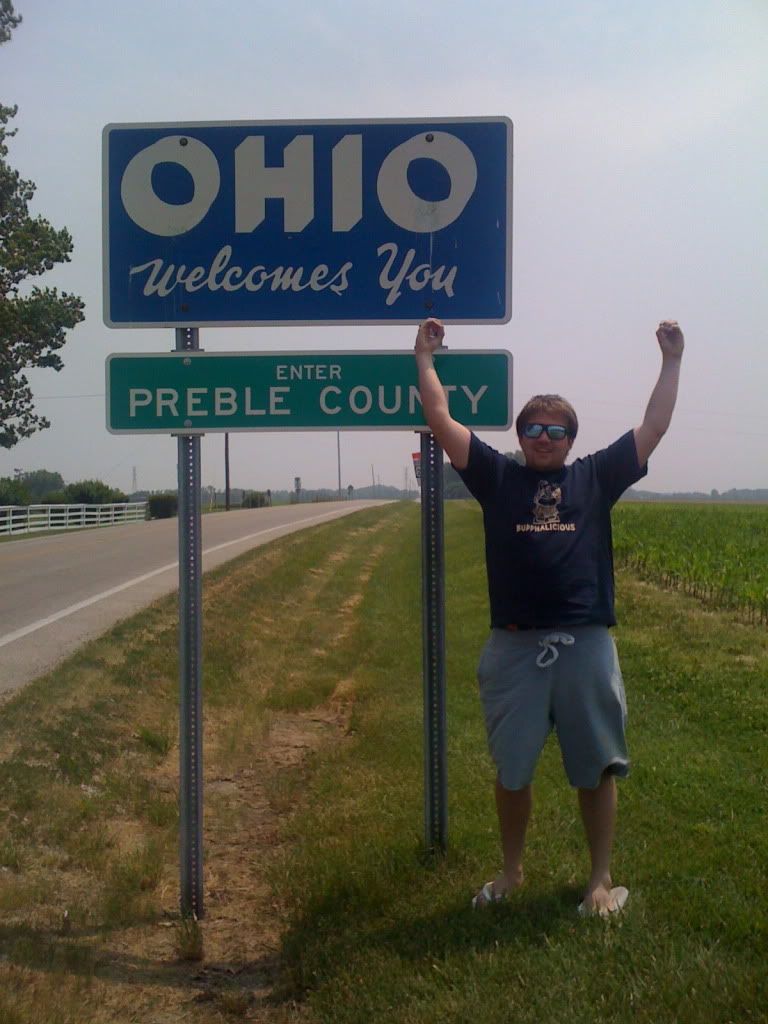
So I had elected to drive from Reno, NV to Oxford, OH and I am so glad I did. I had an awesome trip I have always wanted to drive across the country. In order to get here my mother and I drove through 8 states (including Ohio). I think my favorite state was Utah, it had the huge salt flats, I walked out a ways hoping to get lucky and find a nice chunk of Halite, but it didn't happen. When we came into Salt Lake there were really high mountains with snow on them and even though the snow melted you could see the HUGE ski resorts (heaven in the winter 😛). There was textbook anticlines and synclines and just amazing sedimentary cliffs in every direction, it was beautiful! Anyways I have lots of pictures, tried to get one at every state sign got a few not all, heres the one of Utah (notice the amazing cliffs in the background :D)
Anyways after 2200 miles I finally made it to Oxford, which is a really small town. The university is HUGE though, it makes up over half the town! I found my building, got a parking pass and for the past two days I have been in the office/lab doing computer tutorials getting familiar with SAC and GMT, as those will be the main programs I will be using to locate trigger tremor in Alaska. I have also been reading a lot of papers related to tremor. Dr. Brudzinski hasn't been in the office because he is on some kind of review panel in Cincinnati, but he will be back tomorrow and I am looking forward to getting started. I feel that I have read a lot of papers and understand the basics of tremor and I want to start finding it :D. I think finding triggered tremor going to be tricky because it is tremor (low frequency long duration earthquake) that is triggered from surface waves, which means there is probably going to be a lot of noise from the surface waves or aftershocks. Also Martin, a previous iris intern is looking for tremor in Alaska (not necessarily triggered) and his data is very noisy because the region constantly has small earthquakes all the time. This makes it a lot more difficult to find matching waveforms from the different seismograms to match and verify that the event is actually tremor. Hopefully next week I will have some new information.
Good Bye New Mexico!
June 4th, 2011
It was an awesome week I am sad that it is over. All the people I met were really cool and I am looking forward to going to my institution in Ohio to work on fault tremors. We went for our final dinner out at Lorenzo Canyon and man was it an adventure! The canyon itself was amazing. I have never seen anything like. There were slicks along the canyon walls with really steep cut out sandstone! On the way out we also saw a text book example of an angular unconformity. Here are some panoramas I took of the canyon throughout the day:

Just a random panorama from the top of the canyon.

One more view of the canyon facing west at sunset.

This is personally my favorite, another view of the canyon with the sun setting in the west behind us. Also you can almost see the giant anticline with the fold axis being on the right of the picture.

A text book example of an outcrop demonstrating angular unconformity.
I am really going to miss everyone I met. I hope everyone keeps blogs and that we keep in touch. Thanks to IRIS and Michael Hubenthal for always bringing snacks and to all the professors that cleared their schedules for question. I really did learn a lot and it was a blast.
My next post will be coming from doing actual research :D


