Neesha Schnepf
Neesha Schnepf is a student at Cornell Universtiy currently completing her research at UC Santa Cruz under Susan Schwartz.
Since 2007 seismological data collected from Costa Rica's Nicoya Peninsula has shown the existence of slow-slip events (SSE) and tremor. For a year and half, starting in 2000, data was collected on the peninsula and off-shore near the subduction zone of the Cocos plate and Caribbean Plate. This was before more modern techniques for tremor and SSE identification were developed.
I will assist in analyzing data from 2000-2001 to expand the known time-series of tremor and SSE events in Costa Rica's Nicoya Peninsula.
Slow-slip events differ from the news-headline earthquakes that people fear. SSE may release the same magnitude of energy as earthquakes, but they do so over a longer time period (several days, weeks, maybe longer) and they do so aseismically- they literally are slowly slipping along.
The relationship between SSEs and tremor is poorly understood. In this case, the term tremor does not refer to anything associated with volcanoes or underground aliens, but instead represents very small strange earthquakes (only noticeable through seismometers or other modern instruments). Unlike tremor, “normal” small earthquakes emit high frequencies, but for reasons not yet fully understood, tremor emits very low frequencies.
Expanding the scientific community's knowledge on SSE and tremor occurrence is vital for developing an understanding of the processes that control these events. A better understanding of these events may lead to a better understanding of earthquakes and other earth disasters that make the evening news.
Reflection
August 17th, 2011
Now that I have returned to Ithaca, I can take a moment to reflect on this summer. I loosely accomplished all the goals I had set forth at the start of summer-- I learned a lot about current research in seismology, how graduate school works, and more about conducting scientific research. I may never have caught a banana slug but I got plenty of close encounters so even that goal feels fulfilled.
I still have much to do from here-- at the minimum I need to prepare my poster for the AGU conference, as well as perhaps continue analyzing data and working with Susan. I hope to finish work affiliated with this summer to the best that I can and to give a solid poster session at AGU.
This summer introduced many new concepts and ideas to me that rather than spending too much time thinking of past goals, too many new ones are forming. I definitely feel inspired to continue in geophysics, and hopefully I will be able to pursue more seismology at Cornell. I changed most of classes for this year around to give myself a stronger background in physics/math so that next summer I can gain experience in other geophysical research fields to narrow down my interests for graduate school-- this summer solidified my interests in pursuing graduate school immediately after undergrad.
Hopefully as I continue taking courses and getting involved in research my experiences from this summer will help me deal with future research setbacks/bumps and help give me the courage to continue to be inquisitive in the class and outside.
.png)
Otherwise, I'd better get ready for the onslaught of classes!
Home from Santa Cruz
August 3rd, 2011
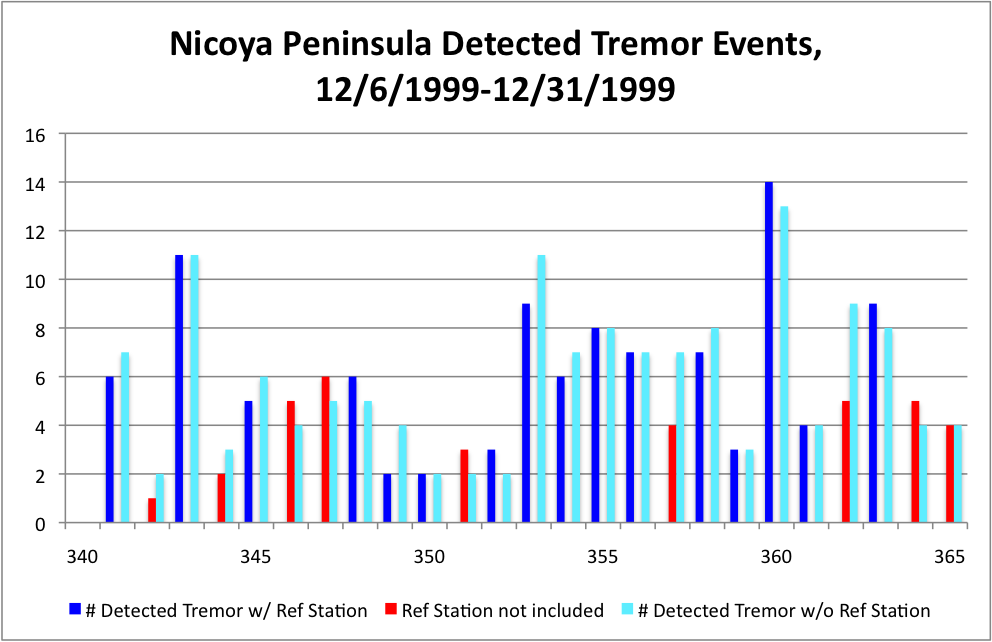
Today I submitted my abstract for the American Geophysical Union December meeting in San Francisco. I finished running a detection program on the land data stations from December 7 1999 to June 19 2001. As you can see below, tremor was identified almost every day, and some major events were noted.
.png)
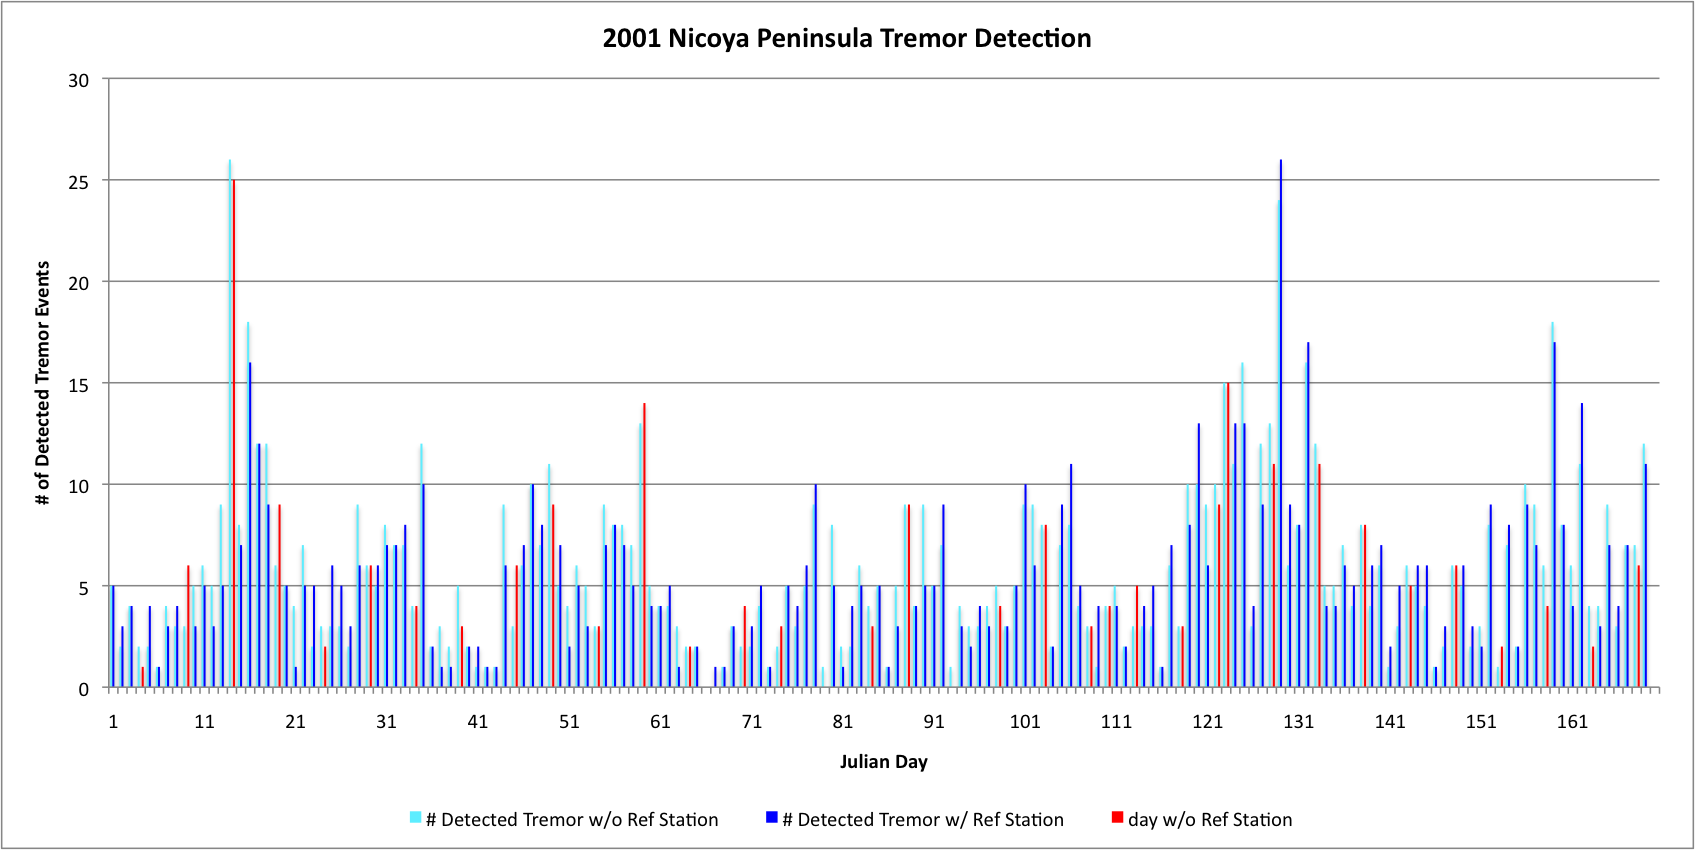
Two different detection runs were used. The light blue run is only the stations from Susan's network, while the dark blue run included an IRIS station (HDC) that was 200 km away as a reference. Tremor should not span 200 km-- so if any was detected matching the HDC station it would automatically get thrown out for being a regional earthquake.
Although my time at UCSC is done for this summer, I will still be helping go through the data and looking at the OBS data to prepare the poster for AGU. I have learned a lot from this summer and am excited to keep learning when I return to Cornell 😊
Week 6 Part 2
July 16th, 2011
Fig. 1.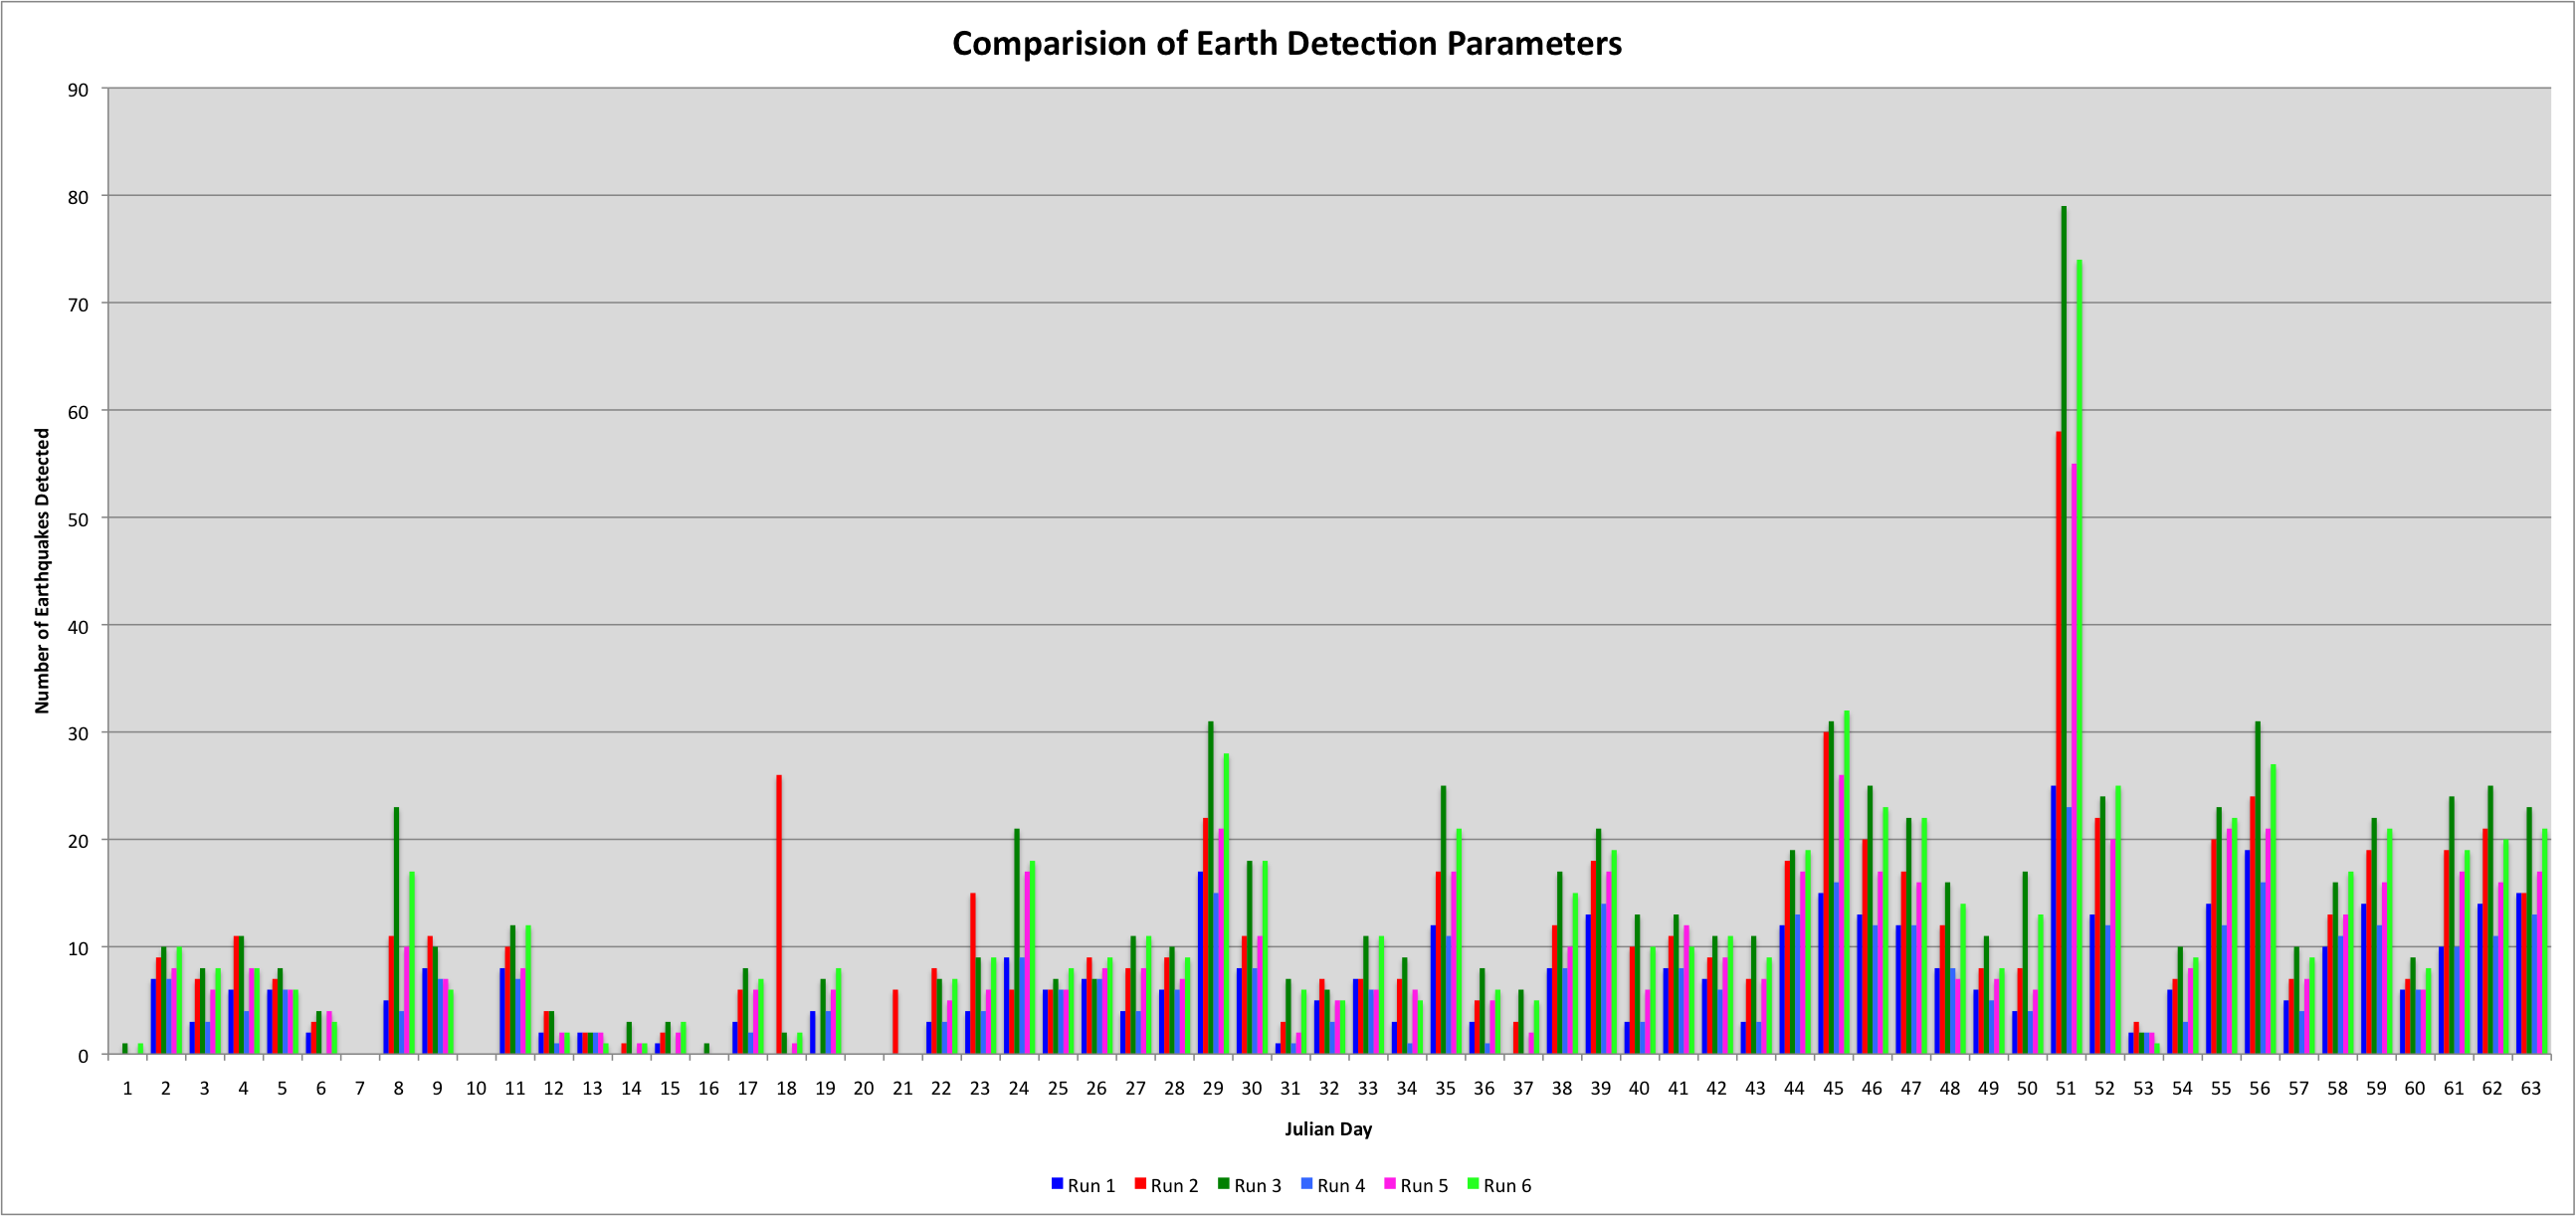
Fig. 2. .jpg)
Using the same program that detected tremor events for the first half of the year 2000 (Fig. 2) I altered it to instead detect earthquakes (Fig. 1).
I am still running variations of the program using different parameters because as you can see below, the size of the time window being analyzed, the correlation coefficient required, and the number of stations that must match all greatly alter the count of earthquakes detected.
Run 1
The minimum correlation required for an event to be considered an earthquake was raised from 0.6 to 0.8, and the mininum cross-correlation between stations raised to 12 (which means at least 5 stations must record the same event during the time window). The time window was 300s.
Run 4
The time window is again 300s and the minimum correlation is still 0.8, but the minimum cross-correlation has been raised to 15-- so at least 6 stations need to fully agree.
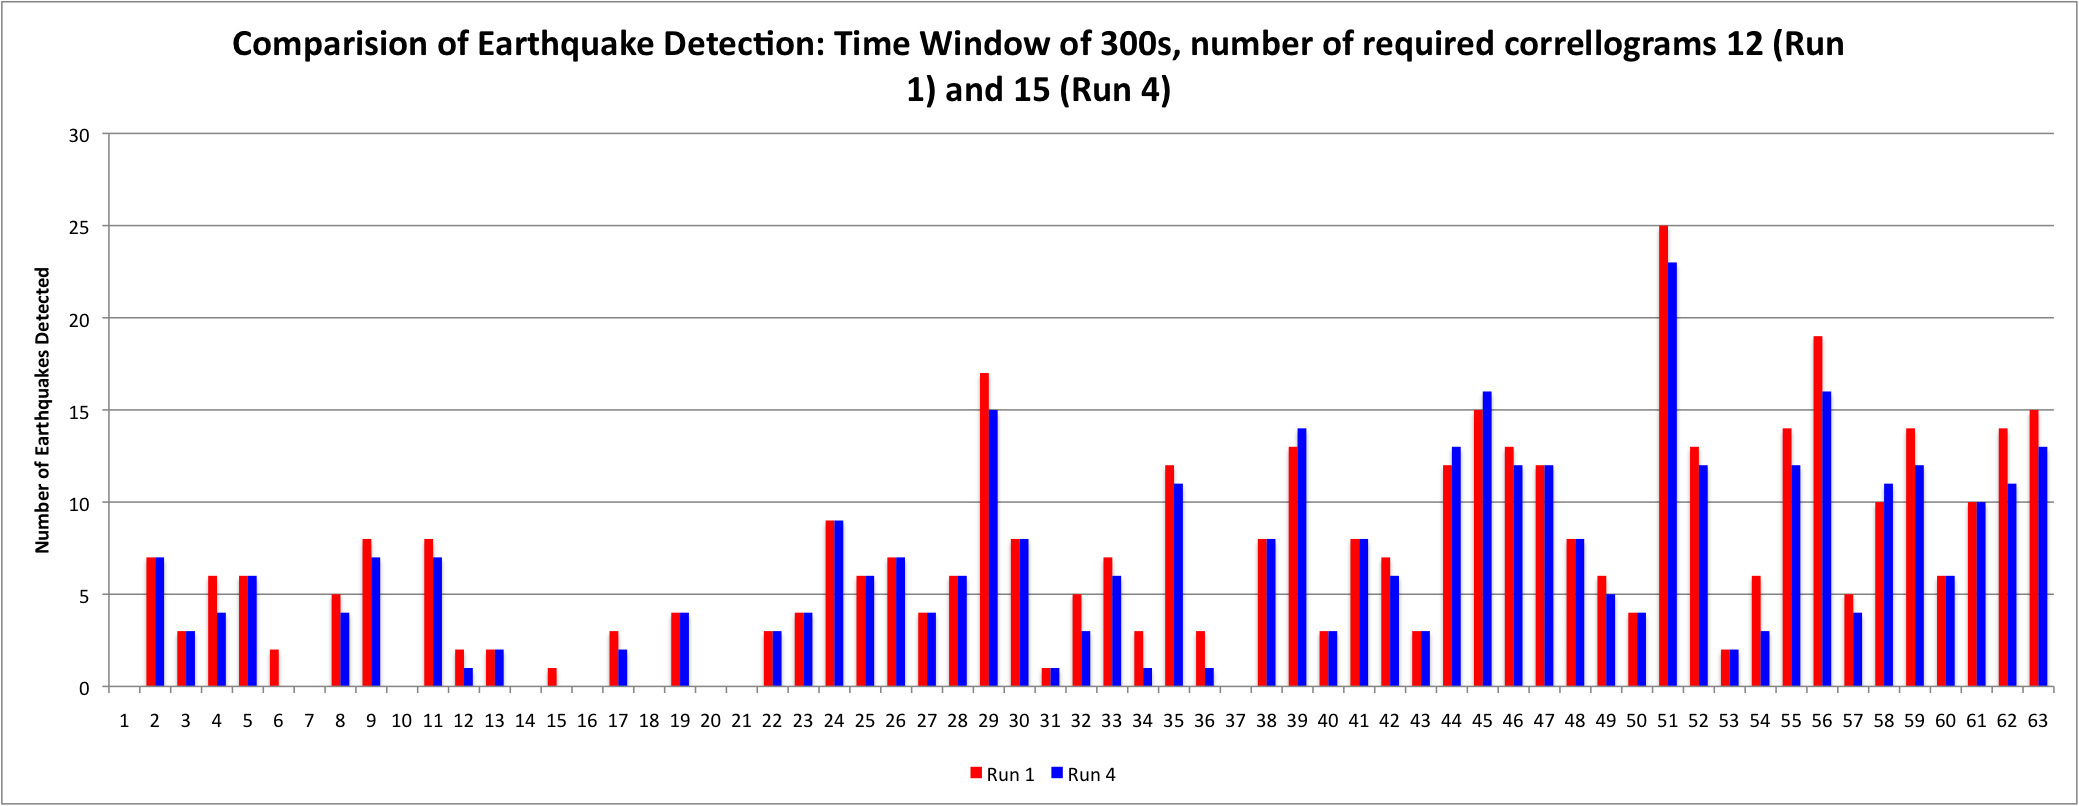
Note that on day 51 (the day with the most detected tremor), the number of earthquakes is at a maximum as well (25 and 23 events).
Run 2
The same parameters as Run 1, but the time window has been shortened to 180s.
Run 5
The same parameters as Run 4, but the time window has been shortened to 180s.

Note that on day 51, the number of earthquakes detected is again at a maximum, but this time it is 58 and 55 detected events.
Run 3
Same as Run 1 and Run 2, but the time window is 120s.
Run 6
Same as Run 4 and Run 5, but the time window is 120s.

Once more, on day 51, the number of earthquakes detected is again at a maximum, but this time it is at the highest with 79 and 74 detected events.
Week 6 Part 1
July 16th, 2011
It took a lot of debugging to unearth all the differences in the SAC files between the OBS data and the land data. Lian had to patiently show me how to edit the headers on SAC files before I could get the data read into matlab properly.
Once it was read in, the data is trickier to analyze than land data because there is so much more noise. I did ran the data through Matlab three times for only the first 12 days in 2000. I was only looking at the vertical component of the OBS data, when I compare the OBS data to the land data I will have to use the horizontal component to maintain consistency with what was done with the land stations.
The three runs were as follows:
Run 1
The high frequency correlation needed to detect if it is an earthquake (and therefore should be thrown out) was increased from 0.6 to 0.8. The plots produced by this are below.
.jpg)
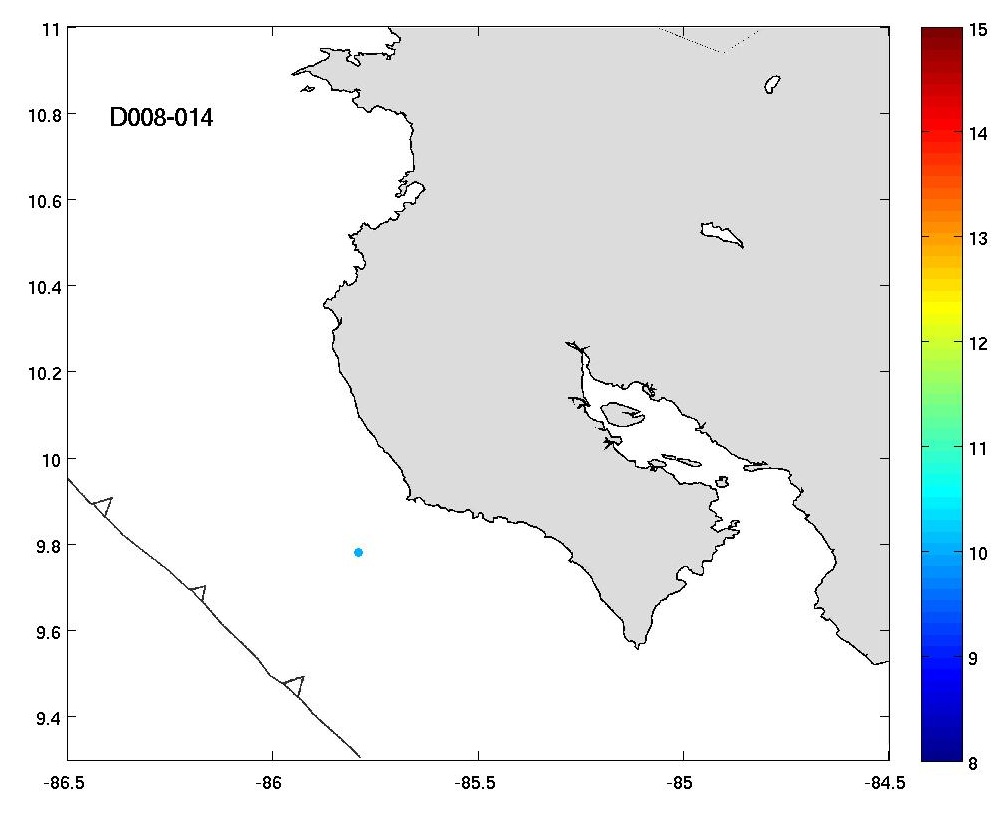
Again, the latitude and longitude are given on the axes, while the color bar signifies the Julian Day. As you can see, not much tremor was detected.
Run 2
The high frequency correlation was increased again to bring it up to 0.9.

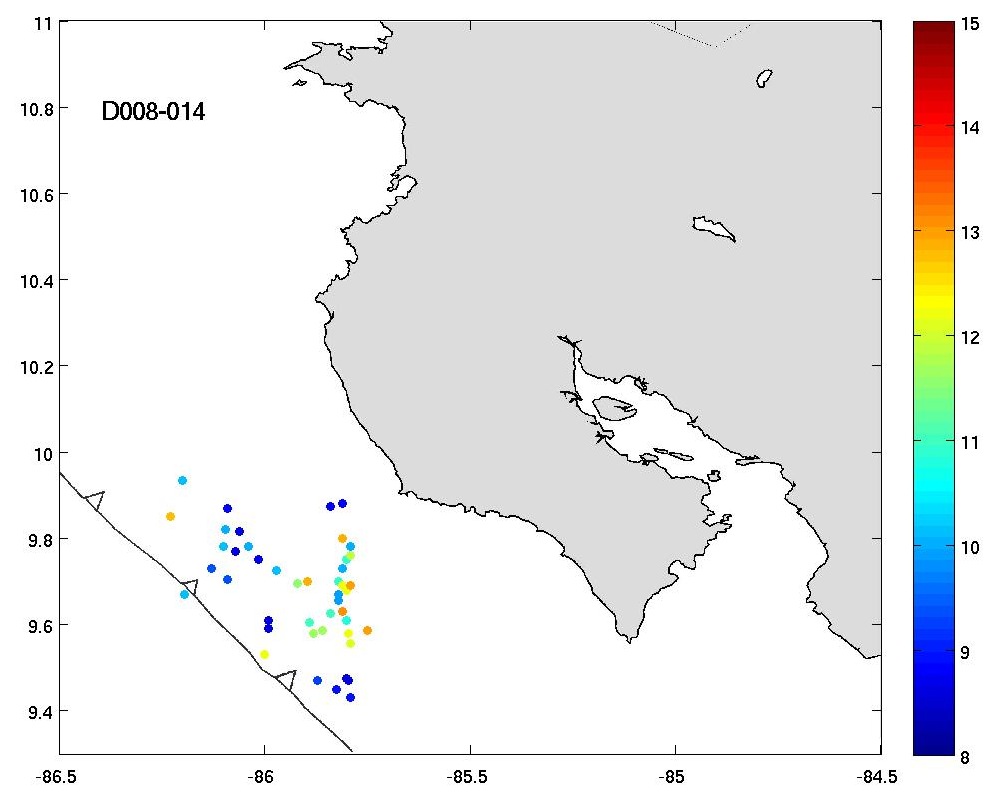
This resulted in much more "tremor" being detected...Which brings into question what is tremor and what are really just small earthquakes.
Run 3
This time the minimum correlation required to detect something as tremor was raised from 0.5 to 0.8, while the necessary high frequency correlation stayed at 0.9.
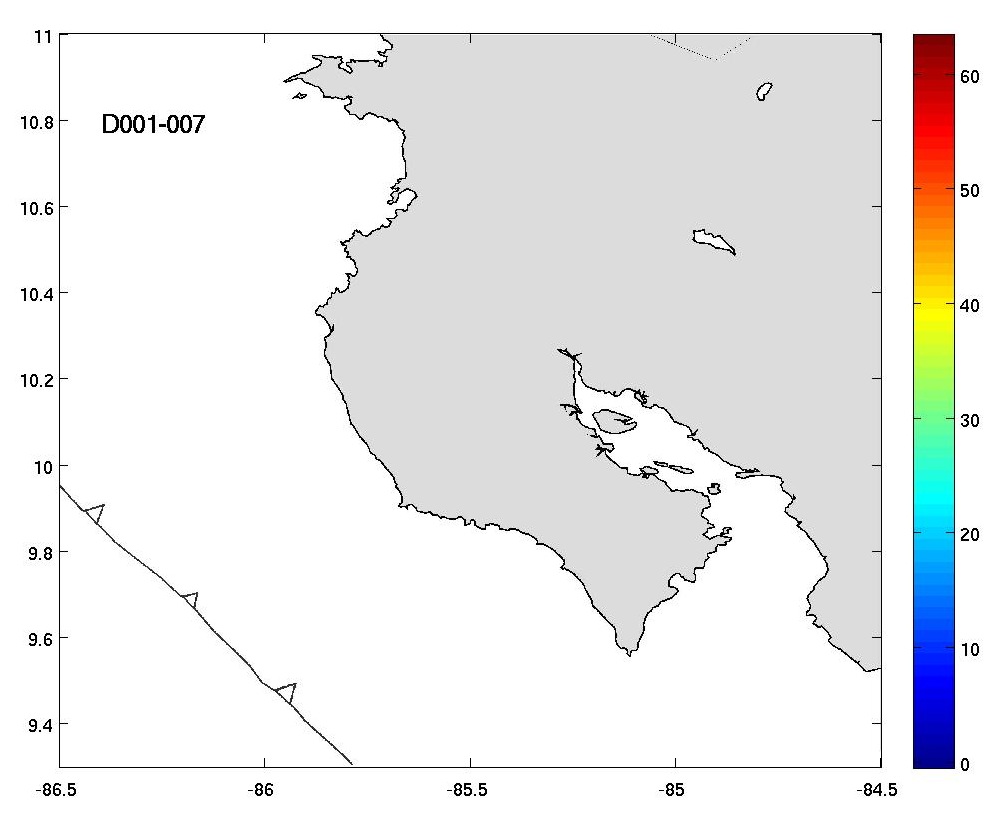

This resulted in the detection of very few tremor events. I will have to discuss it with Dr. Schwartz to decide what set of parameters makes the most sense.
Week 5 & Week 6 Part 1
July 13th, 2011
The trials and trevails of computers. Between running out of disk space and debugging codes, things have run slower than prefered. This week I have been getting results, so stay updated for the end of the week when I have more interesting things to share regarding the detection of tremor via OBS stations, as well as the detection of earthquakes.
Week 3
July 9th, 2011
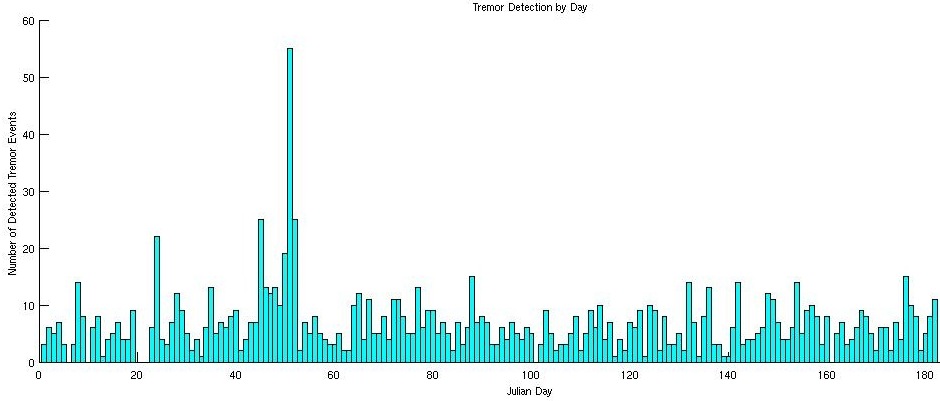
The tremor activity for the first six months of 2000 has been counted! Now, I am going to also be looking at what the ocean bottom stations (OBS) recorded, as well as double check the significant events on Antelope. Soon I hope to also start working on Generic Mapping Tools (GMT) software to create better maps of the tremor activity.
In the mean time, I've been soaking up sunshine on runs and chillin' under the clouds at the Monterey Bay Blues Festival.
.png)
Update on goals…
July 4th, 2011
A lot of people have been asking me about Goal #3, however, after discussing it with a knowledgable ecologist I decided against mailing a living slug to the East Coast. Since I do not want to be a slug killer, I will not want to mail a dead slug either.
So the following pictures taken in the forest will have to suffice:
.png)
.png)
Week 4
July 4th, 2011
This week has been much busier than the previous three, I've been helping prepare data from the Ocean Bottom Seismometers (below) to run the tremor detection program on them. The data is from the first 6 months of 2000.
.png)
(Figure from Brown, et al, 2005)
Early in this coming week I should have the tremor counts from that data. Meanwhile, looking again at data from 2000 but ignoring the OBS data for now, I have been comparing the detected earthquakes to the detected tremor. In a couple of days I will post a picture of the plots from that.
Susan thought it would be interesting to see if our tremor detection code could be altered to detect earthquakes. Using data from 2009 (as well as 2010) I tried to switch the frequencies used for detection from low frequencies to the high frequences of earthquakes and then compare it to the earthquake detection catalog put together by someone analyzing the data on Antelope. As you can see below, even when I altered the time window used for detection the Matlab code does not seem ever similar to what was actually detected. When looking at these plots, as with the others, the y-axis is latitude, x-axis longitude, and color bar signifies what day in the week the event occured.
.jpg)
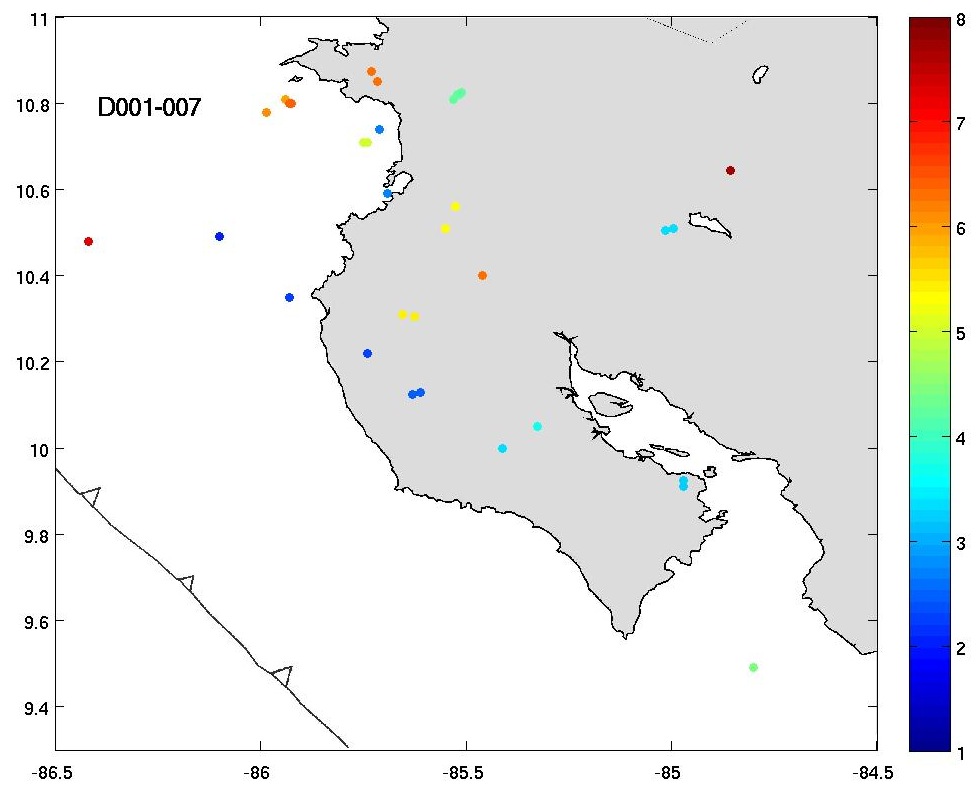
EQ Catalog Plot Matlab's detections using a 300s time window (the same used for tremor)
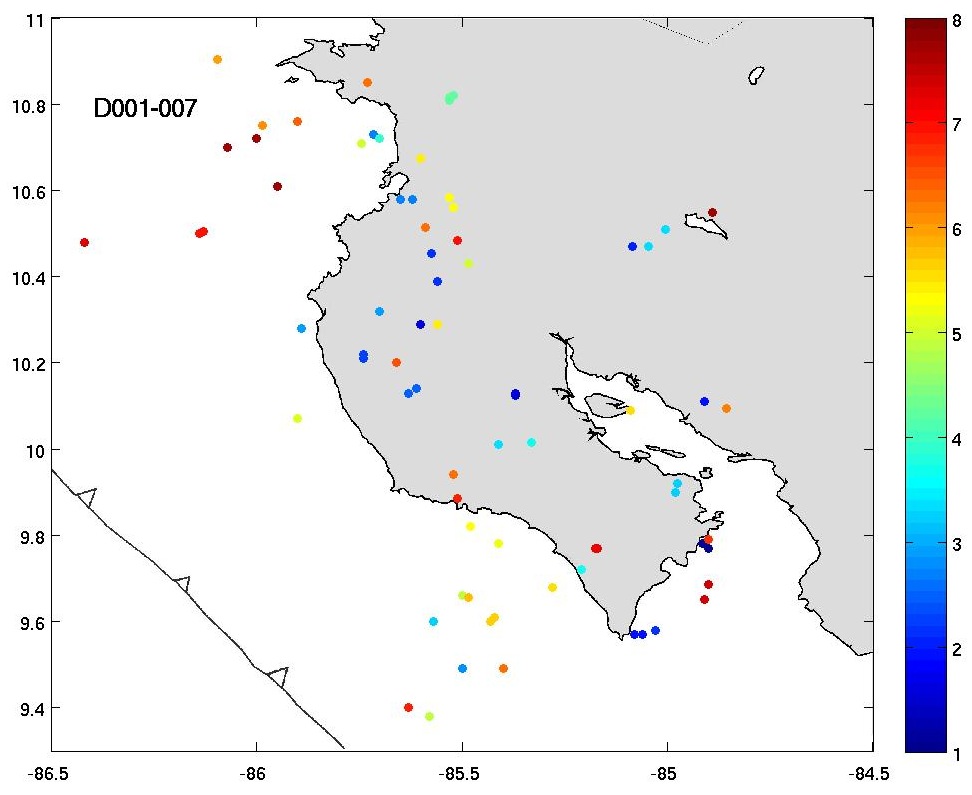

Using a 180s time window. Using a 120s time window.
Perhaps Matlab's detection will improve if I increase the correlation needed for detection. For tremor we were requiring 0.5 correlation, for earthquakes this week I will try to raise that to 0.8 and see if the results are cleaner.
Susan also realized this week that a huge a mount of data from 2007 and 2008 had not undergone our tremor detection process, so I also spent time converting the files into SAC and enveloping them. This week I will be able to start running the detection script on them as well.
Along with all this work keeping me busy, I've explored new running trials and went hiking with seismologist Lian, Han, Ling Ling, and Marine in the Big Basin State Park.
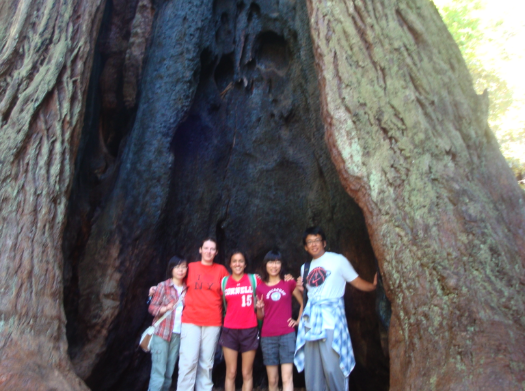
All of us inside a giant redwood tree! From left to right, Ling Ling, Marine, me, Lian, Han.
.png)
See how big the redwood tree is? This tree lived for over 1500 years, it started to grow during the time of the Byzantine Empire in ~500 AD!
Week 2: part 2
June 18th, 2011
So far I have only had the chance to plot the Nicoya Peninsula's tremor for the first 29 days of 2000.
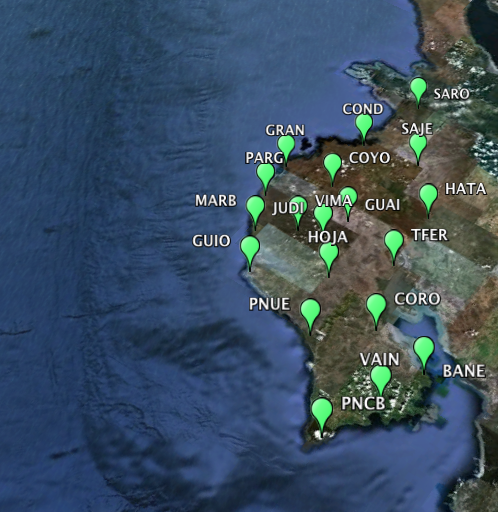
Here are the land stations used, as seen on Google Earth (note the subduction zone trench is visible to the left) :
When the detected tremor is plotted without any filters here is what the map looks like:
.jpg)
.jpg)
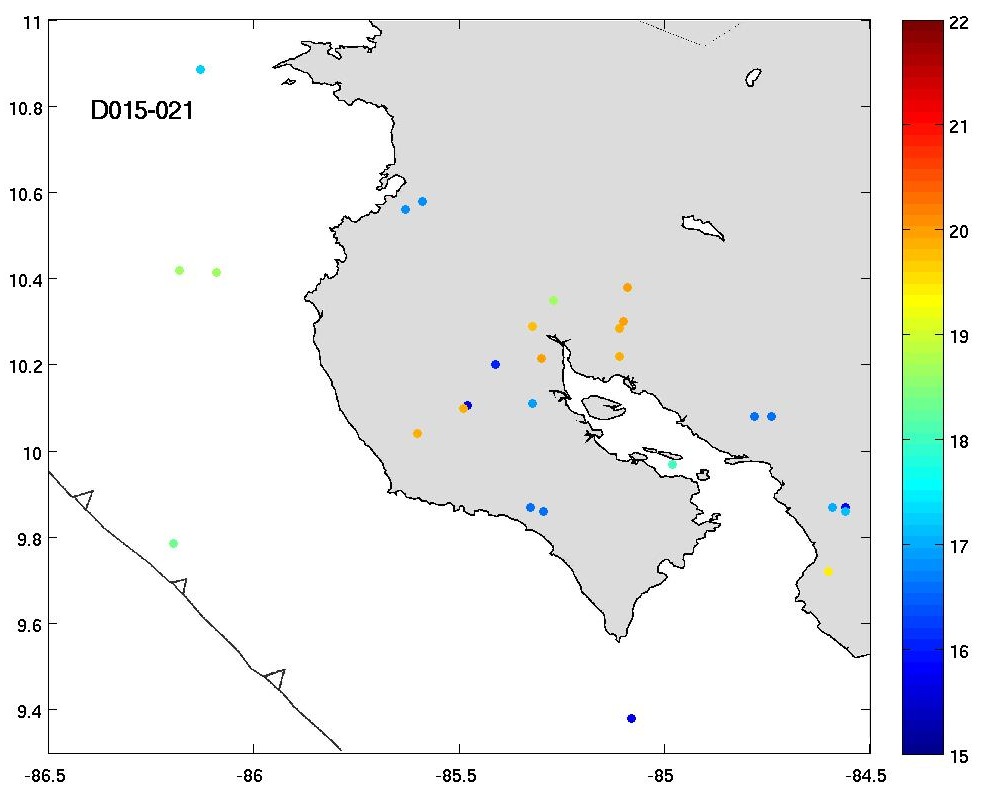
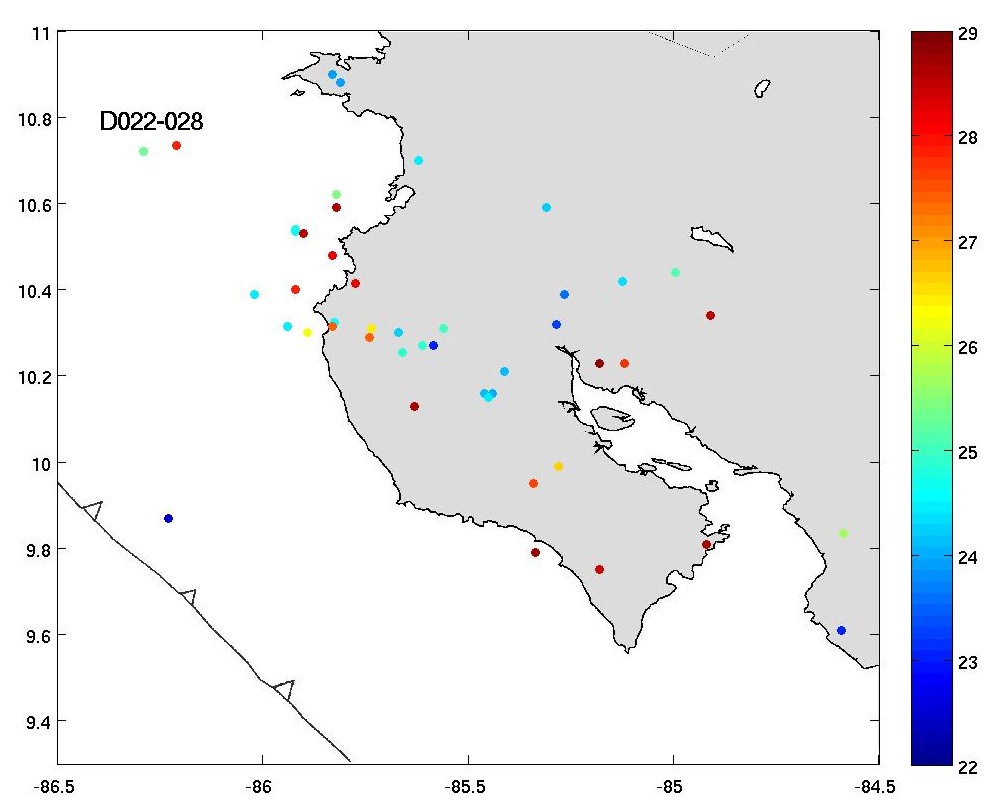
When a filter is used to give more weight to clustered tremor events (ie. when tremor recurs at least three times within +/- 24 hours at that location), this is what the plots look like:
.jpg)
.jpg)
.jpg)
.jpg)
Filtering makes a big difference. When filtered, the first week loses all its tremor events.
Four weeks down, many more to go!
Week 2: part 1
June 18th, 2011
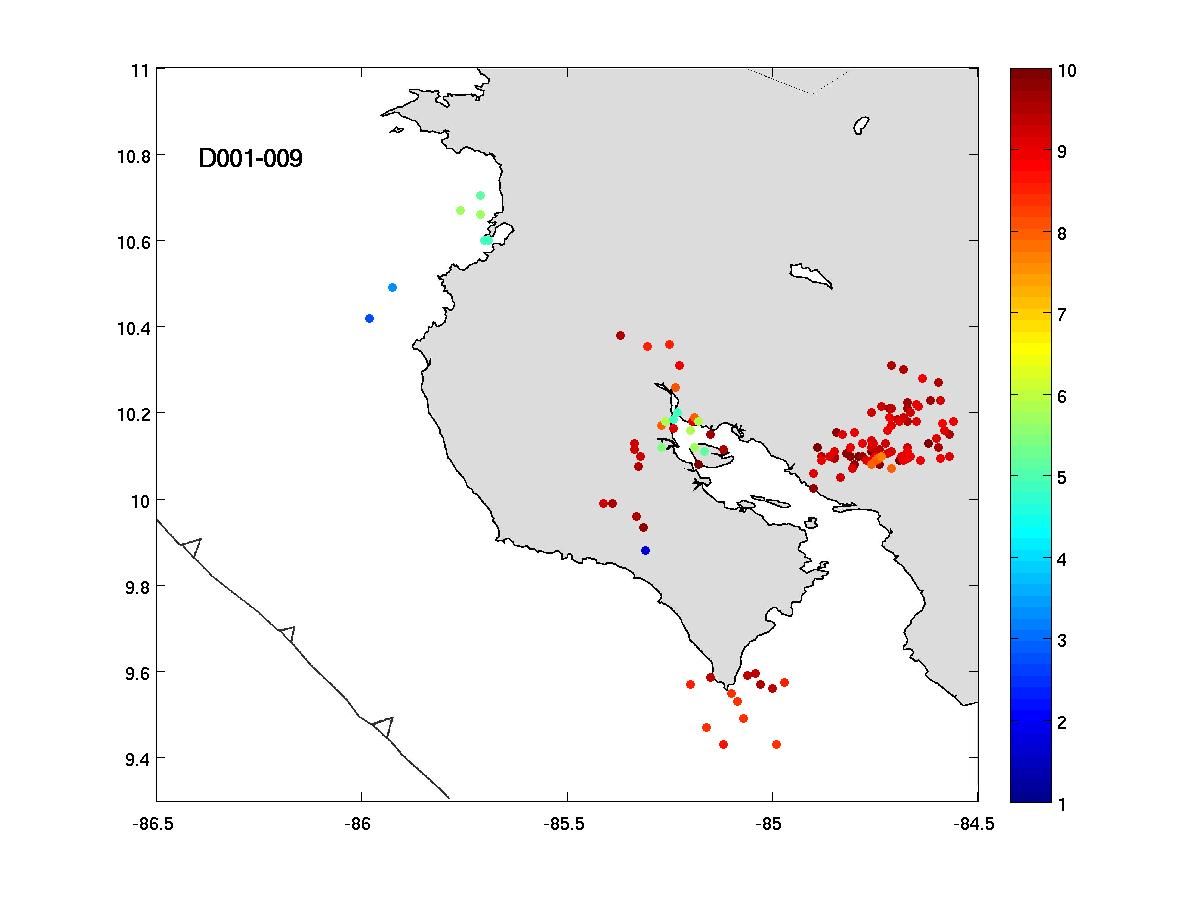
I've gotten a better handle on using SAC (Seismic Analysis Code) this week and finished analyzing data that had already been analyzed by a previous student, Marina Kim. Below on the left is Marina Kim's map and on the right is the one I produced.
.jpg)
There are still small differences between the images. This is because the tremor is identified in a slightly different way each time the program is run due to a method called "bootstrapping". Bootstrapping is essentially using different data points that have been randomly selected from the data each time a best fit line is made. This is done hundreds of times, and the average of all those best-fit lines is used to determine the tremor.
Of course, there are some differences between those maps that seem a bit too large for even bootstrapping and those may be because Marina used different parameters than I did to determine tremor clustering.
So now that I have passed the first "test" I have started looking at data Dr. Schwartz (and others) collected from the Nicoya Peninsula in 2000-2001.
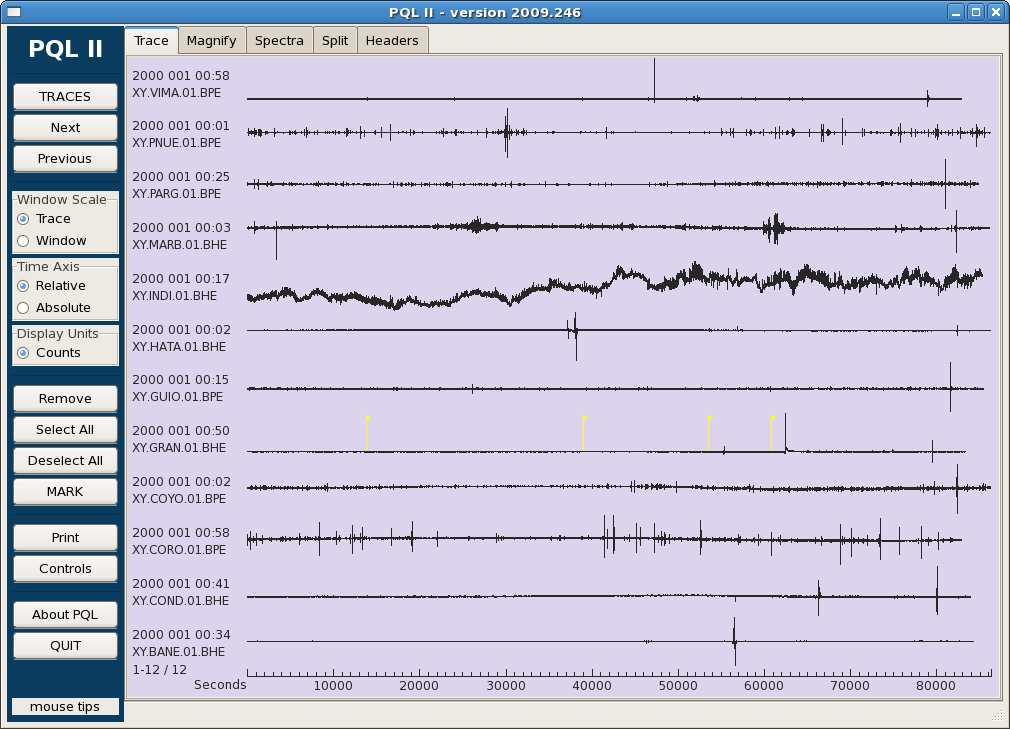
Because the data is from a decade ago, when they collected it they did not follow the same organizational strategies they do now and no database was prepared for Antelope analyzing. So instead I will use PQL to do minor checks on the continuity of the data.
Hopefully I will unearth some interesting data...
Week 1
June 11th, 2011
.png)
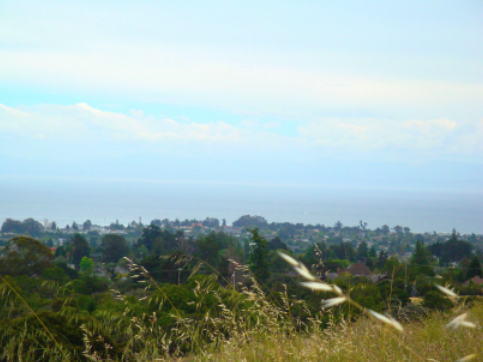
Today marks being in Santa Cruz for a week! Besides learning how hilly it is here and finally getting my bearings around campus (being in a redwood forest is beautiful but can be very disorienting and confusing at first...), I've met most of the graduate students in the seismology lab, as well as the local bike store's mechanics (my bike had an ugly surgery..).
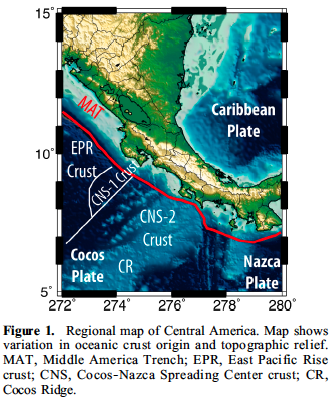

(Figure 1 & 2 from Outerbridge, et al, 2010)
From reading more articles I have a better understanding of the region and processes involved in our project and thanks to the patient assistance of Lian Xue, a graduate student also working on this project, I've gotten a better handle on using Seismic Analysis Code (SAC) and Antelope. Hopefully by the end of next week I'll be looking at actual data from the 2000-2001 period that needs to be analyzed, but for now I have been practicing these foreign computer programs and packages by analyzing data that Dr. Susan Schwartz has already looked at. This way my results can be easily double checked against something already known so I will know whether or not I am executing the programs properly.
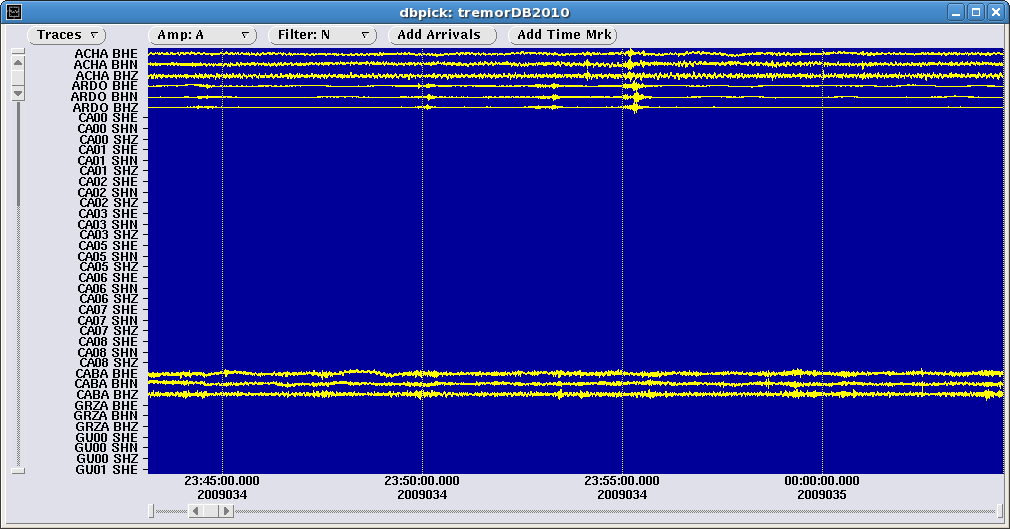
Here is is an example picture from Julian Day 34 (February 3rd) of 2009. Near 23:55 there is something that may be tremor (see the bulges?). It shows up at a couple stations which suggests it may be more than noise, but because tremor is small it is not very clear at further stations. If Lian and I analyze the 2000-2001 data correctly we are likely to find similar cases of this occurring.
Meanwhile, I'll keep avoiding mountain lions while I bike and run...

Summer Goals
June 8th, 2011


Academics/Research Summer Goals:
- Develop a better understanding of seismology in general
- Develop a better understanding of the processes involved in slow slip earthquakes
- Develop my reading, writing, and applied math skills for future classes and research
-
Learn more about the different opportunities in geophysics research
- fields of current and future research
- other research institutions for either graduate school or employment
- Make a meaningful contribution to the geophsyics research being done in Dr. Schwartz's research lab
Other goals
1. Get better at biking up hills

2. See a sea lion in its natural environment
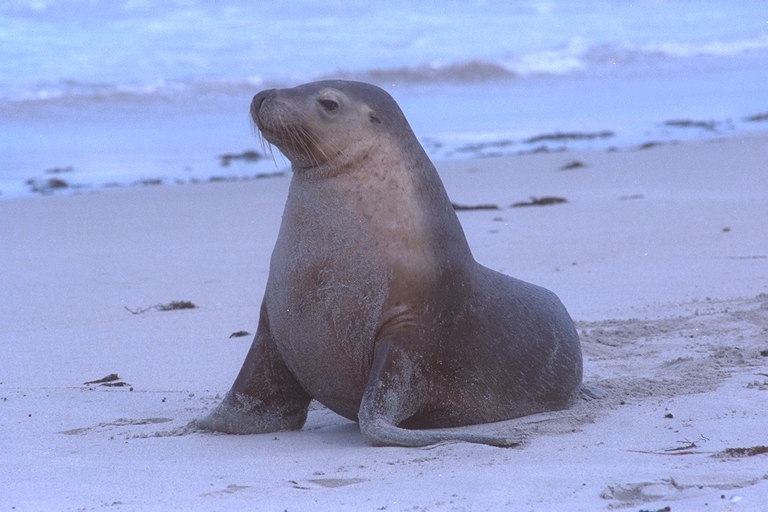
3. Catch a banana slug (maybe mail it to someone...)


4. Get involved in the local community (attending local festivals and some community service)

5. Grill delicious lamb with my amigos (on the beach?)


