Ty
Ty is a student at McGIll University currently completing his research at University of Oregon under Dr. Amanda Thomas.
This project seeks to use Tide Gauges as a way to detect vertical, geodetic deformation due to slow-slip earthquakes. While GPS stations can accomplish the same feat in the modern age, Tide Gauge records go back many decades beyond the earliest deployed GPS. However, Tide Gauges are subject to a wide variety of phenomena (changing water levels, changing tidal phase arrivals due to meteorological effects, etc.) which make the signal of the slow-slip earthquake difficult to make out. This team seeks to uncover a solid methodology to isolate this signal and trace back slow-slip earthquakes through the last century, which can shed light and provide valuable information on the fault mechanics and potential earthquake hazard of the Cascadian Subduction Zone.
The Conclusion
September 6th, 2018
It's been a while, but I wanted to take the time to wrap up this blog with one last post. In the end, our results were not able to conclusively and consistently isolate the signal of the slow slip earthquakes in the water levels, but there is certainly great potential in the methodology and what was accomplished. As evident in the poster, tide gauges with water levels varying by meters per day were processed to the degree that ocean noise was reduced to mere millimeters. With noise of this order of magnitude, we attempted to observe our desired signal of a few mm of deformation over approximately one month. You can check out the final draft of the poster below. (Note that the quality is somewhat reduced because the blog server can't accept vector format images)
I'm so proud of what I've accomplished this summer and would like to thank everyone who helped me along the way, as well as personally thank IRIS for giving me this opportunity. Without a doubt, I challenged myself this summer and learned the ropes of what graduate school is like. I feel emboldened by this experience and am excited for what the future has to offer.
Signing off,
Ty : )

Weeks 7-8: Lessons Learned and the Endgame Plan
August 1st, 2018
The last month has been pretty intense to say the least. With working 60-70 hours per week, every Saturday and Sunday (save the one Mariana and I went adventuring), and the Fourth of July, I definitely feel like I'm back in the semester already. It has also been a rather frustrating experience to put in this much time and not receive any definite results in return. However, I feel like this has been a fantastic lesson for me along the way. I've learned that research is often an arduous process, with no guarantee for success at any given point. In addition, this has taught me a different type of resilience and perserverance than I am accustomed to. In school, I am used to persisting in a task until I reach the answer or conclusion that is laid out in front of me. Here, this persistance takes on a whole new meaning. After having failed a multitude of times to achieve our ultimate goal, I've had to learn how to restrategize, reassess the situation, and figure out what we can do to move forward or move around the problems that lie before us. It's ironic; I thought before starting this internship that what I would learn most is academic knowledge, programming, theory, etc. However, what I feel like I've learned much more about is the importance of communication and how to take initiative to achieve my own personal goals.
The last of the above lessons may be the most important because I realized that it is imperative to take an assertive stance in order to bring about the change you desire. For example, taking the steps to reach out to both the other interns and the IRIS directors has been crucial in getting the help and information I needed speak with my advisor and ensure that my project would be heading to AGU this December. As of today, we have the abstract in and I am currently working on a defined list of concrete goals that we will achieve in order to have a rockin' poster before my departure on August 15th.
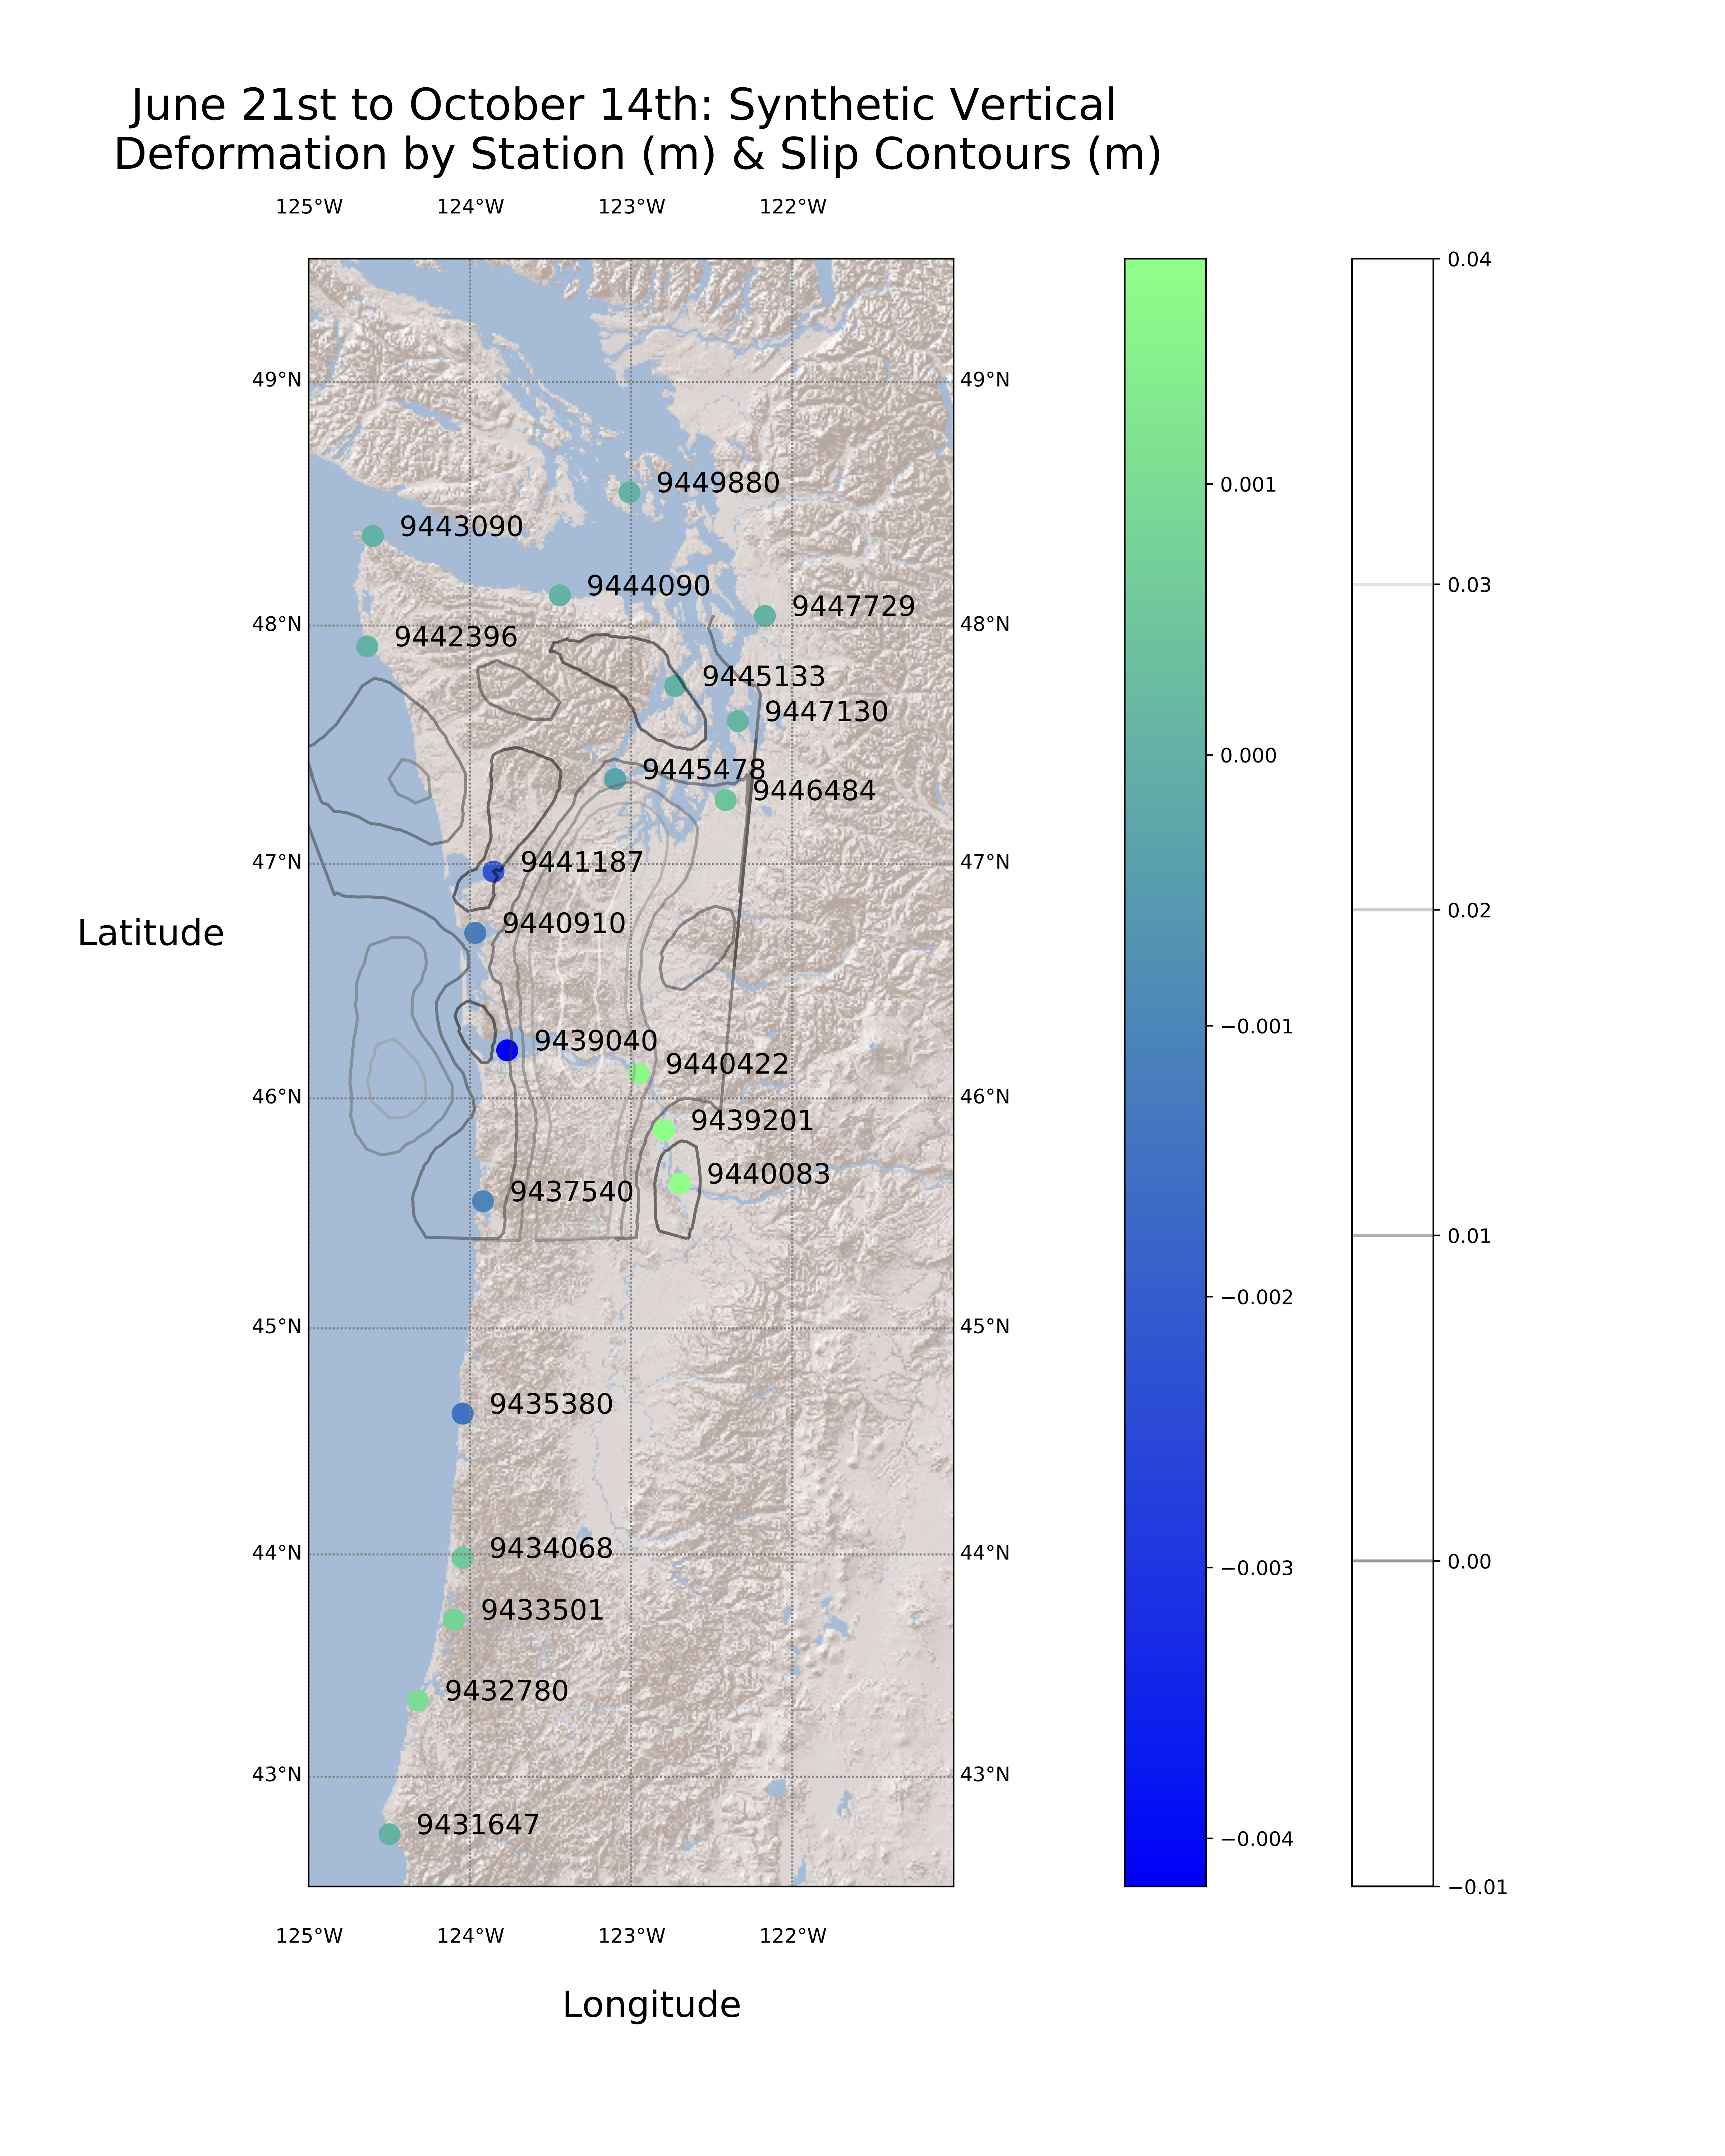
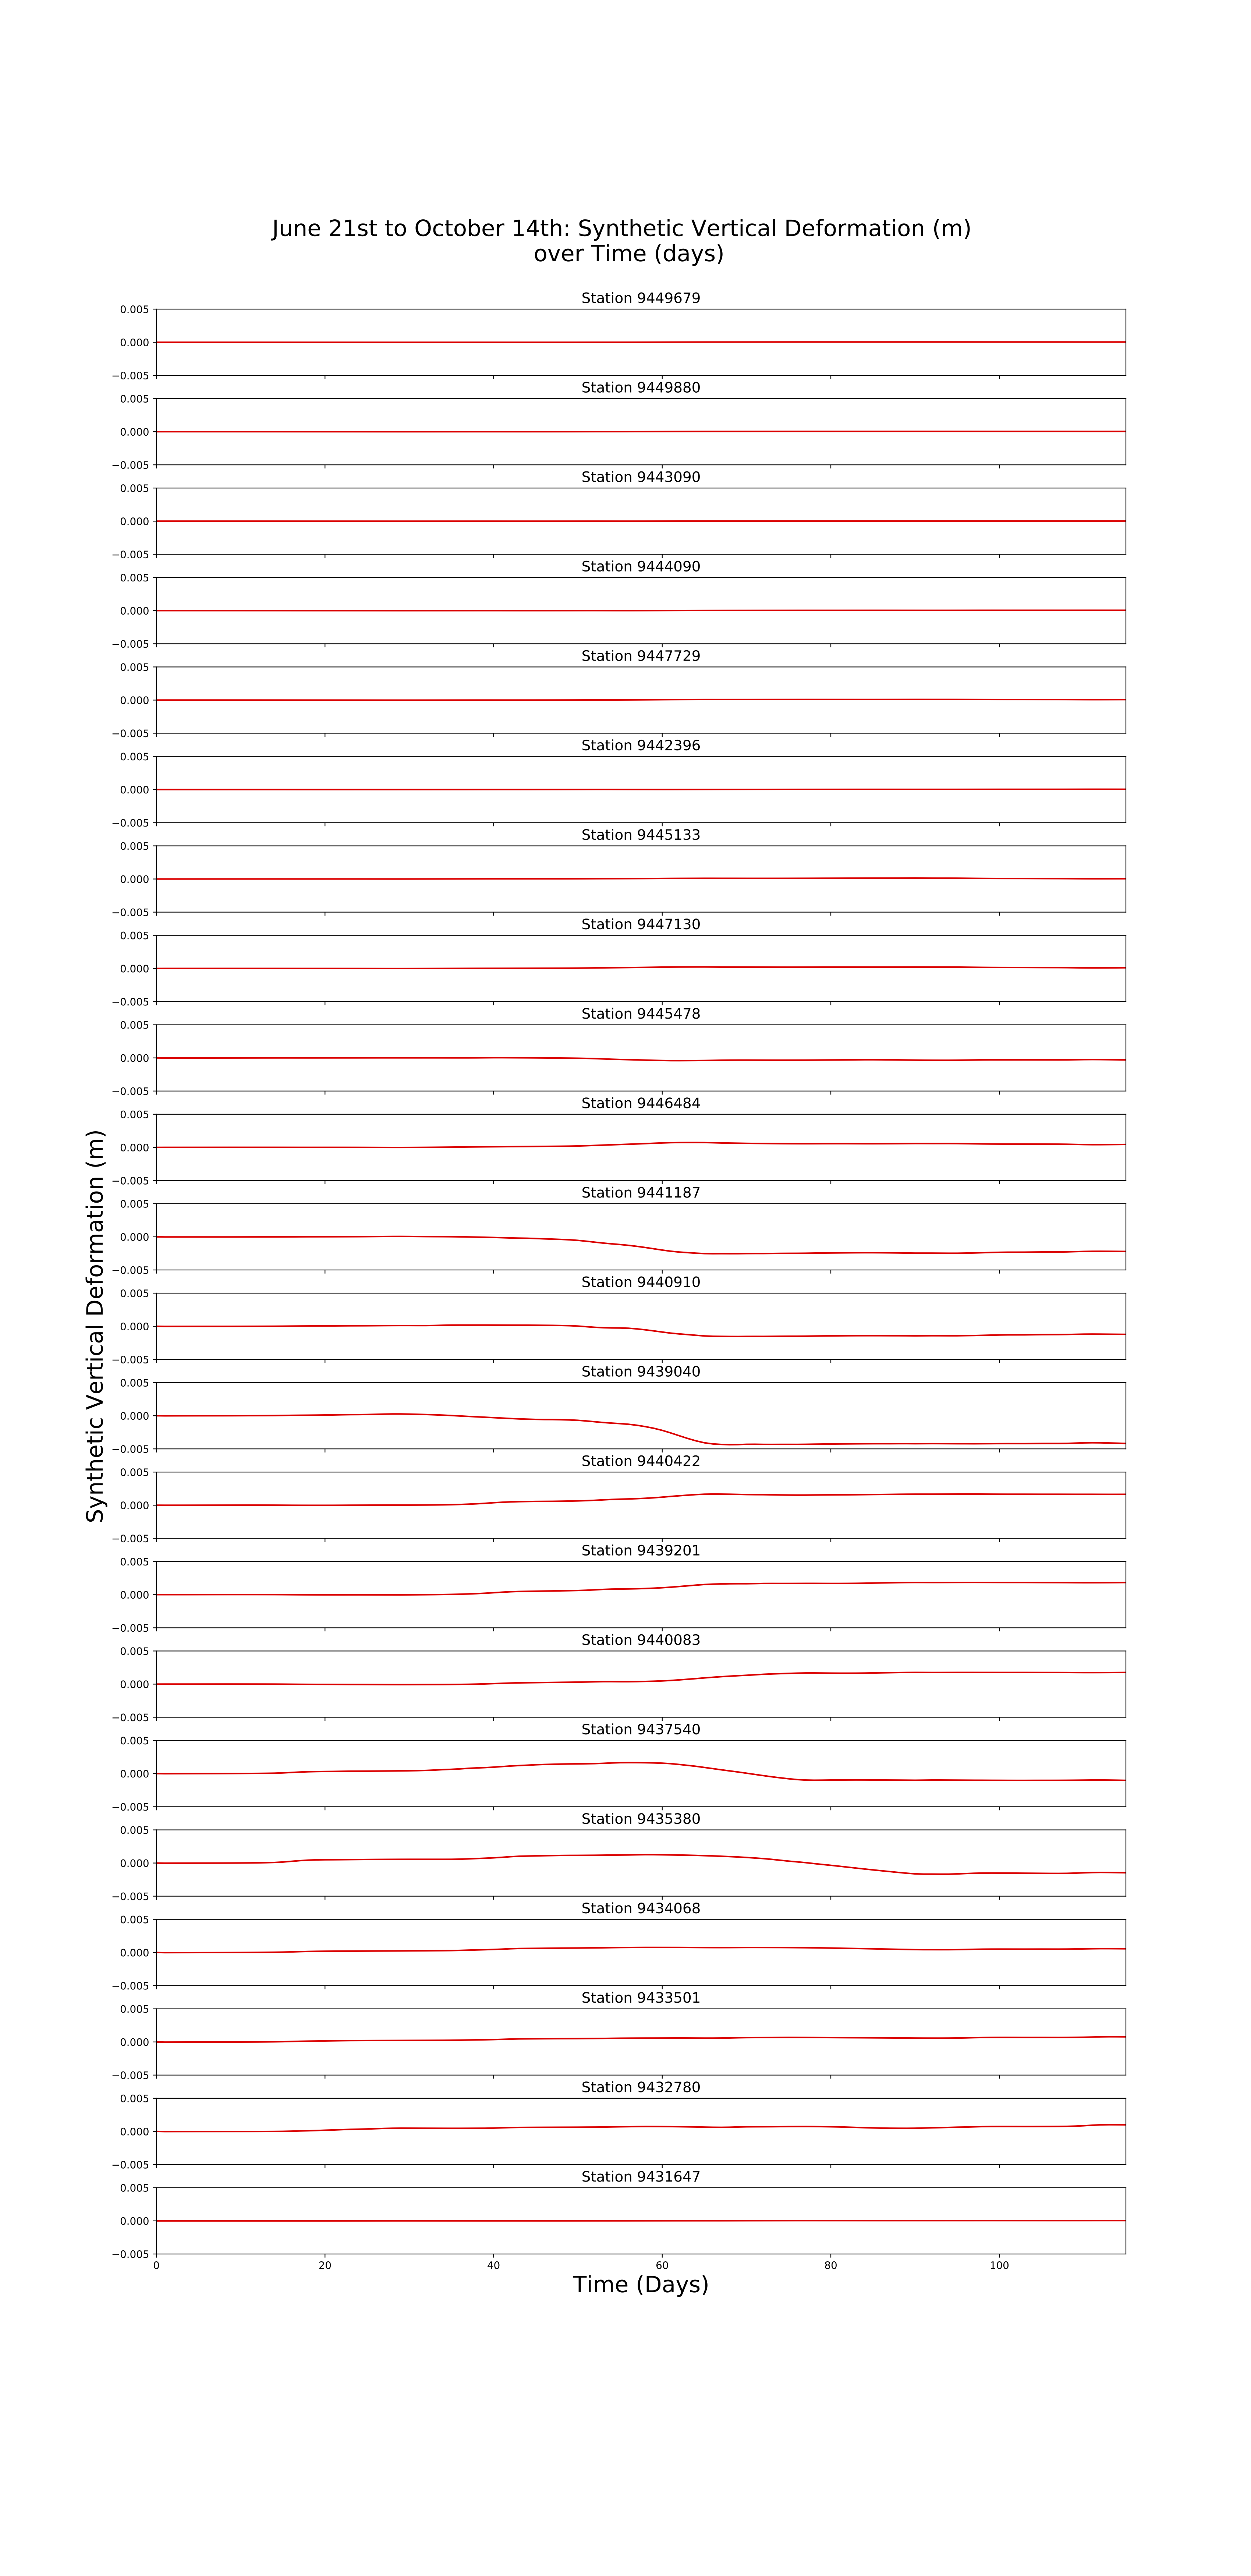
Despite some things not going as planned, we also have had a great number of successes over the last two weeks as well! One major directive we've taken is the development of synthetic data for a typical slow slip event in Cascadia. The model works in which an ETS event of a particular geographical extent and magnitude induces vertical deformation across the Pacific Northwest, in which we calculate the expected deformation for each tide gauge as a function of location. This is important because it serves as a reference to what size of a signal we would expect to see at each station. That said, we are expecting (for a regularly sized slow slip event) to have maximum station deformation magnitudes of +/- ~4 mm (it varies by event). You can check out some non-finalized figures below:
In addition to the synthetic modeling, we've created many other scripts in Python to analyze and categorize the data. Some of these included a station clustering script to group stations within a certain distance by common noise (where I finally got to do some math and use some good ol' spherical trigonometry to derive an equation for distance between two points on the Earth), a script to visualize the various time periods each tide gauge operates on, and of course the many attempts to reformat and reprocess the data such that the transfer function (from the past PhD student) would work better. Now, although it hasn't worked as well as we've liked, we've still managed to reduce the noise down to a few centimeters of water fluctuation. It is certainly possible that within the next two weeks we will manage to further filter out this noise. Currently, the biggest obstacle (aka the largest noise) we are observing is a pesky solar tide, but past that the signal falls near the order of magnitude we need it to be (millimeters). As I stated in the beginning of this post, we will remain persistent and work hard until the end. At the very least, I'm extremely proud of all that we've accomplished thus far.
Weeks 4-6: An Obnoxiously Long Blog Post
July 18th, 2018
So much progress has been made within the last few weeks that I hardly know where to begin! The last I left off, we were still attempting to put the data into the desired format (yearly records, converted into trace objects in Obspy, saved as SAC files). Despite past struggles with Python, this last data processing step was accomplished rather quickly, as I felt that Week 4 was the week where my skills (and particularly speed) with Python truly solidified. With all of the processing finally out of the way , I wrote a script which:
- Pulled in and combined all tidal records for any user-specified date and latitude range
- Sorted the tide gauges by latitude
- De-Tided the water levels through UTide
- Low-Pass Filtered the water levels through Obspy
These parameters were necessary to specify because all of the tide gauges are operational over different time intervals, the slow slip quakes only occur in certain locations during specific events, and these constraints enable us to view every piece of the data we possess for a slow slip event. The latitudinal sorting was implemented with the hope that, since in Pacific Northwest the slow slip events occur (generally) in a line slightly less than parallel to a North-South meridian, we could then track the deformation pulses across space.
An example of a slow slip event in 2017 can be seen below. The first figure is obtained from the Pacific Northwest Seismic Network and plots detected tremor with respect to time ([url=https://pnsn.org/tremor]https://pnsn.org/tremor[/url]). The second figure is our 6-minute water level data for 16 stations which were active during the event and within latitudinal range to experience deformation. The water levels have been de-tided and put through a 2 day low-pass filter.
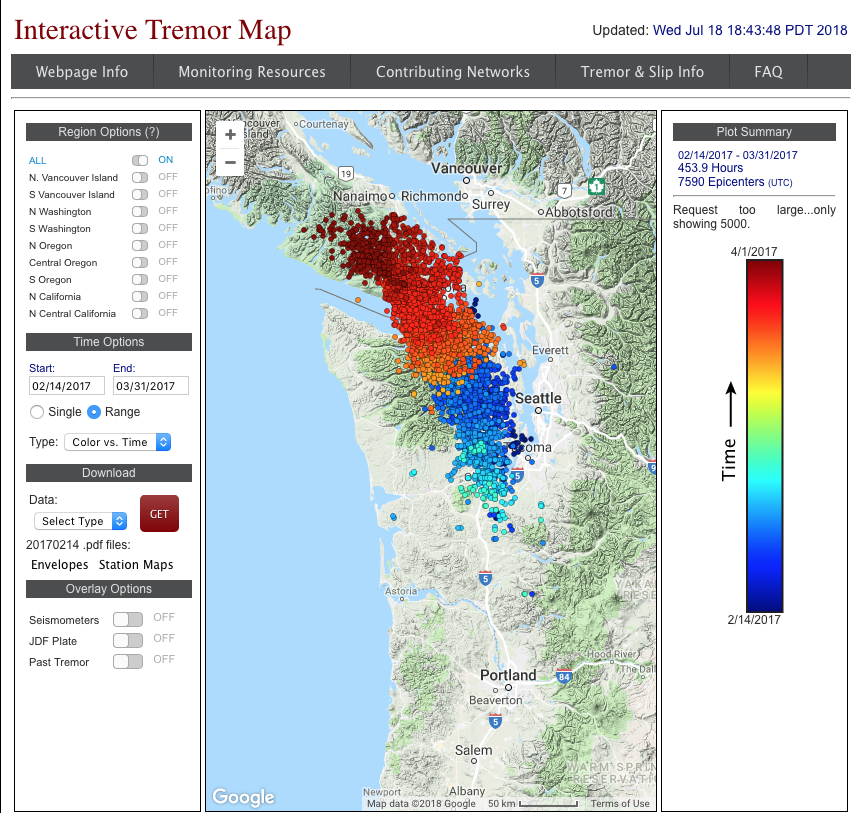

Unfortunately, there were a few problems with the results obtained at this point. First and foremost, no transient slow slip pulse is observed across the stations. This is because the detiding and low-pass filtering have been unable to fully denoise the data to the extent that we need. Water levels in the oceans, bays, and rivers are subject to a very wide variety of both oceanic and atmospheric phenomena, including storm systems, changes in ocean currents, seasonal variation in sea level, etc. The post-doc in our team, Quentin, predicted from synthetic ground deformation models that the deformation signal from a slow slip event should be on the order of millimeters, not feet (which is what ours is in in the second figure above). In all honesty, it wasn't much of an earth-shattering shock that this methodology didn't work (catch the terrible geophysics pun?). However, these steps were excellent preliminary strides on the long path to an isolated deformation signal.
With these results being insufficient, it was time to bring in the heavy artillery to denoise these water levels. Without going into too much unnecessary detail, a past PhD student named Alba Sequoia had created a cross-correlation method between tide gauges which was able to denoise the station data to the degree that slow slip events could be identified. While this is sufficient to detect known slow slip events, it needs to be improved such that historical slow slip events can be discovered. This is where our team comes in. During the ample time we had waiting for Alba's code, we've been preparing a series of methods to improve on her method to denoise the data to an extreme degree and isolate that sought after deformation signal! Some of the signal processing methods we've armed ourself with are:
- Station Running Averages
- The Discrete Wavelet Transform
- The Hilbert-Huang Transform
- etc
Since, as of today, we just received Sequoia's code, we will try to implement these methods as soon as possible. I'm extremely excited to see if we'll be able to get the historical ETS record we're searching for!!
(Below are additional images of all of the 6-minute and Hourly Tide Stations that we're using. Don't worry about reading each number; we've created these for our own reference so we can check an individual station's record with respect to the transient slow slip. Here, they simply show the extent of the data we're working with.)


Mariana and I have done a ton of fun stuff outside of our projects as well! The first two events were done during our regular working hours so I'd like to give a big shout-out to our mentor, Amanda, as thanks for letting us experience other aspects of geophysics and seismology while we're here. Going into the field for a day definitely motivates and inspires the both of us by seeing first-hand some of the phenomena that we discuss every day.
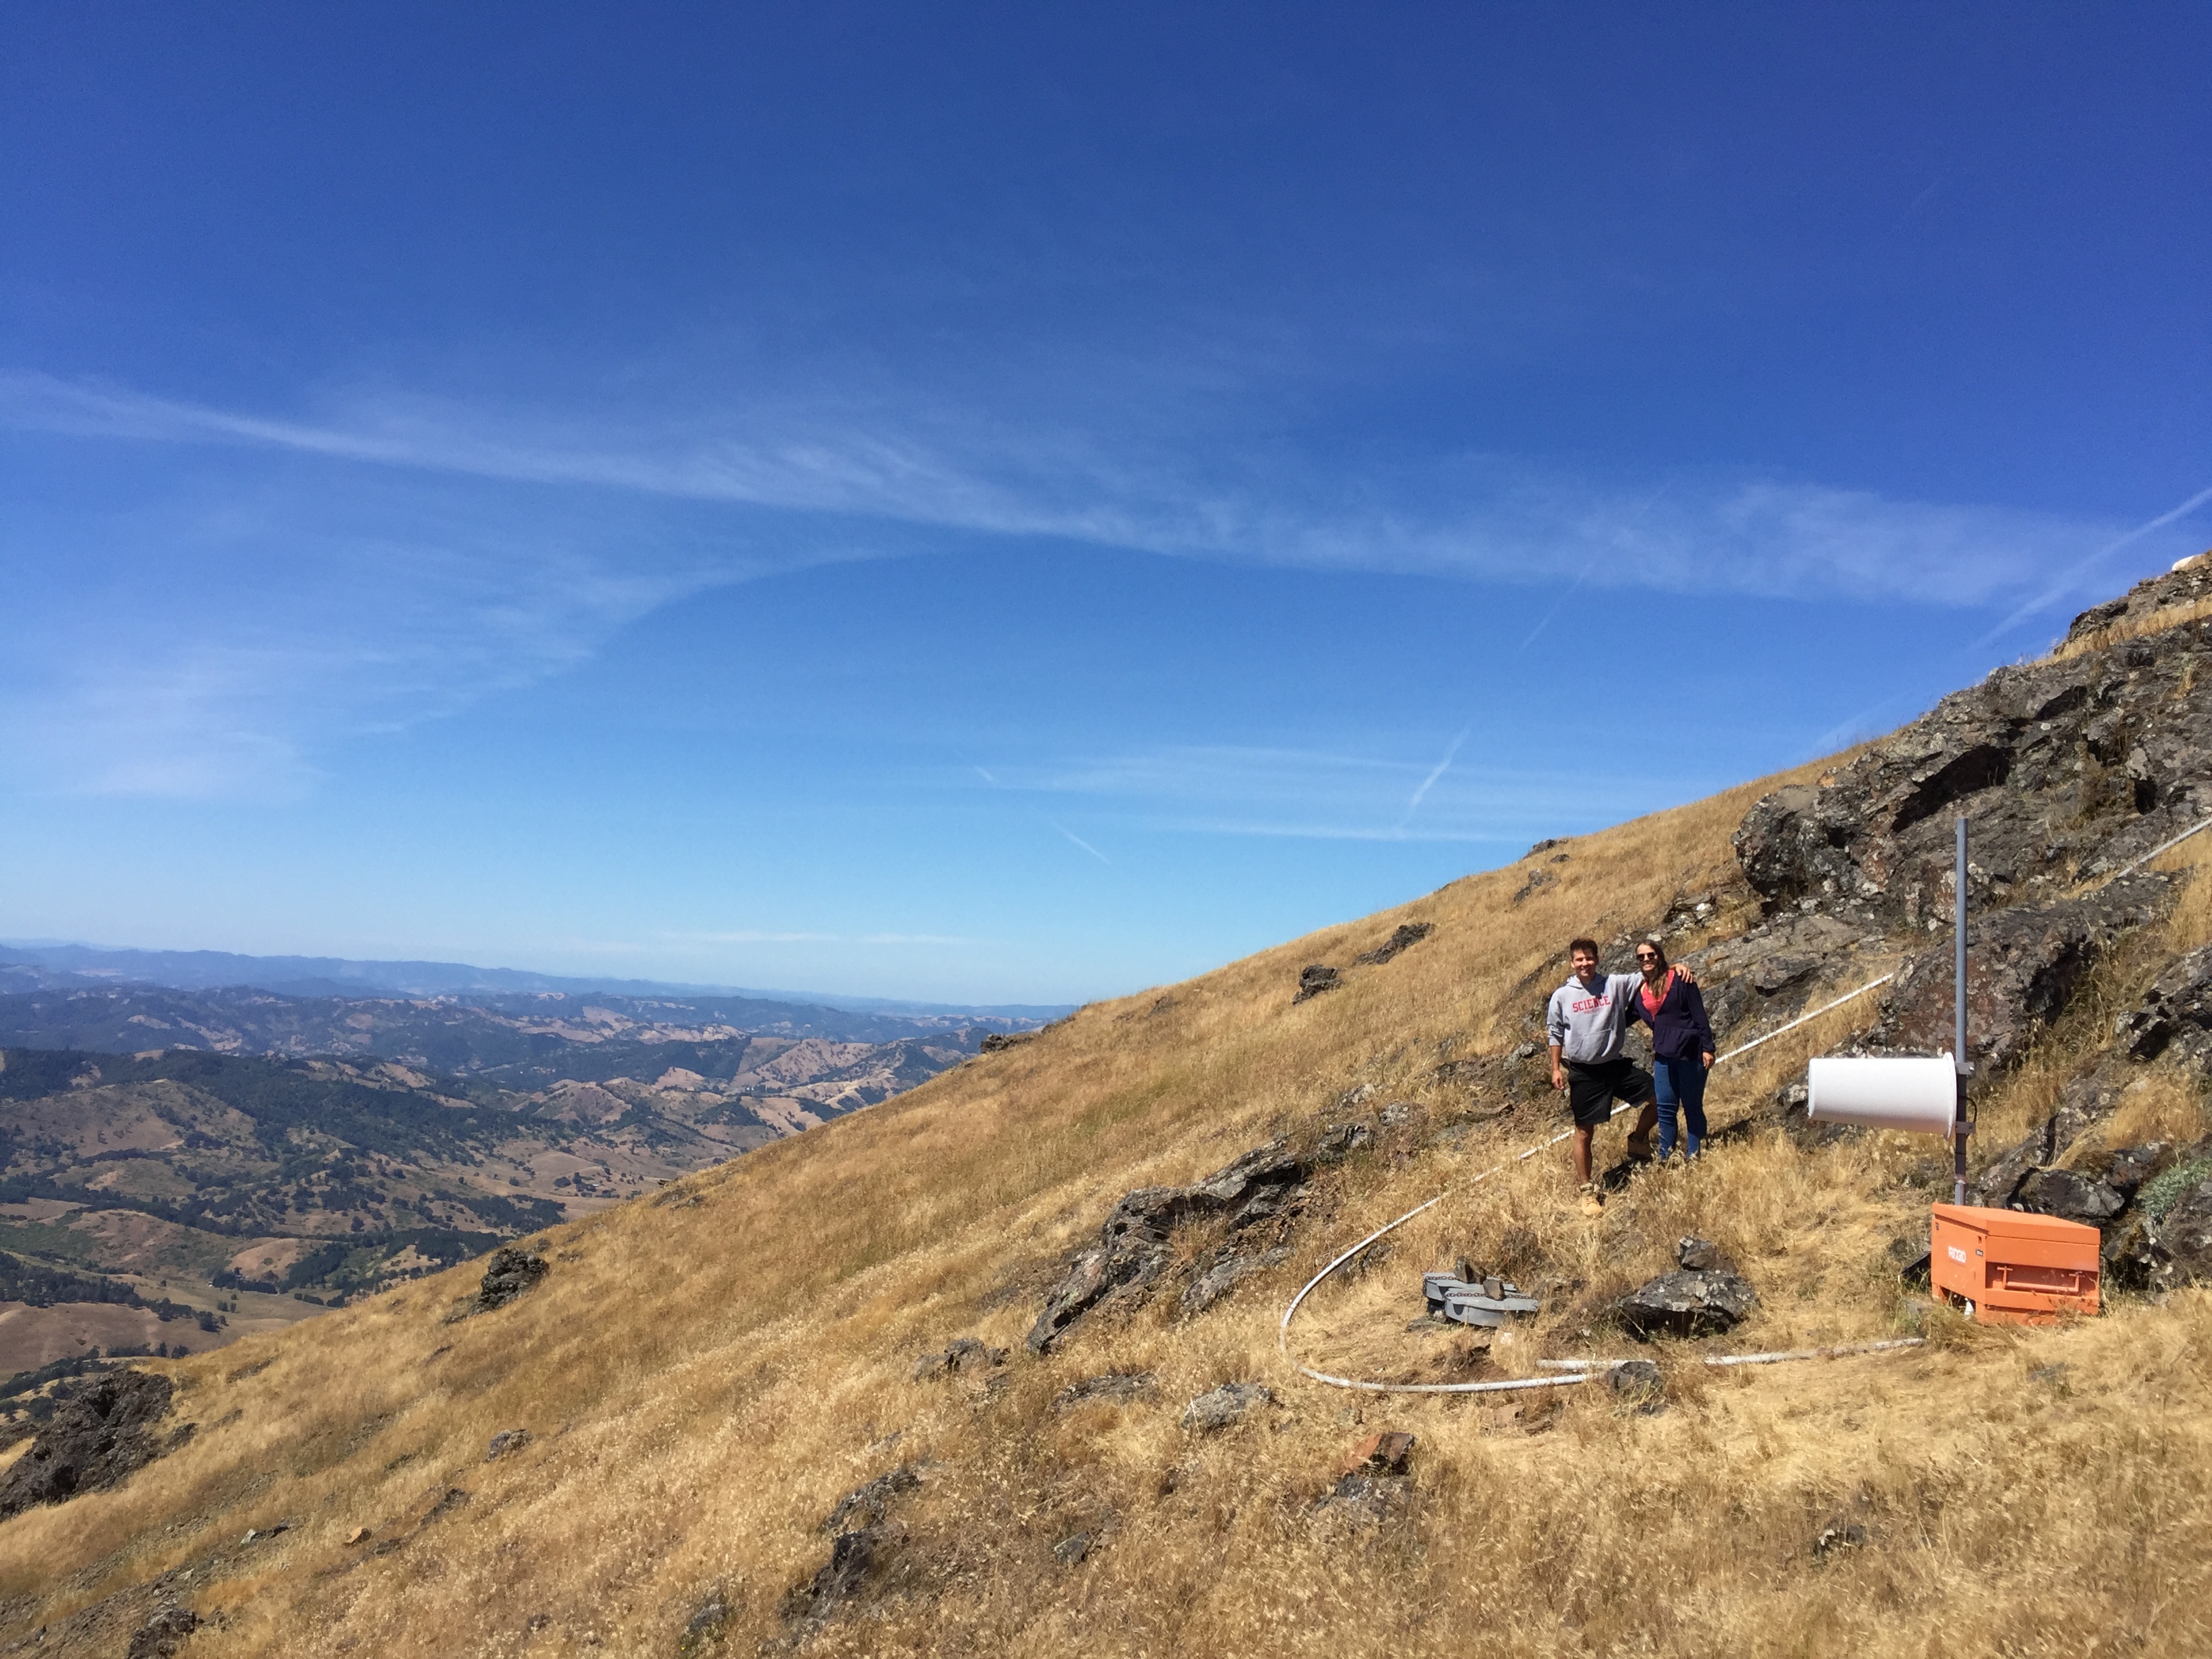
a) Leland O'Driscoll and Sara Meyer of the PNSN division here at the University of Oregon were kind enough to bring us to Dodson Butte to perform a seismic station repair as well as upgrade the station with a system called ShakeAlert, which will give neighboring towns warning signals if a major earthquake hits. Not only did I find the job interesting, but it was (most importantly) extremely impactful. This ShakeAlert system has the potential to give people the seconds of warning they need to run outside or duck under cover in the case of a major earthquake. This can make all the difference when it comes to living or dying in a high-magnitude event. I felt really inspired seeing what I could do with my education and degree - things like this are the exact reason I wanted to be a scientist in the first place. Both Mariana and I learned so much that day - thank you so much for having us along!

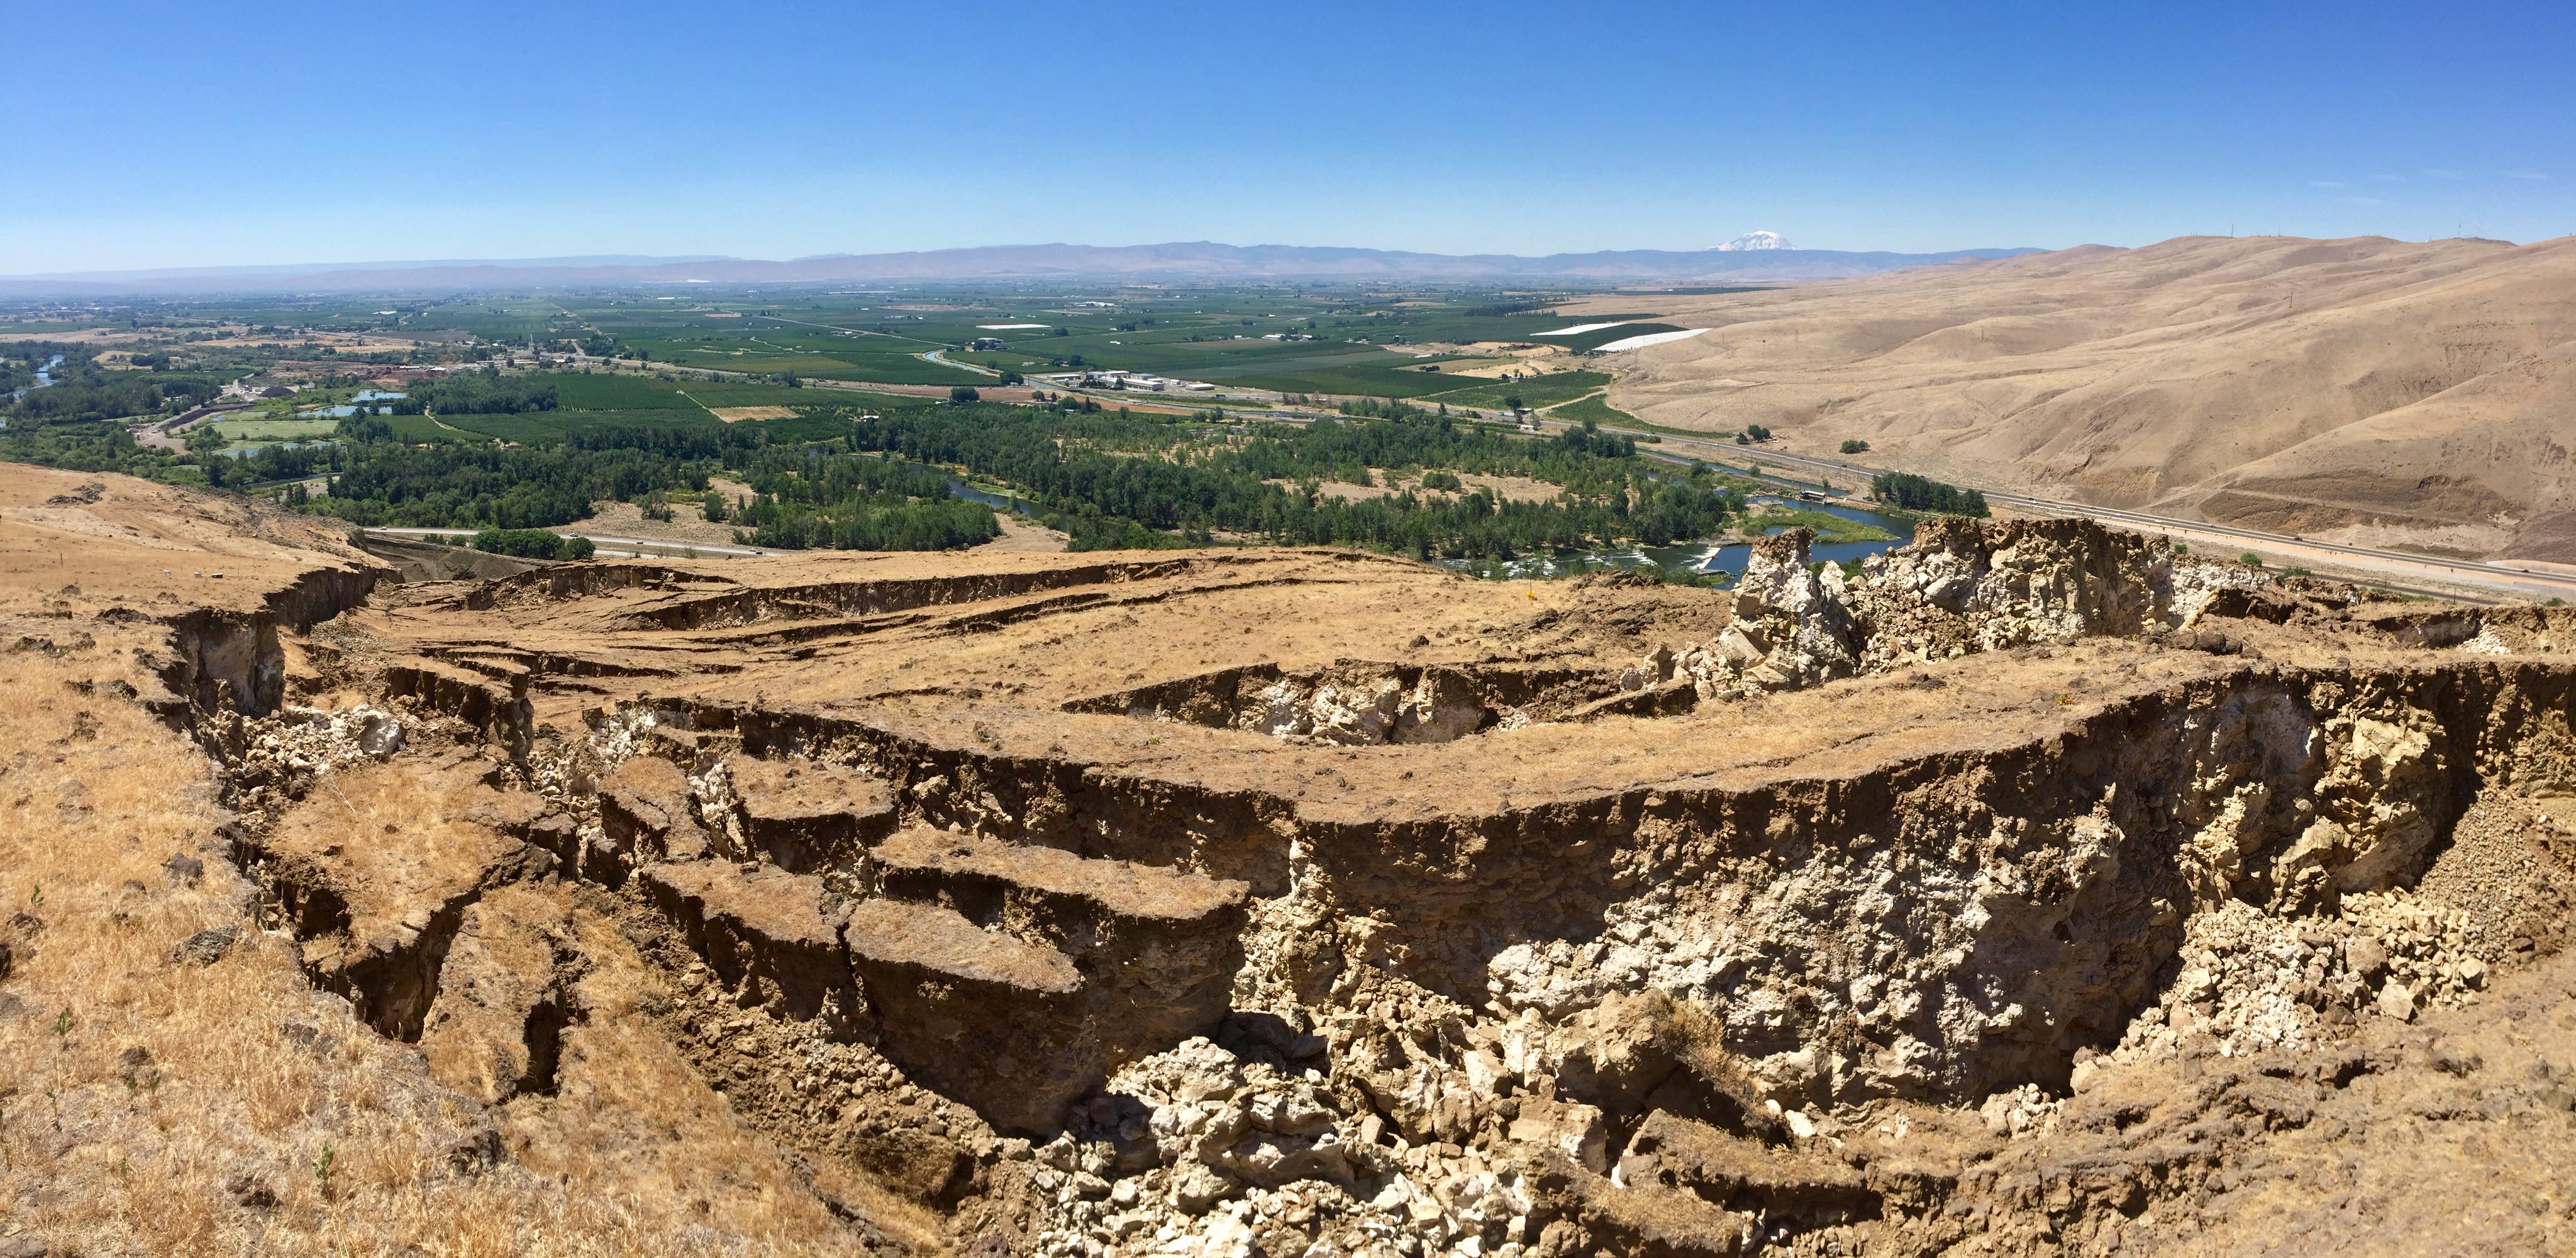
b) We went with another grad student, Alex, all the way into the highlands of Washington to remove geophones that were deployed on top of a rapidly advancing landslide. It only sounds crazy because it absolutely was. The landslide sits right above the town of Yakima and encompasses half of an entire mountain with fissures ranging from a few centimeters to 10 meters deep. Seeing something like this first-hand was pretty incredible, and it was great to do some fieldwork with geophones again.
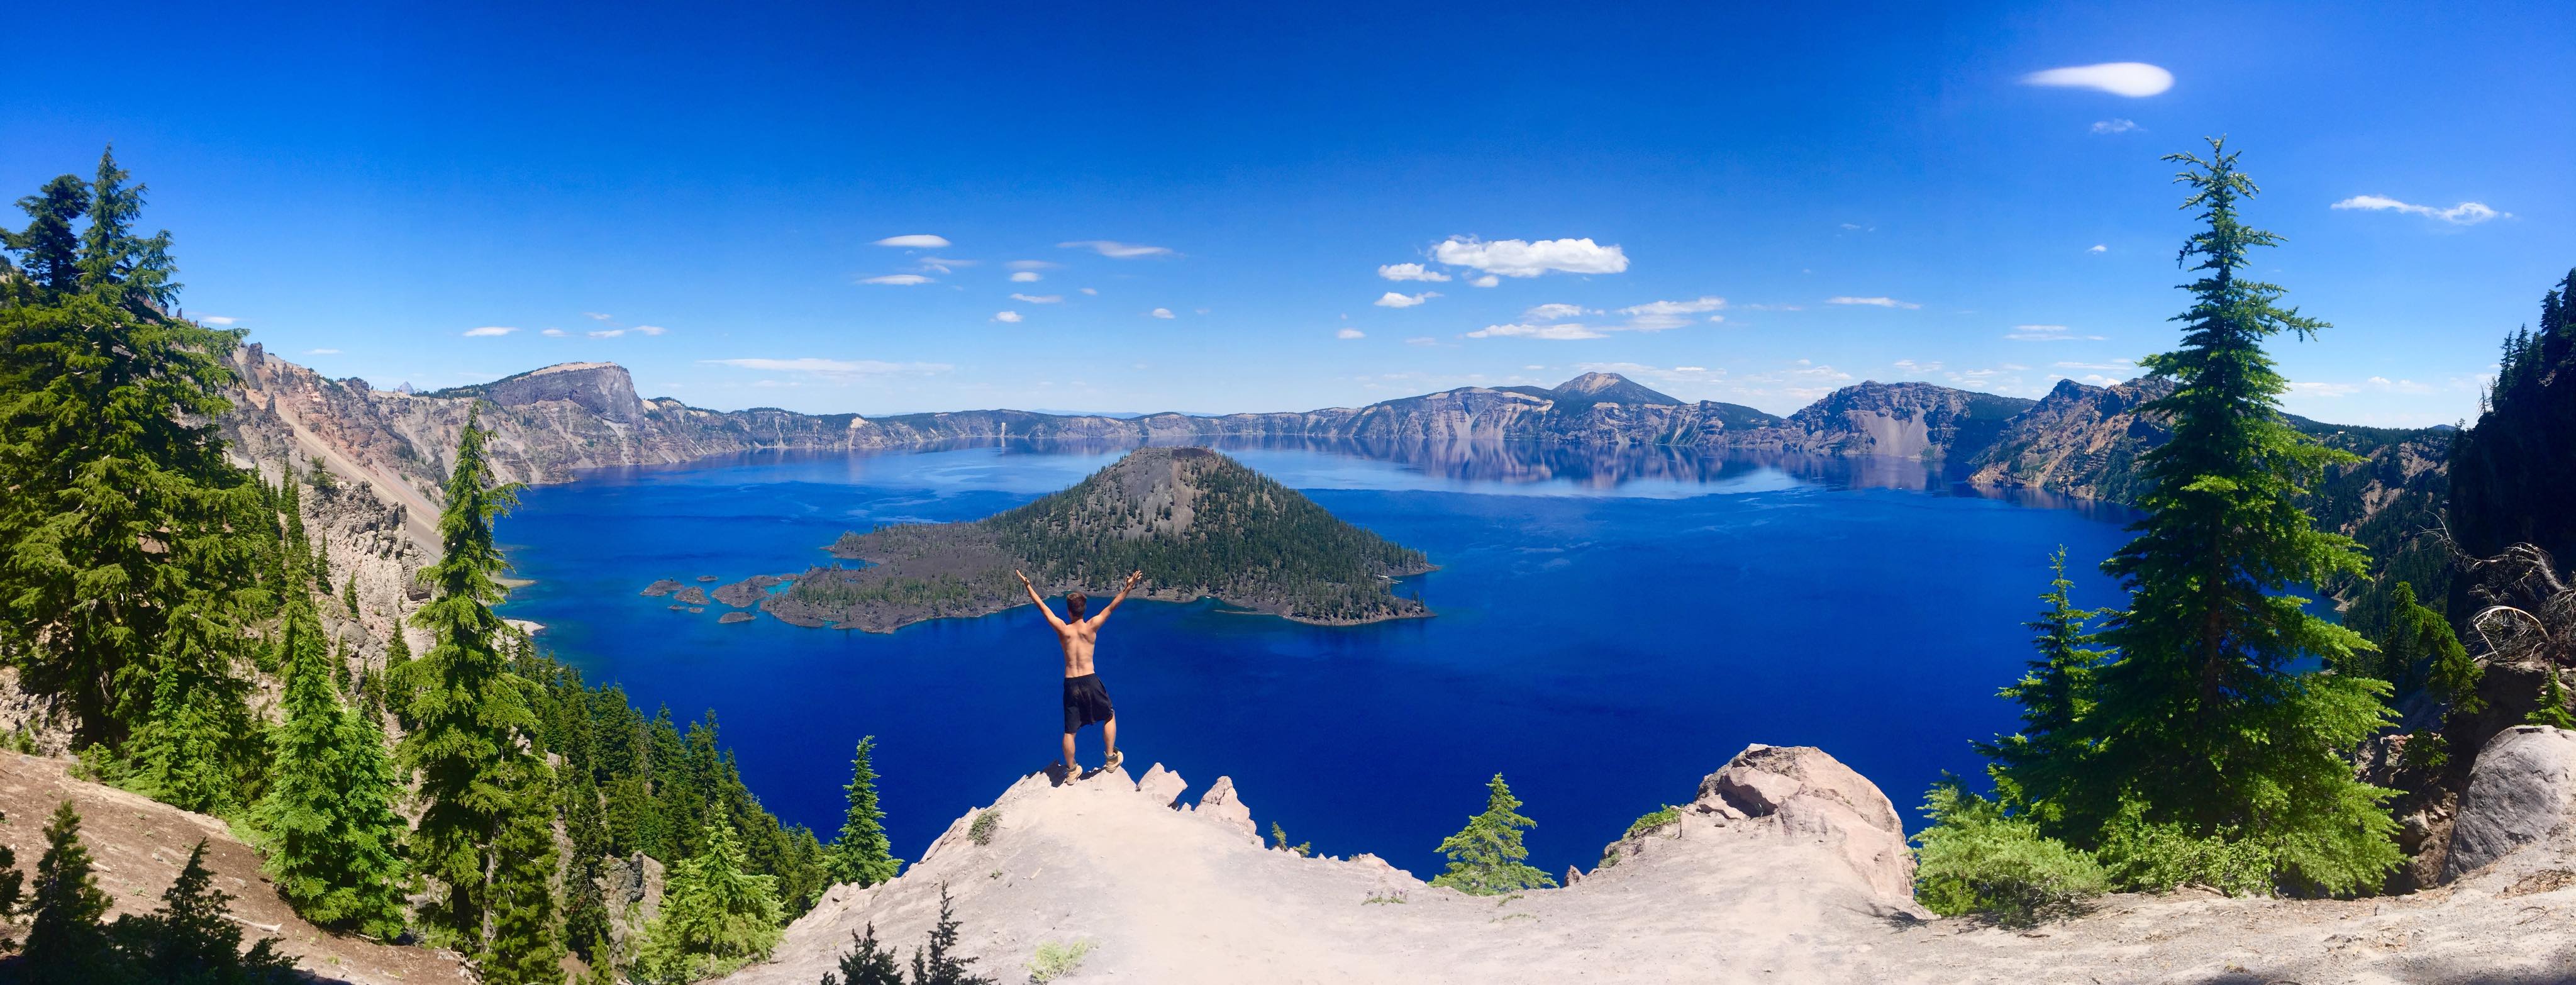
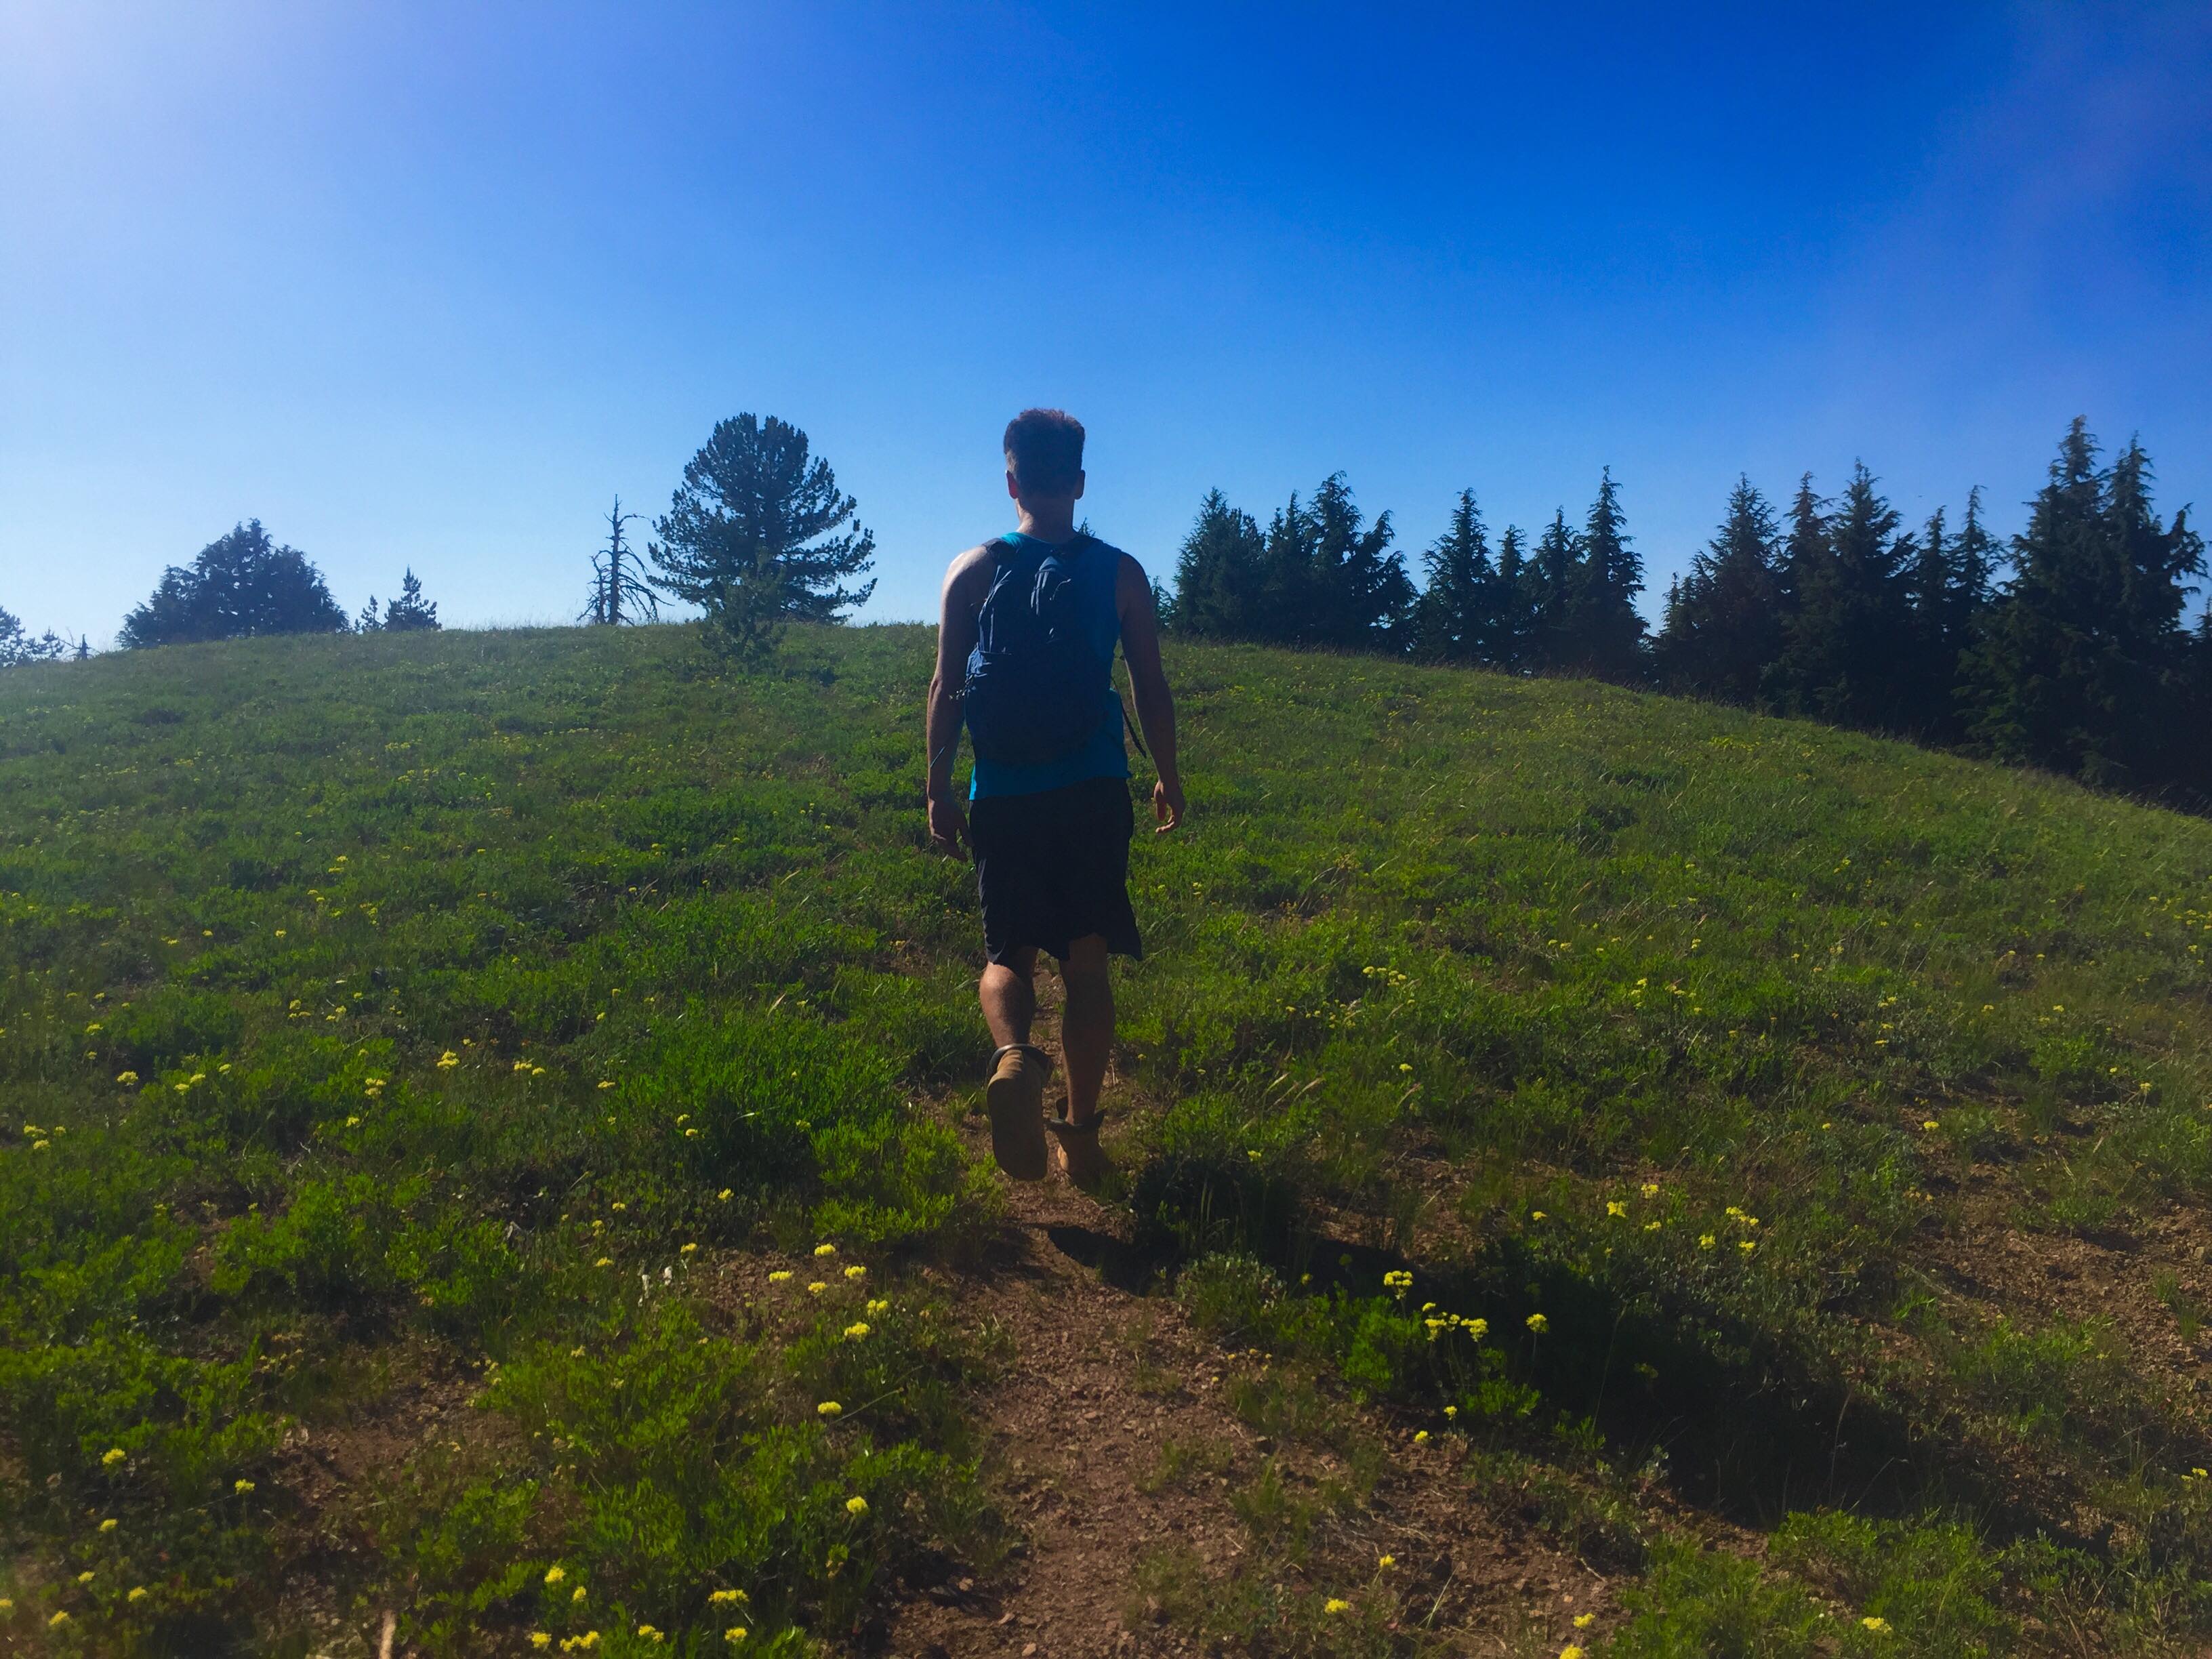
c) Last, but certainly not least, Mariana and I grabbed a rental car and went for an extreme weekend road trip into the wilderness! Between sleeping on the side of the road in our car and walking 27 miles in 2 days, extreme is the only way to describe the time we had. It was definitely intense, but also definitely worth it. I mean, just check out some of these crazy views below:
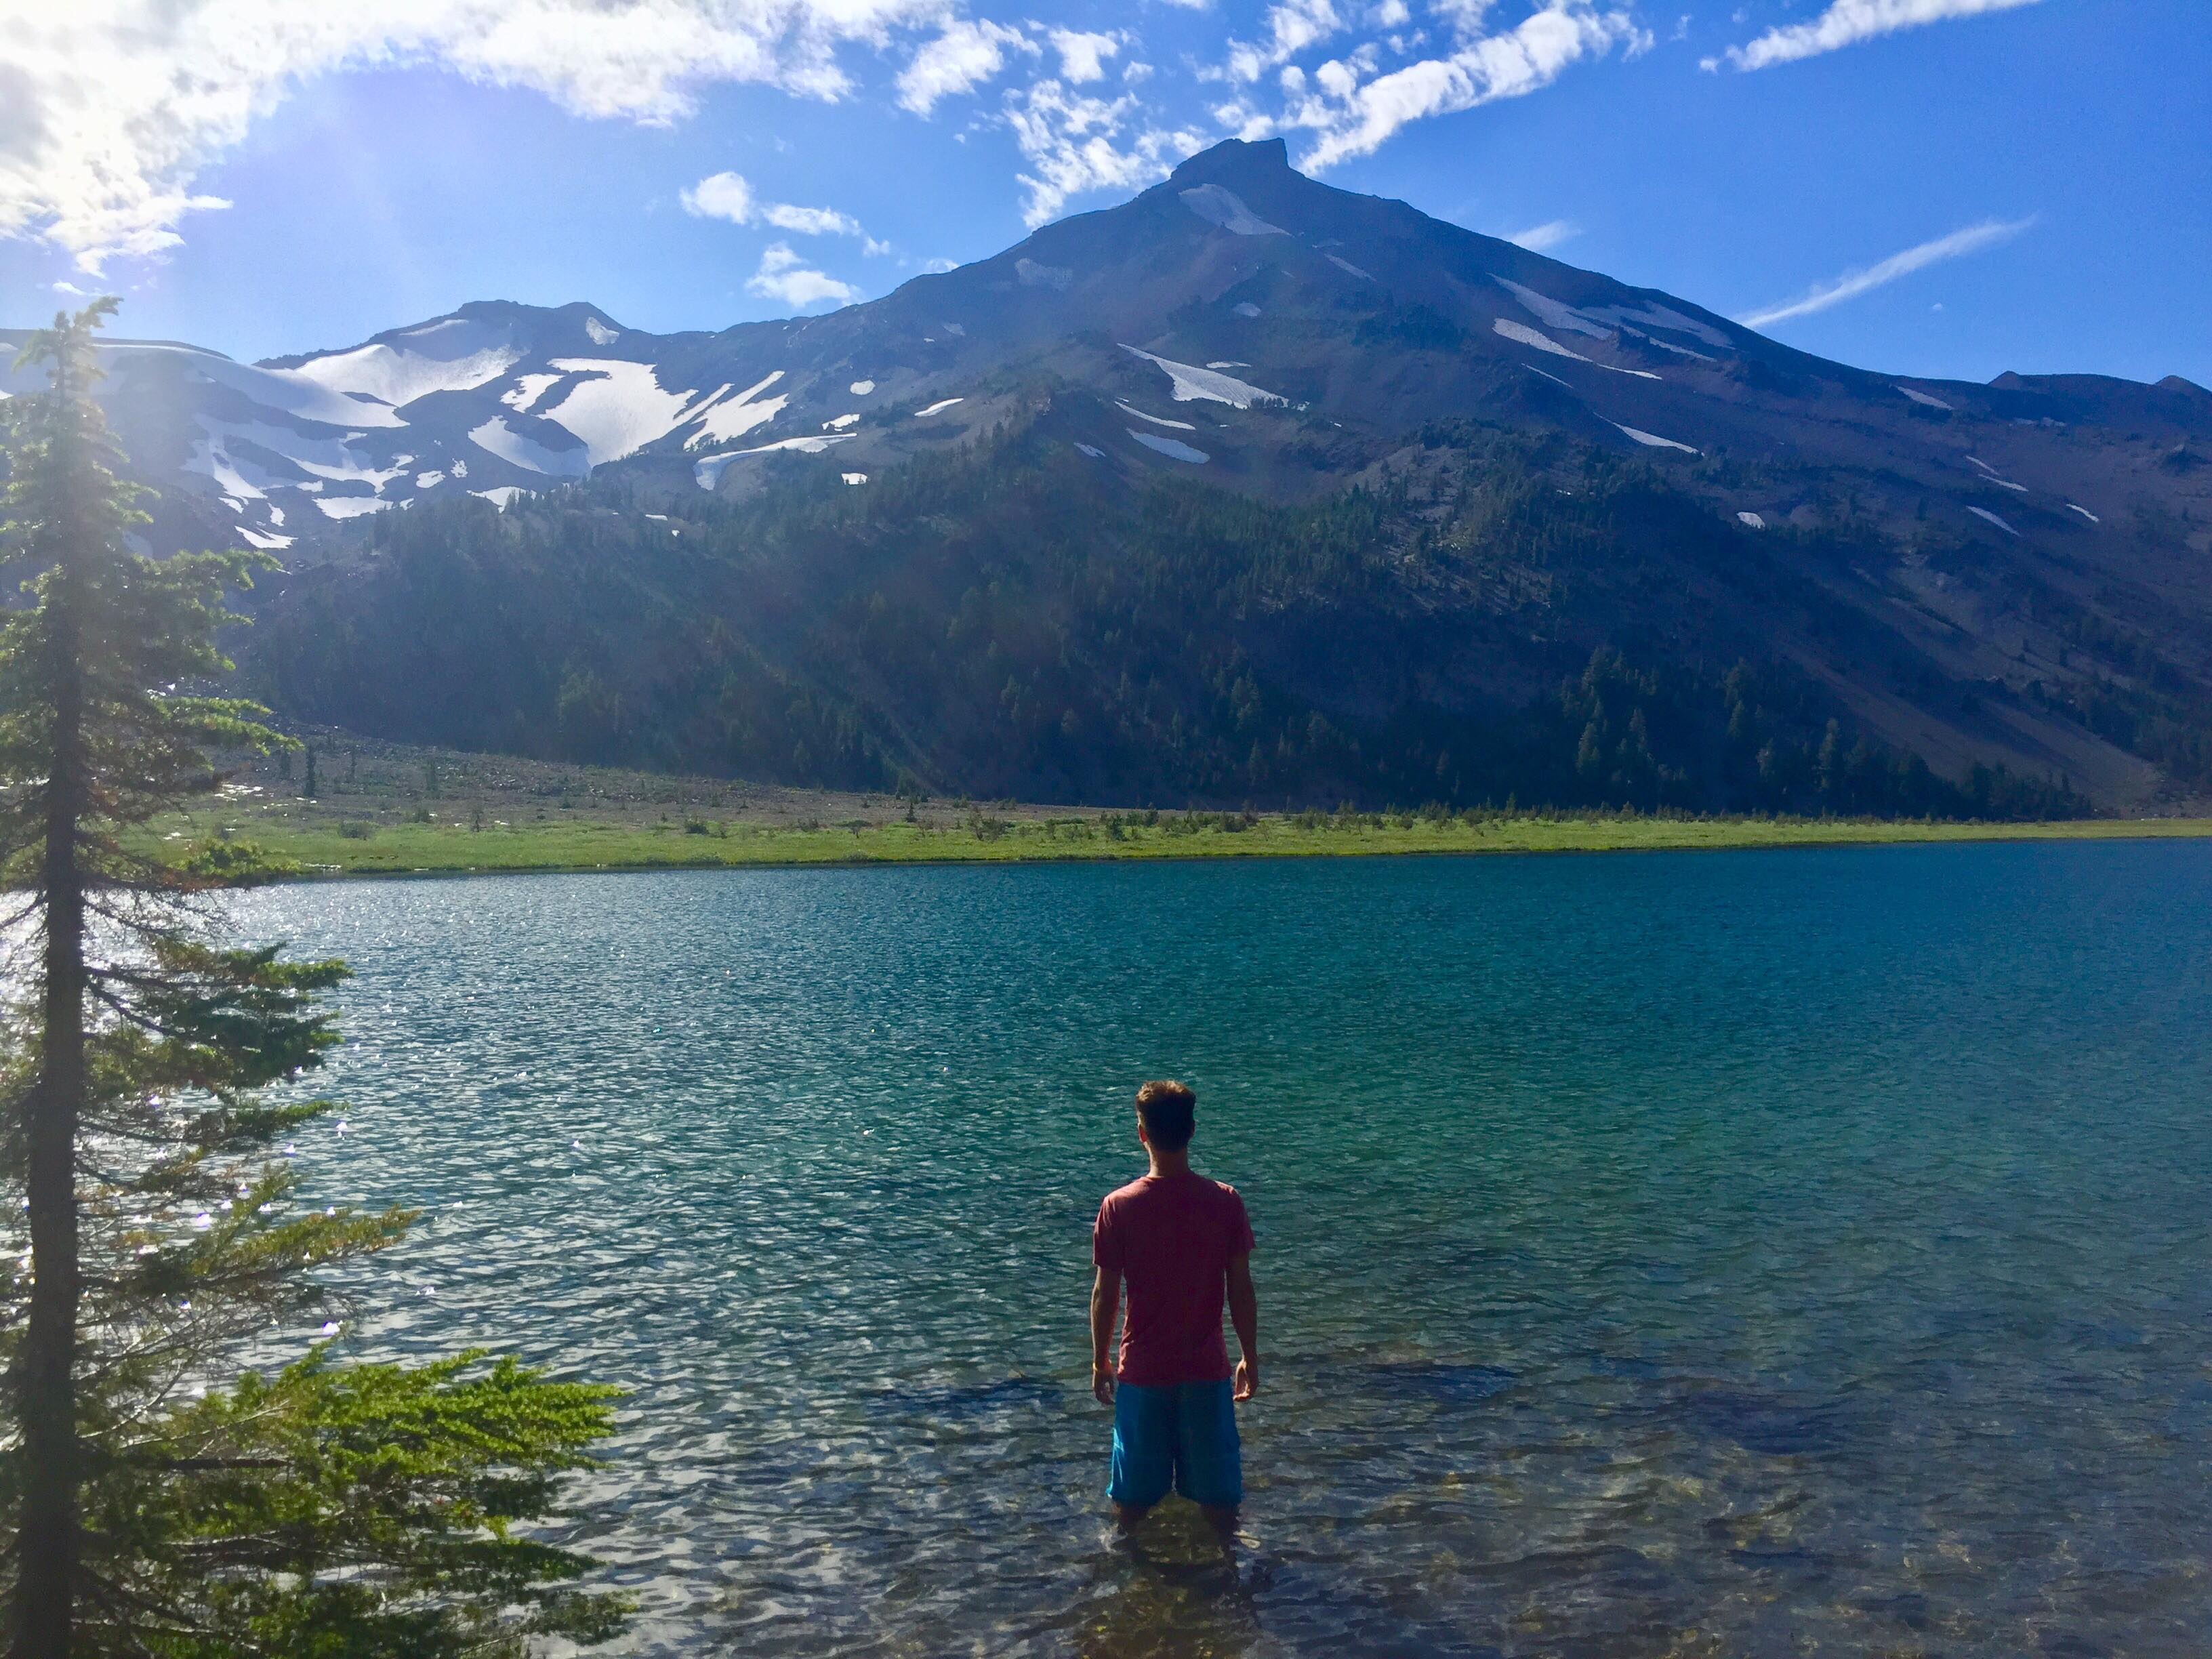

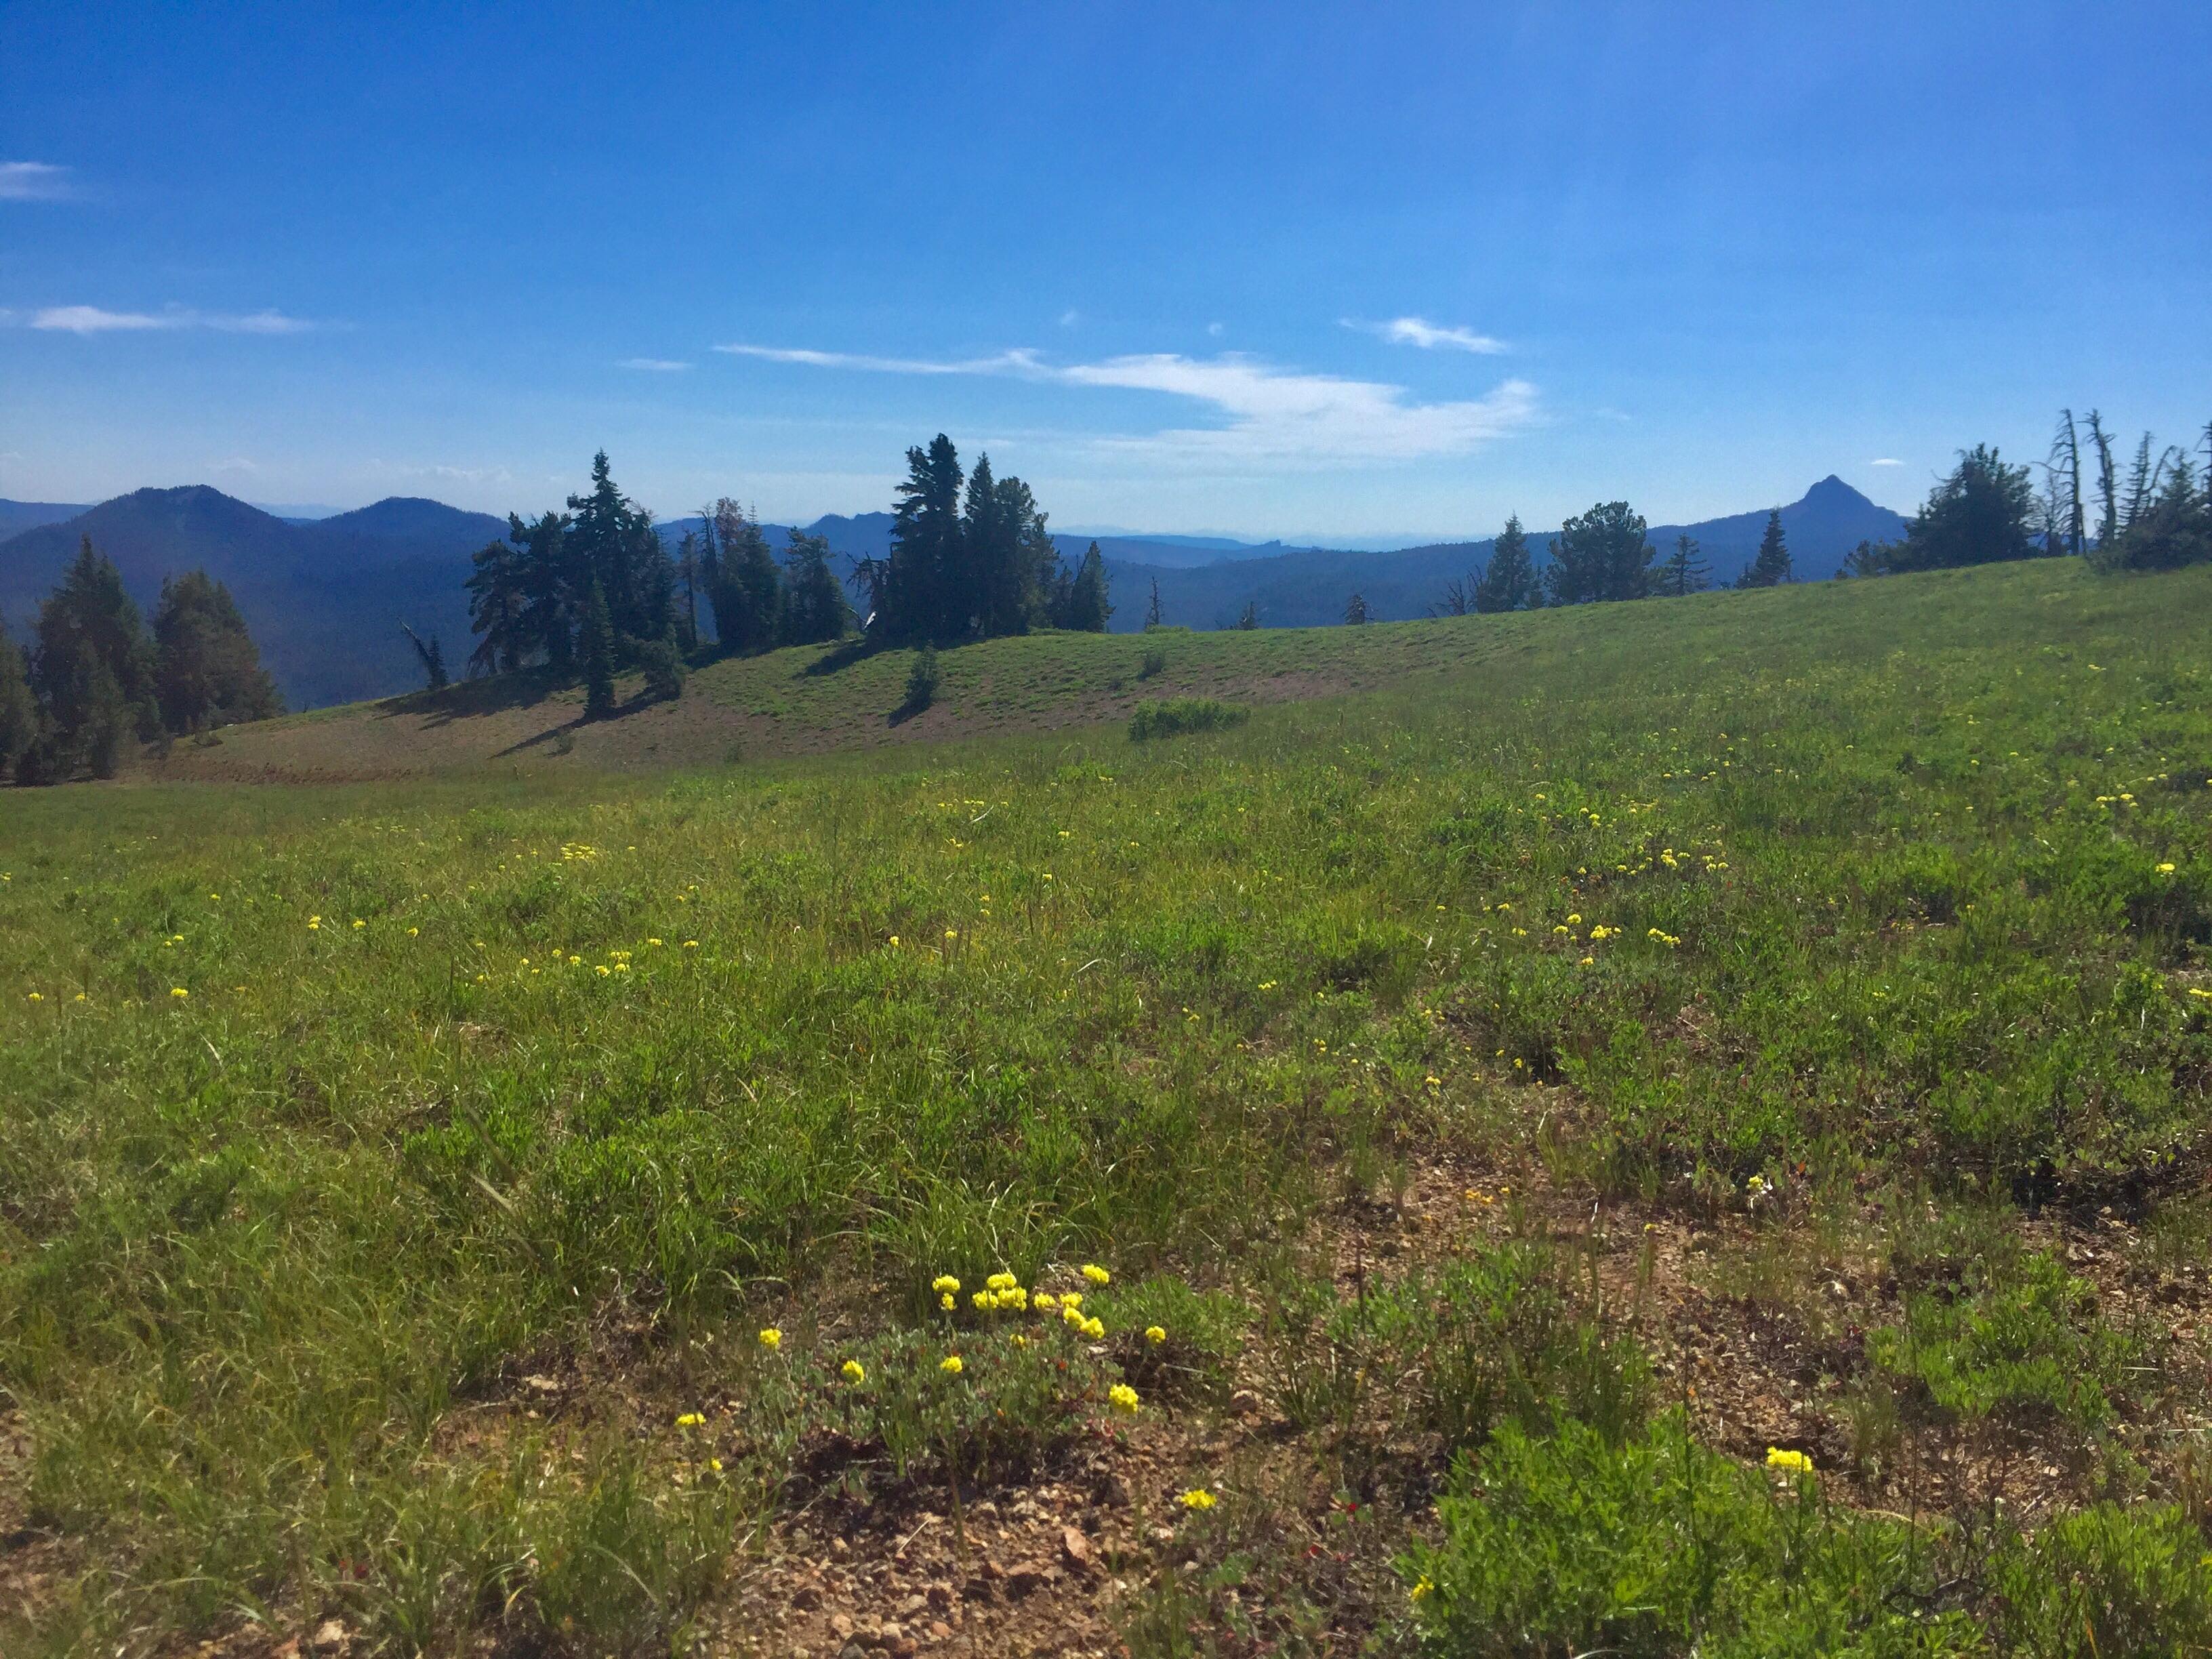
Anyway, that's it for probably the longest blog post of all time. What can I say, I've got a lot to say! If you've made it all the way to the end, then you can leave with the satisfaction of knowing that you're a winner in my books =) . Till next time!
Week 3: I Love Data in the Wrong Format
June 24th, 2018
Nothing better than downloading millions of lines of tidal data only to need to do more pre-processing before the data is in a usable format. The plus side of everything is that, within the span of a week, I managed to master a large variety of skills in Python and create a functional web scraper to pull out the tide data station by station. In addition, I wrote another script to compile all of the data (which could only be pulled in 31 day intervals across different year spans) for each individual station to create a complete record, which was actually more difficult to create than the web scraper. Now, with all that completed, the datasets per station need to be converted from CSV to Miniseed Format in order to be usable by yet another script, which will run a series of tidal corrections and filters on the data. Hopefully, within the next couple of days, the team here can crush through this data and start doing some real science with it! I'm pumped to see the progress that we'll make this week and, with luck, we'll have something interesting to report next week!
Week 2: Data, Data, & More Data
June 18th, 2018
The past week or so has been nothing short of a blur. Essentially, the two datasets I'm working with are from NOAA (for the US Tide Gauges) and Fisheries and Oceans Canada (for the Canadian Tide Gauges). The range of the tide gauges extends all the way from Northern California to Central British Columbia with dates extending all the way back to ~1900 for some select stations. In order to achieve the project goals we're aiming for, it was necessary to manually log the various parameters (station numbers, dates, type of measurement, lat/long, etc.) of these stations, which unfortunately amounted to a matrix possessing over 2000 rows. The logging took quite a few days, but was crucial such that I could write a web crawler script in Python to use the matrix information to pull all of the data from the web. This script is what I am currently in the process of working on and, although there are many obstacles to overcome within this script, I'm quickly adapting to the "grad student lifestyle" of learning everything rapidly on the fly. In fact, I think that this practical approach is a much more effective way to learn a programming language (if you have background in other languages) than learning it in a classroom. Within only a few days, I feel that programming in Python has become almost second nature using the experience I have in MATLAB & Java. Hopefully, this trend will continue and I'll have all the data downloaded and ready for analysis by the end of the week!
In other news, Oregon more than lives up to its name in terms of natural beauty and scenery. Thus far, I've found natural hot springs in the mountains, visited a national park with 11 huge waterfalls, tubed down a river, and explored the local areas around Eugene (where I'm staying). However, every person I meet tells me 10 new things I have to do while I'm here in Oregon, so I've got quite a lot to see in my time here. I can't wait to get out more and explore the other regions of this awesome state!
(A few) Orientation & Oregon Pictures
June 18th, 2018
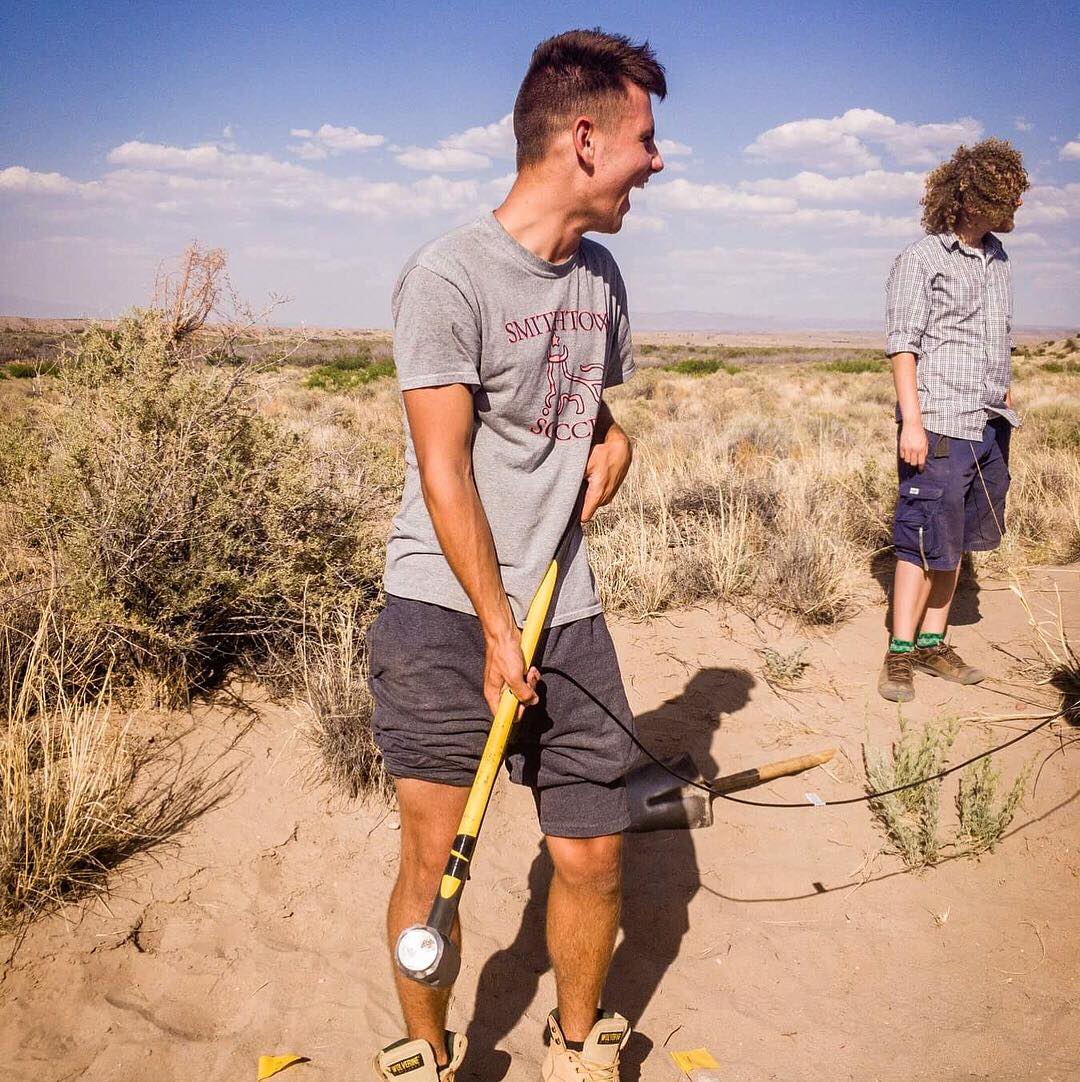
 1) Hammerin' some metal for a seismic array experiment in New Mexico 2) San Lorenzo Canyon
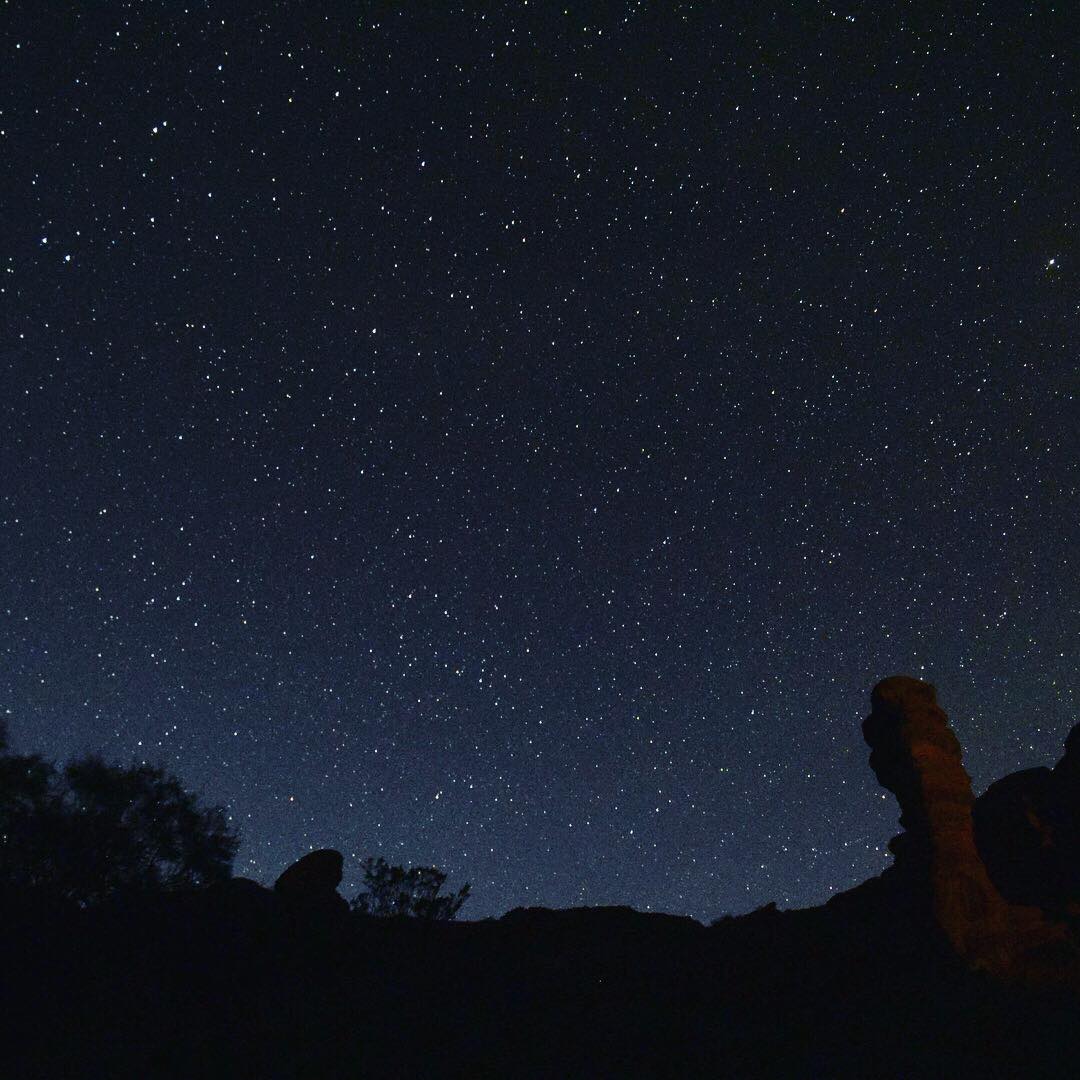
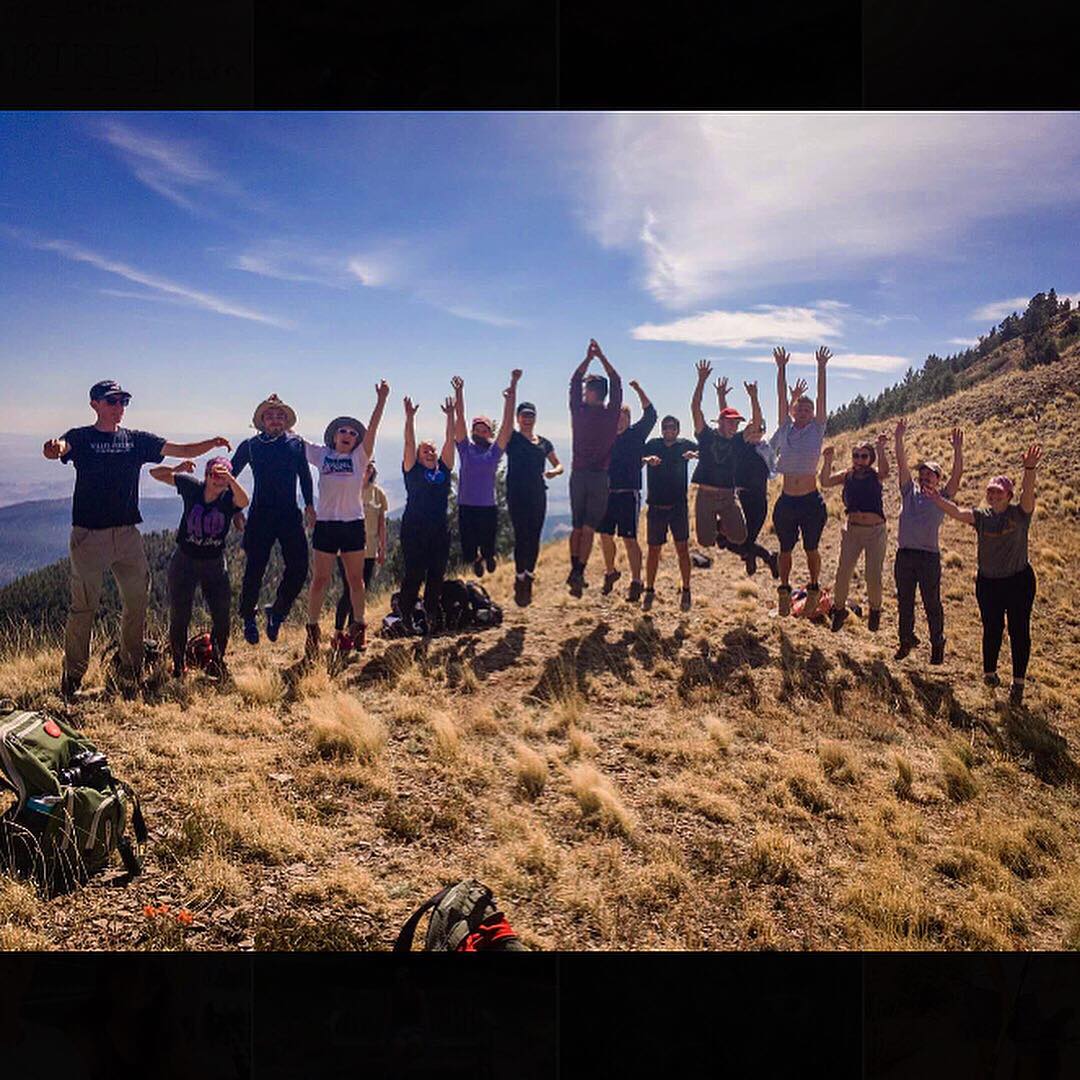 3) San Lorenzo Canyon 4) Group shot in the Quebradas Mountains (NM)
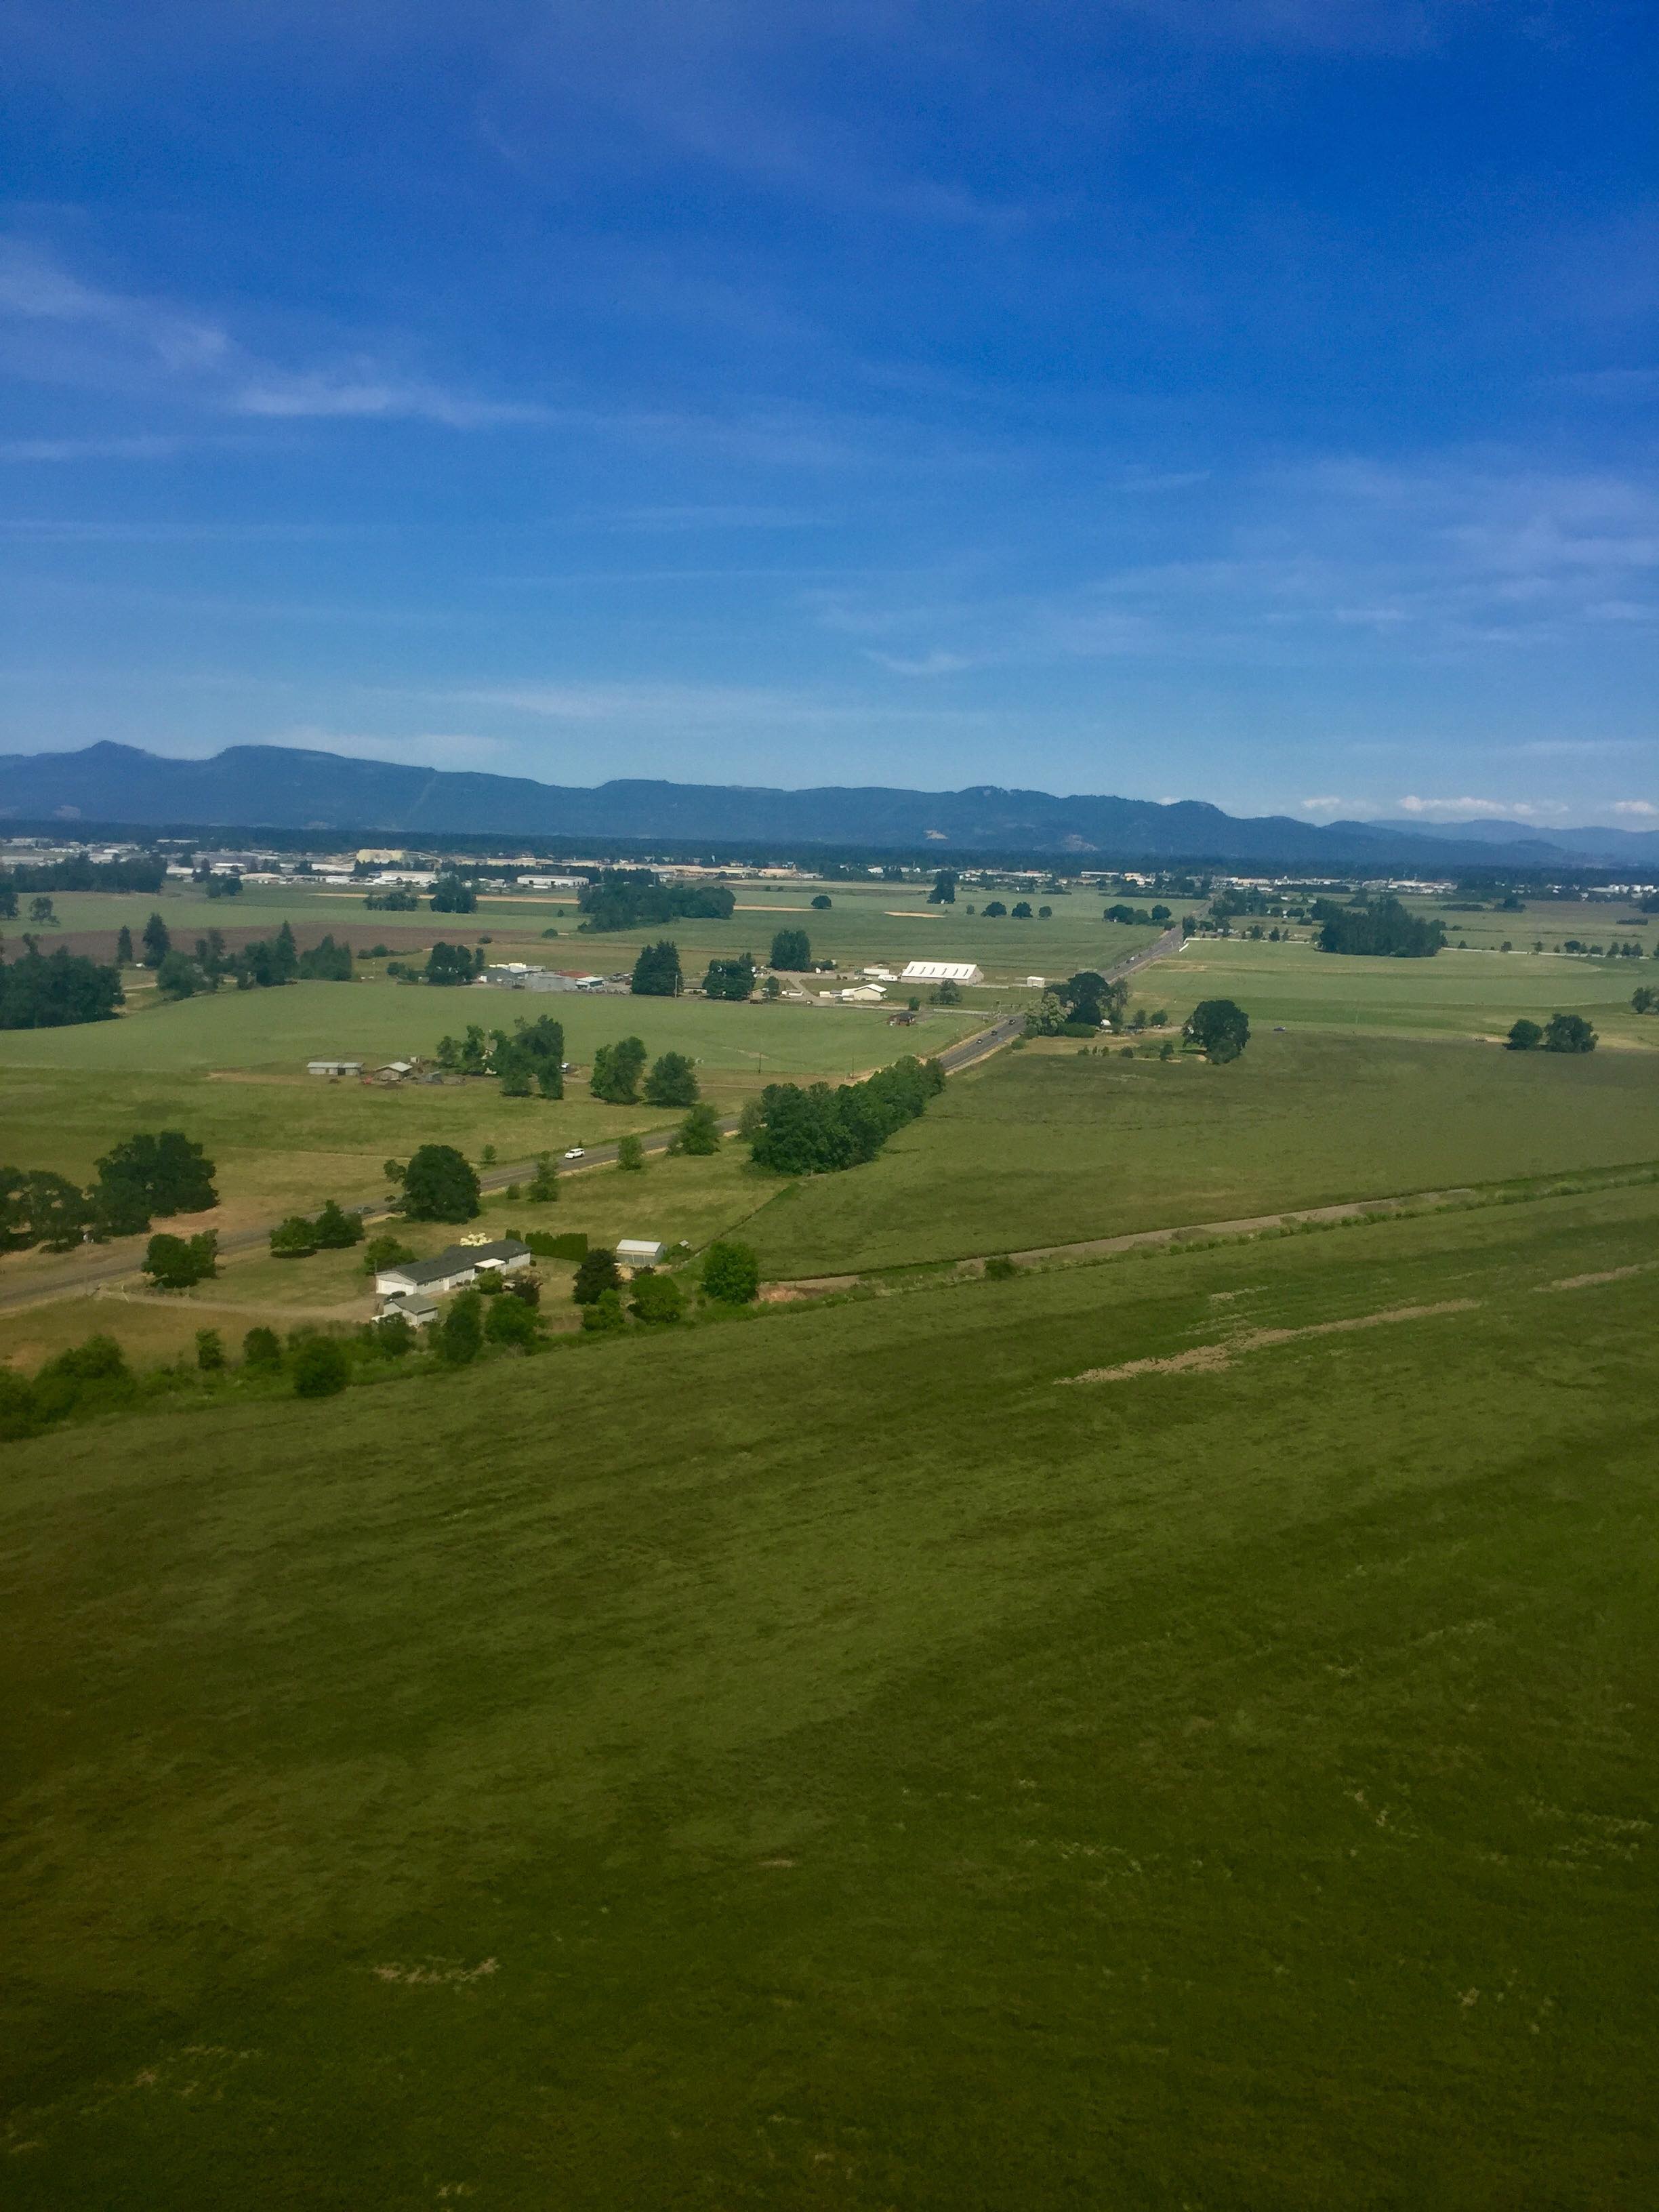
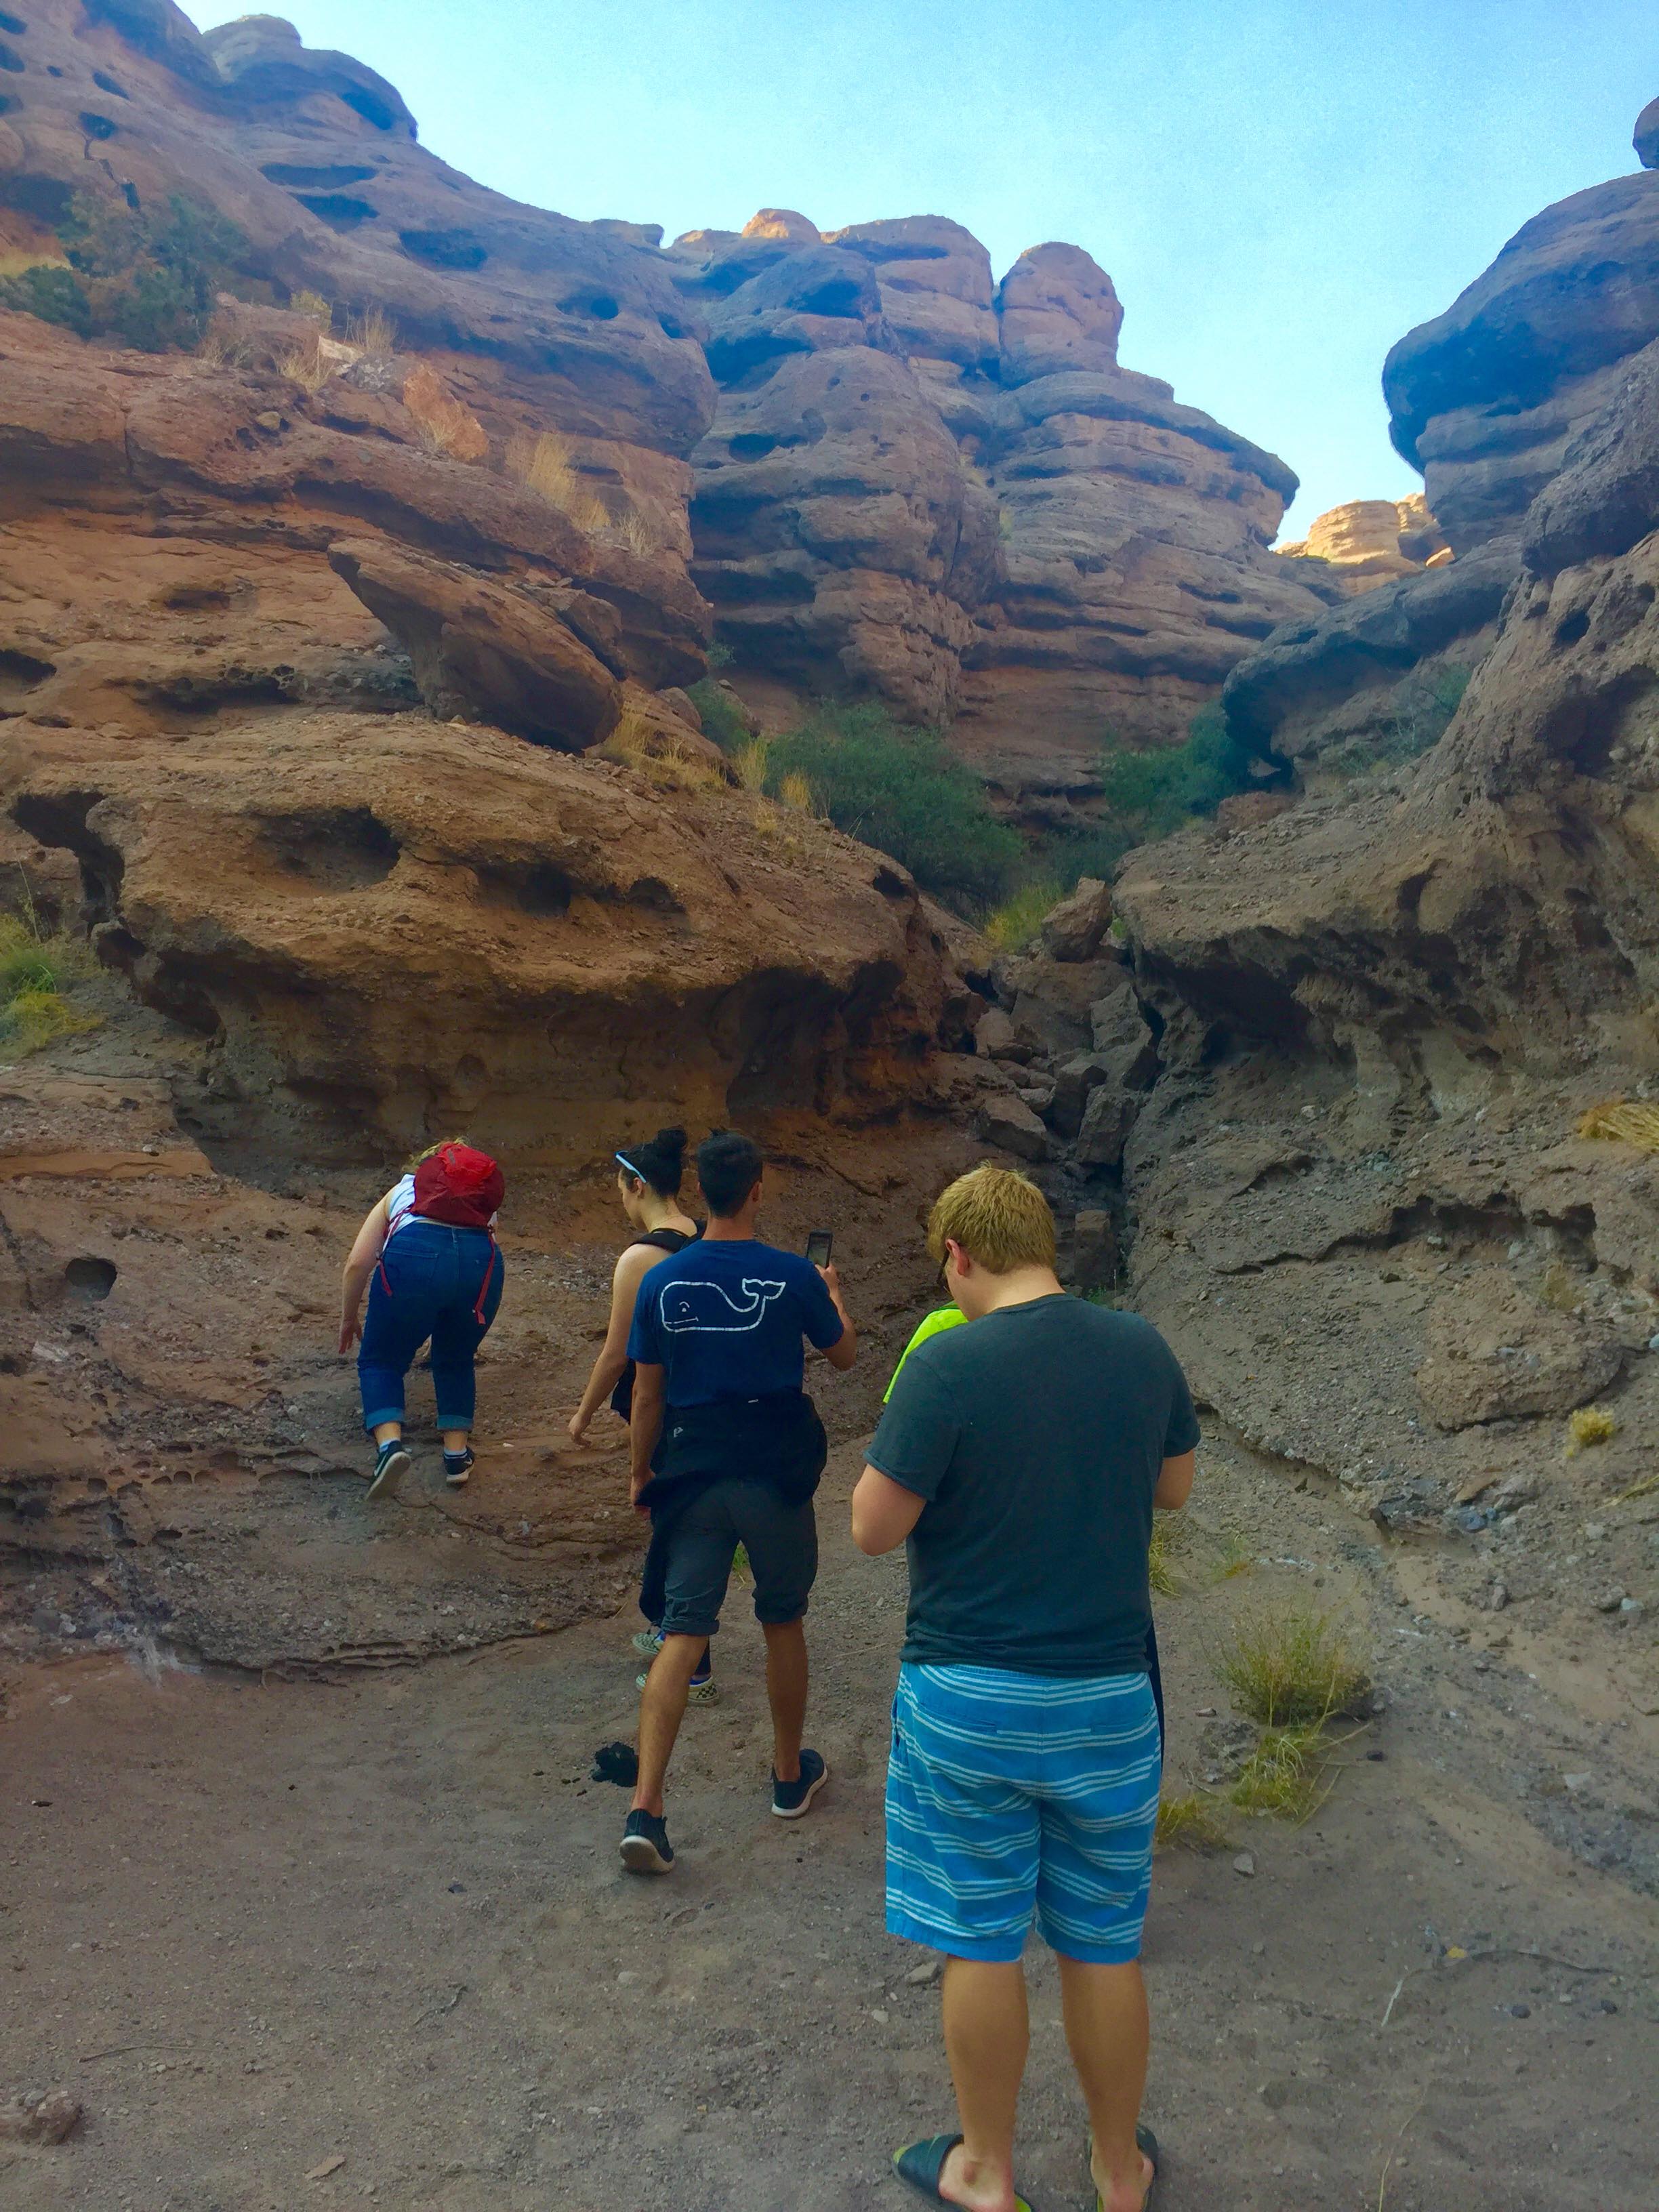 5) Plane shot flying in through the outskirts of Eugene, OR 6) More Socorro Canyon
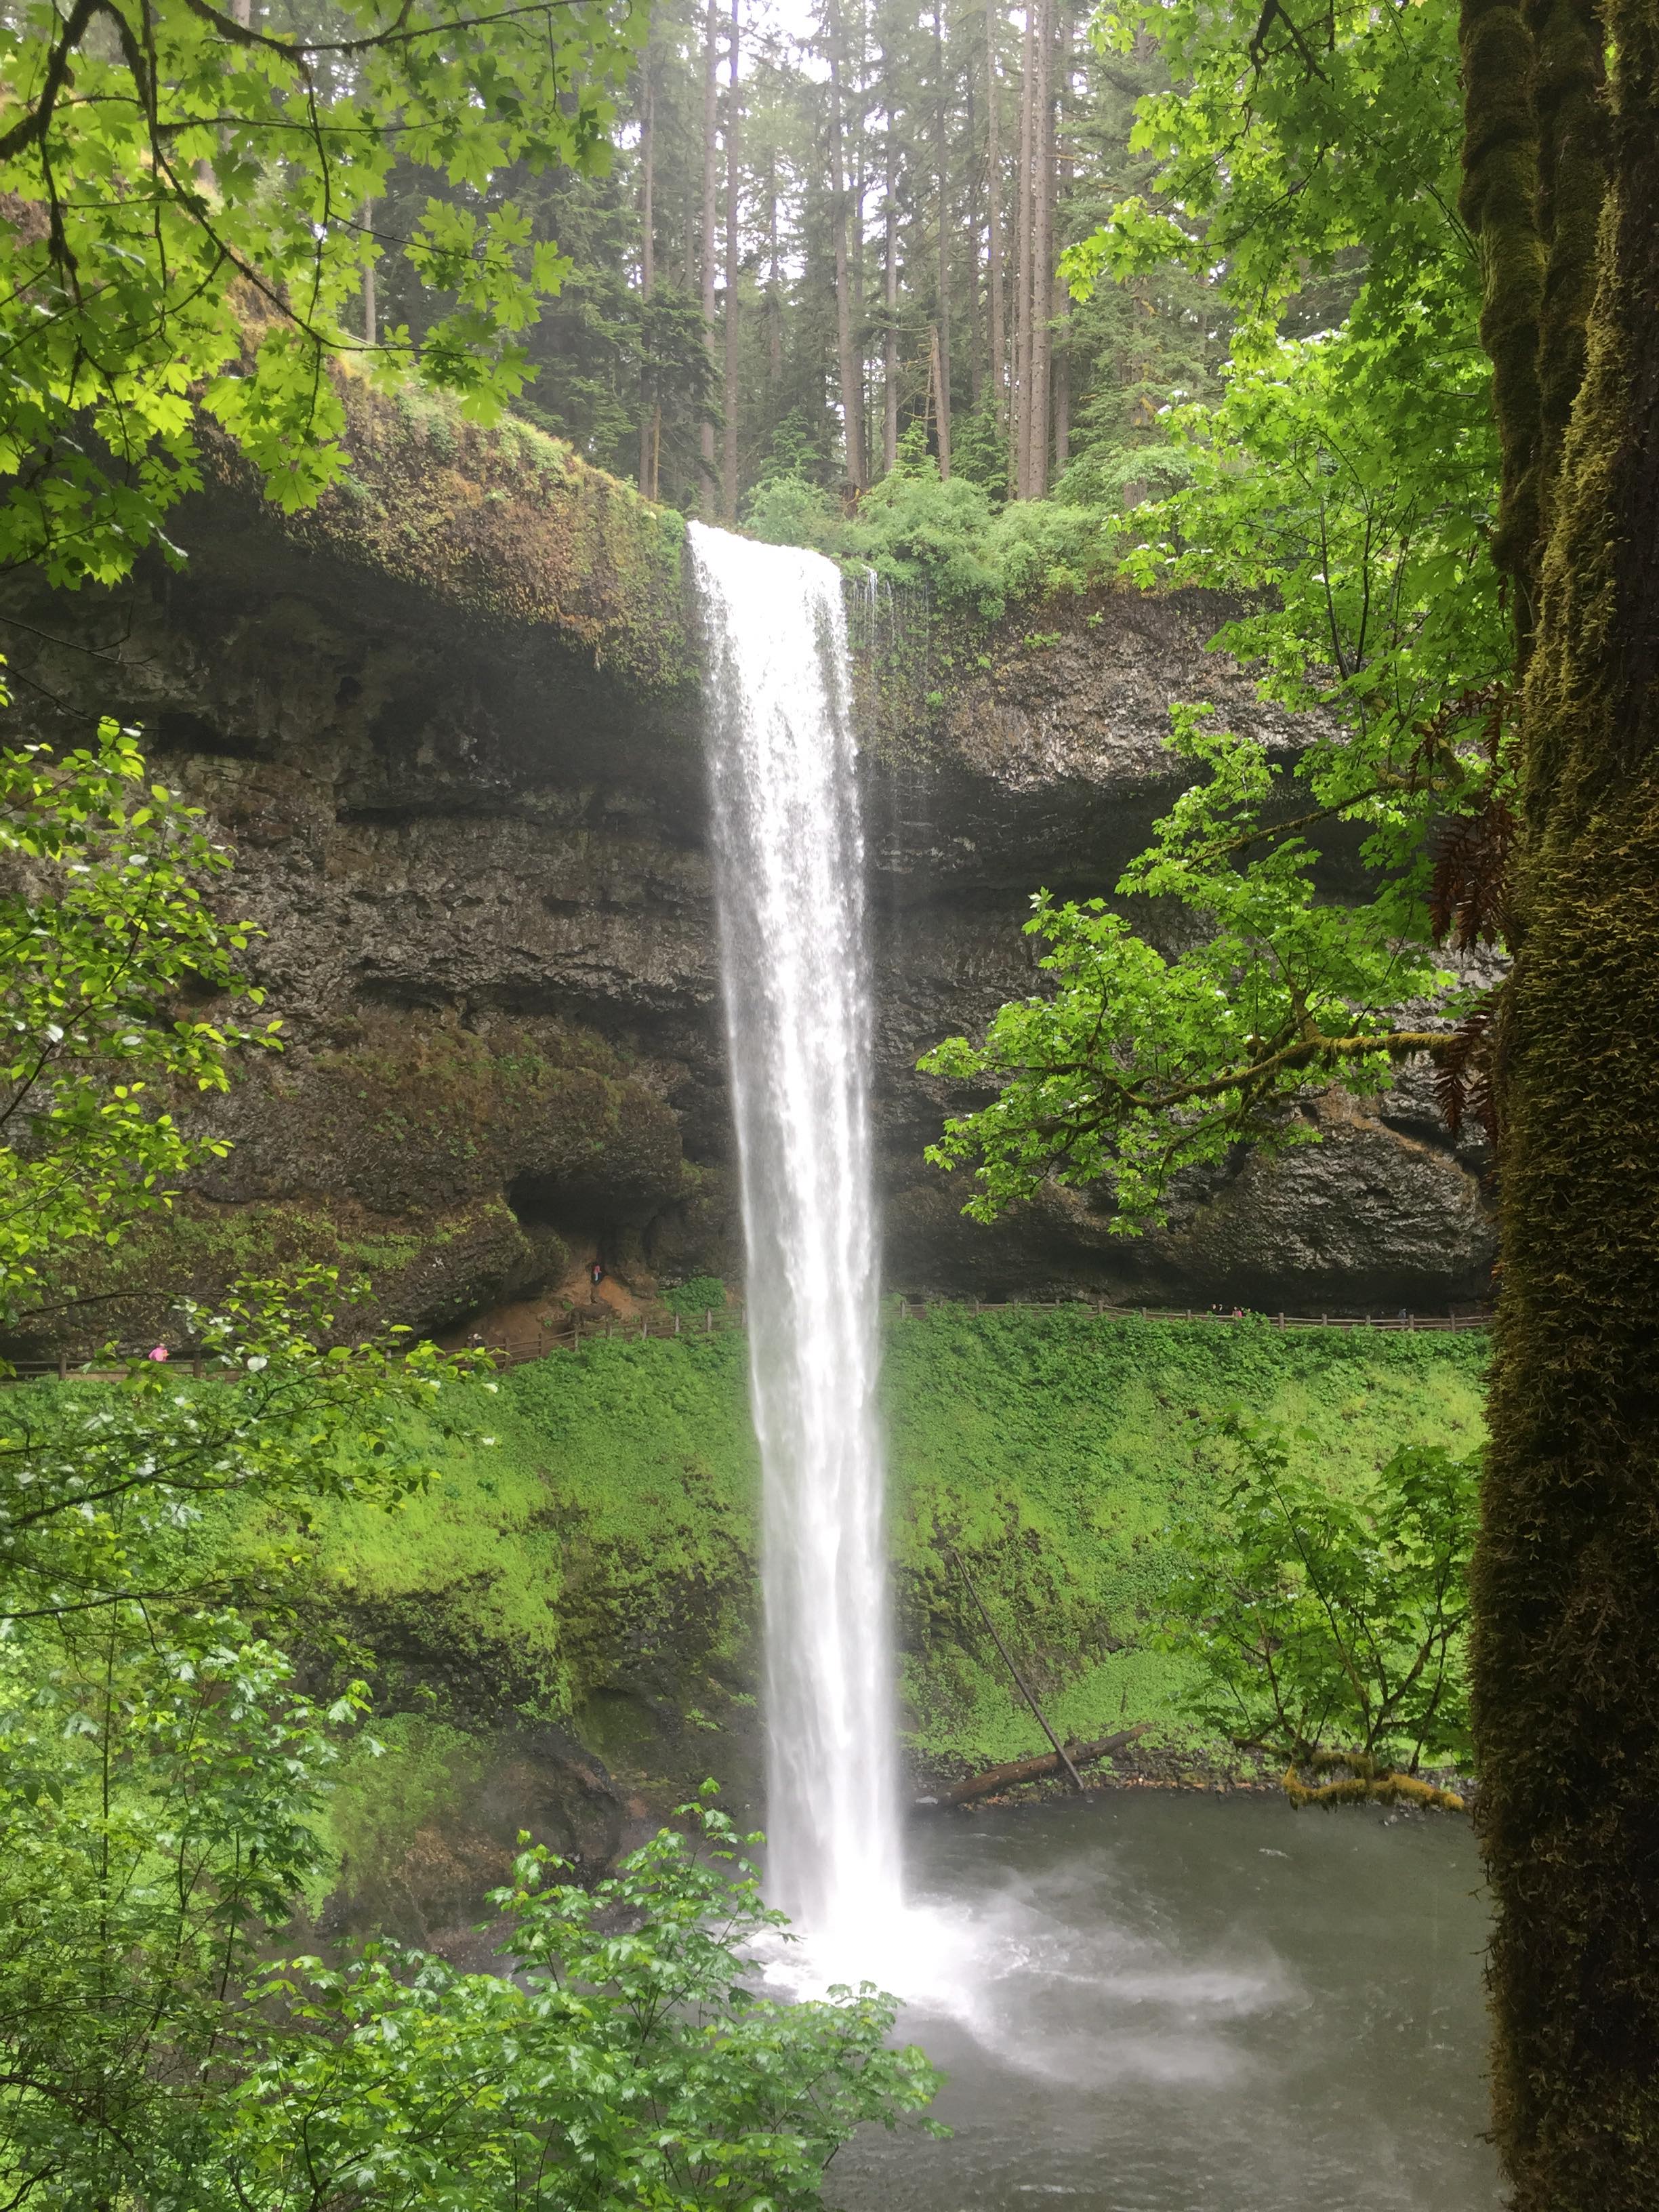
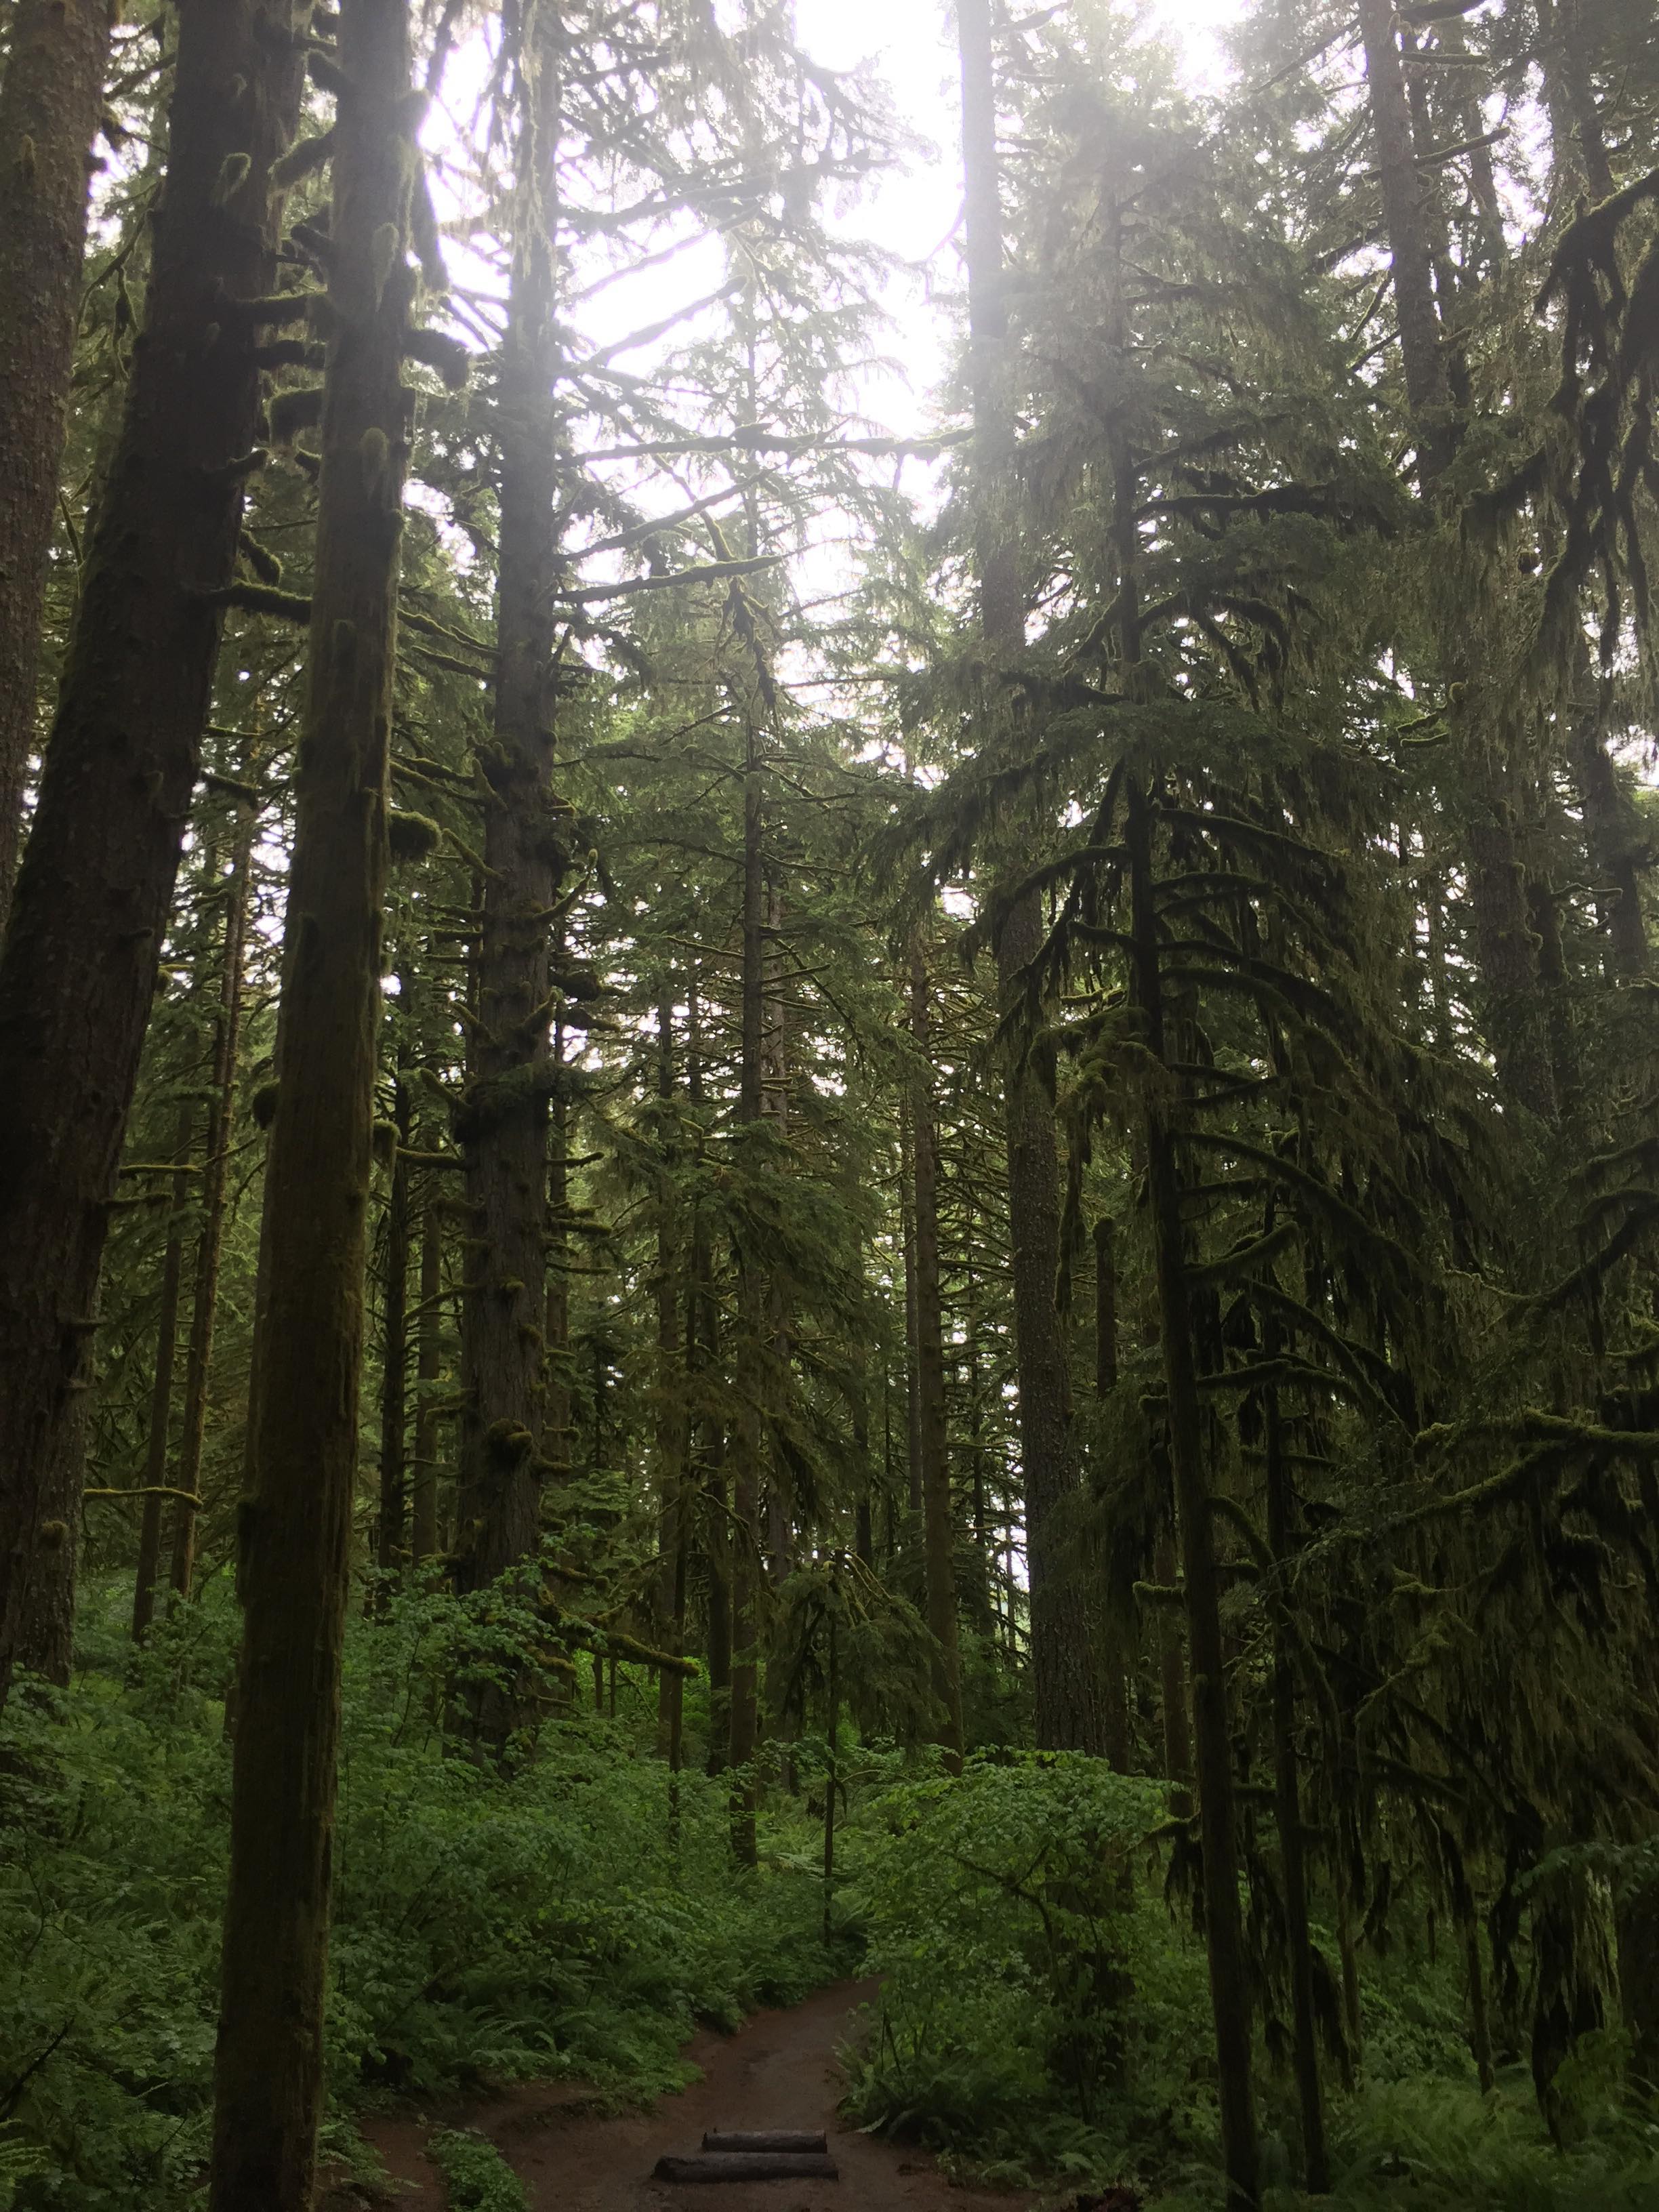 7 & 8) Temperate Rainforest in Silver Falls National Park, OR
Orientation & First Week on the Job!
June 8th, 2018
Wow, what an amazing two weeks it has been! From the geophysical orientation at New Mexico Tech to arriving here and working at the University of Oregon, so much has happened in such a short amount of time, but I couldn't be more thrilled about it.
To begin with the orientation week, I personally feel that it was one of the best weeks I've ever had. I don't know if I've ever connected so strongly with a group of people so quickly, to the point where it was extremely difficult for all of us to say goodbye after only knowing each other for less than 6 days. It was to the point where all of us, even after working together from 8 AM to 10 PM, were all willing to stay up past midnight hanging out and running around the fields just to be together even longer. Working with others who possessed such a caliber of intellect, passion, and drive was such a pleasure and a great way to start an internship. It made every assignment we completed together thoroughly enjoyable and an even greater learning experience, where we could benefit from each others' varied backgrounds and strengths in deploying broadband seismometers & geophones, programming in UNIX & Matlab, etc. I can't wait for all of us to reconvene in December at the American Geophysical Union when we're all official experts on our respective topics. =)
After leaving New Mexico, Mariana and I arrived (separately) to Eugene, Oregon to begin our research experience. One of the biggest shocks of my life occurred when I walked into the apartment I was leasing for the summer and found Mariana inside. After all the complaining about how much trouble we each were having with our leases, and the irony we found in which we were having the same exact problems, we never put it together (until we both stumbled into the same apartment) that we would be living together for the summer! Thus far, we've been having an incredible time and can't wait to explore the Pacific Northwest together.
In terms of research, it's fantastic to finally have the opportunity to take knowledge I've acquired in school and apply it to a scientific project with real-world implications. The project that the group I am a part of is undertaking is using tide gauges as a tool to measure geodetic deformation from slow-slip earthquakes in the cascadian subduction zone. In simpler terms, in certain tectonic settings (such as that of the cascadian subduction zone), we have a phenomena known as slow-slip earthquakes. These quakes, rather than the well-known earthquakes which release a massive amount of energy in a matter of seconds, occur over the course of weeks and are undetectable by seismometers due to how slowly the energy (and deformation) is released. These slow-slip quakes have been detected in the recent decades by GPS measurements, which measure how much the ground is moving (deforming) due to this phenomena. However, GPS only goes back so many years. If we want to measure slow-slip events deeper into the past, we would need instrumentation that has existed well before GPS. This is where tide gauges come in. Tide guages provide a measure of the height of the ocean at a given point in addition to other information. If we can remove other signals and noise from the tide gauges (i.e. the up and down motion of the tides, sea level rise, phase arrivals due to atmospheric and hydrological phenomena, etc.), then we should be able to isolate the signal of the slow-slip quakes in the records.
This research is both interesting and impactful from different standpoints. What is interesting is that, by doing this, we may be able to observe a periodicity in the supposed slow-slip quake cycle and see if there is significant change in this cycle over time. How this cycle and periodicity is evolving over time could have further implications for what the cascadian subduction zone is doing and if it is likely to have the next great earthquake in the near future. The impact of this research is that, by understanding the slow-slip cycle through time, this may lend insight to earthquake prediction in the Pacific Northwest, thereby helping people prepare for a hazardous event.
So far this week, I've processed data in almost 200 tide gauges across Oregon & Washington, which have measurements ranging back to the early 1900's. While learning Python, UNIX, and GMT on the side, I am gearing up to dive into this data and see if we can uncover some notable results in the next coming weeks. Stay tuned!!


