Will
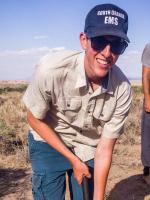
Will is a student at Binghamton University currently completing his research at Scripps Institute of Oceanography under Dr. Gabi Laske.
My research project focuses on using surface waves to image anomalies in the lithosphere with data from the USArray Transportable seismic network. To do this I will be investigating frequency-dependent arrival angles. An anomaly will cause the waves to bend away from the source-receiver great circle path. First the deformation will be measured and then validated using synthetic seismograms in a 3-dimensional Earth model. The difference between real observations and synthetics will be used to further refine the Earth model.
Two Weeks Left
August 14th, 2018
This summer has gone by so fast, but at the same time I have accomplished more than I thought I would. When I first started this project, I excepted to complete all the Rayleigh wave arrival measurements, compare the results of difference users, look into the differences with the results from DLOPy (the automatic method) and compare these to synthetics. So far, I have done all of this, path integration approximations through various phase velocity maps and I have started looking at Love waves.
The results from the comparisons have been mixed. For both the manual method there were some events where they did not work well. When both methods yielded good results, the data correlated well. An example of this is show in figure 1. The measurements have a correlation of 0.82 and a variance reduction of about 61%. Figure 2 shows one of the interesting results from path integration approximations. I found the amplitudes of the measured angles to be far greater than those from the synthetic seismograms. The difference is so dramatic that the scale is changed from -20 to 20 to -10 to 10, to make is easy to see the patterns. This is likely due to the lack of small scale heterogeneities in the Earth model used for to create this synthetic seismogram.

Figure 1. Left) The manual Rayleigh wave arrival angle measurements at 15 mHz. Center) Rayleigh wave measurements made by DLOPy at 15 mHz. Right) A correlation plot of the results from both methods. Only the manual measurements have error bars as the DLOPy method does not return them.
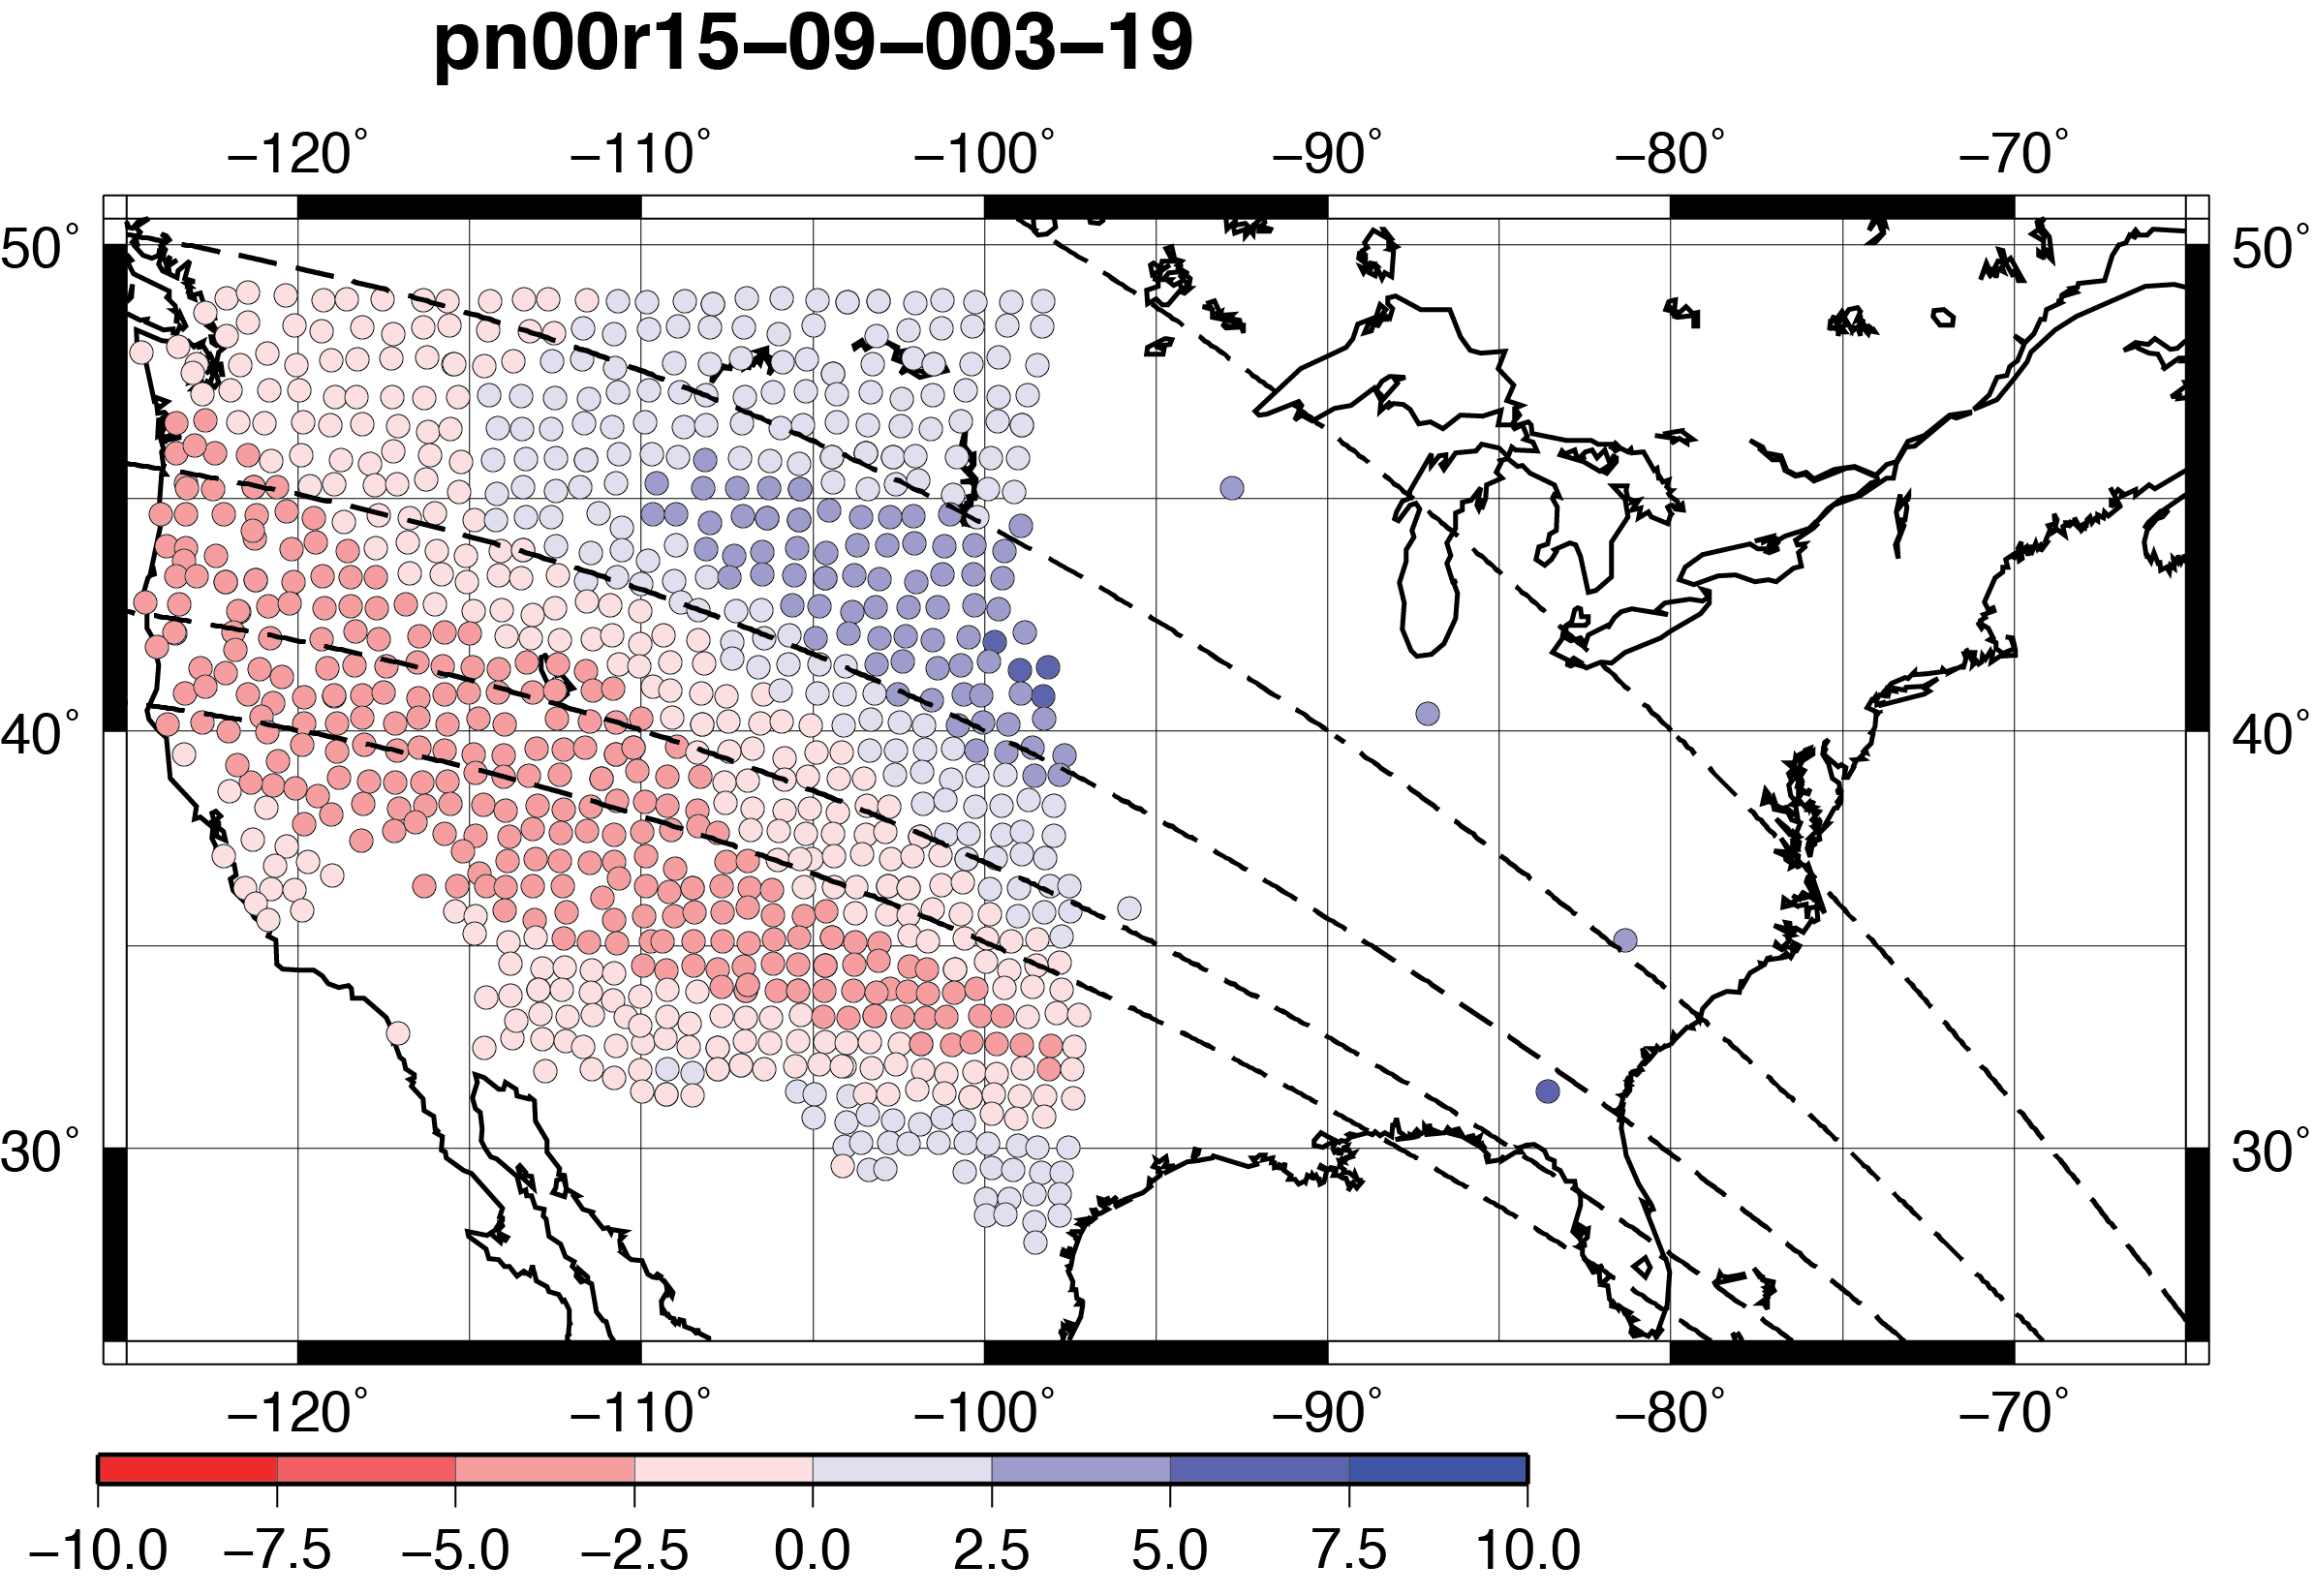
Figure 2. Path integration approximations through a mantle 15 mHz phase Rayleigh wave velocity map from Ma et al. 2014. This includes more stations because the synthetic data covers a greater number of stations.
With only two weeks left I hope to get all of my analysis done. I did not realize how much more quickly I would be able to get things done as the summer progressed, so I will likely be able to get through all major pieces of the project. There will always be more to do in research, but I think I will end this project with some real results.
Reference:
Ma, Z. Masters, T.G., Laske, G. and Pasyanos, M., 2014. A comprehensive dispersion model of surface wave phase and group velocity for the globe. Geophysical Journal International, 199, 113-135, doi:10.1093/gji/ggu246.
Week 4: Getting Some Data
July 10th, 2018
It has been quite fun to work on this project and I already have some great data. Here is a figure showing the locations of the seismic stations I am looking at. These are all of the active USArray TA stations during the first half of 2009.

Fig. 1. All active USArray stations from January 2009 to June 2009.
This second figure shows some of our calculated Rayleigh wave arrival angle measurements for one event at 7 mHz (~143 seconds) and 25 mHz (40 seconds). The arrival angle (deviation from great circle path) is shown on the bottom with blue representing positive deflection and red representing negative reflection. On the top are the calculated errors for each measurement. Sorry the image lot resolution when I uploaded it so it is a little difficult to see. It is really interesting to see how much the patterns change based on frequency, but we are not making any structural interpretations yet. I am currently comparing the results of three different users of this method because it requires the selection of a time window. A small change in the chosen time window can have an effect on the measured values and their respective errors. Next, I will compare the manual result to measurements from an automatic method developed by my mentor’s graduate student Adrian. After that this process will likely be repeated with synthetic data.
A. B.
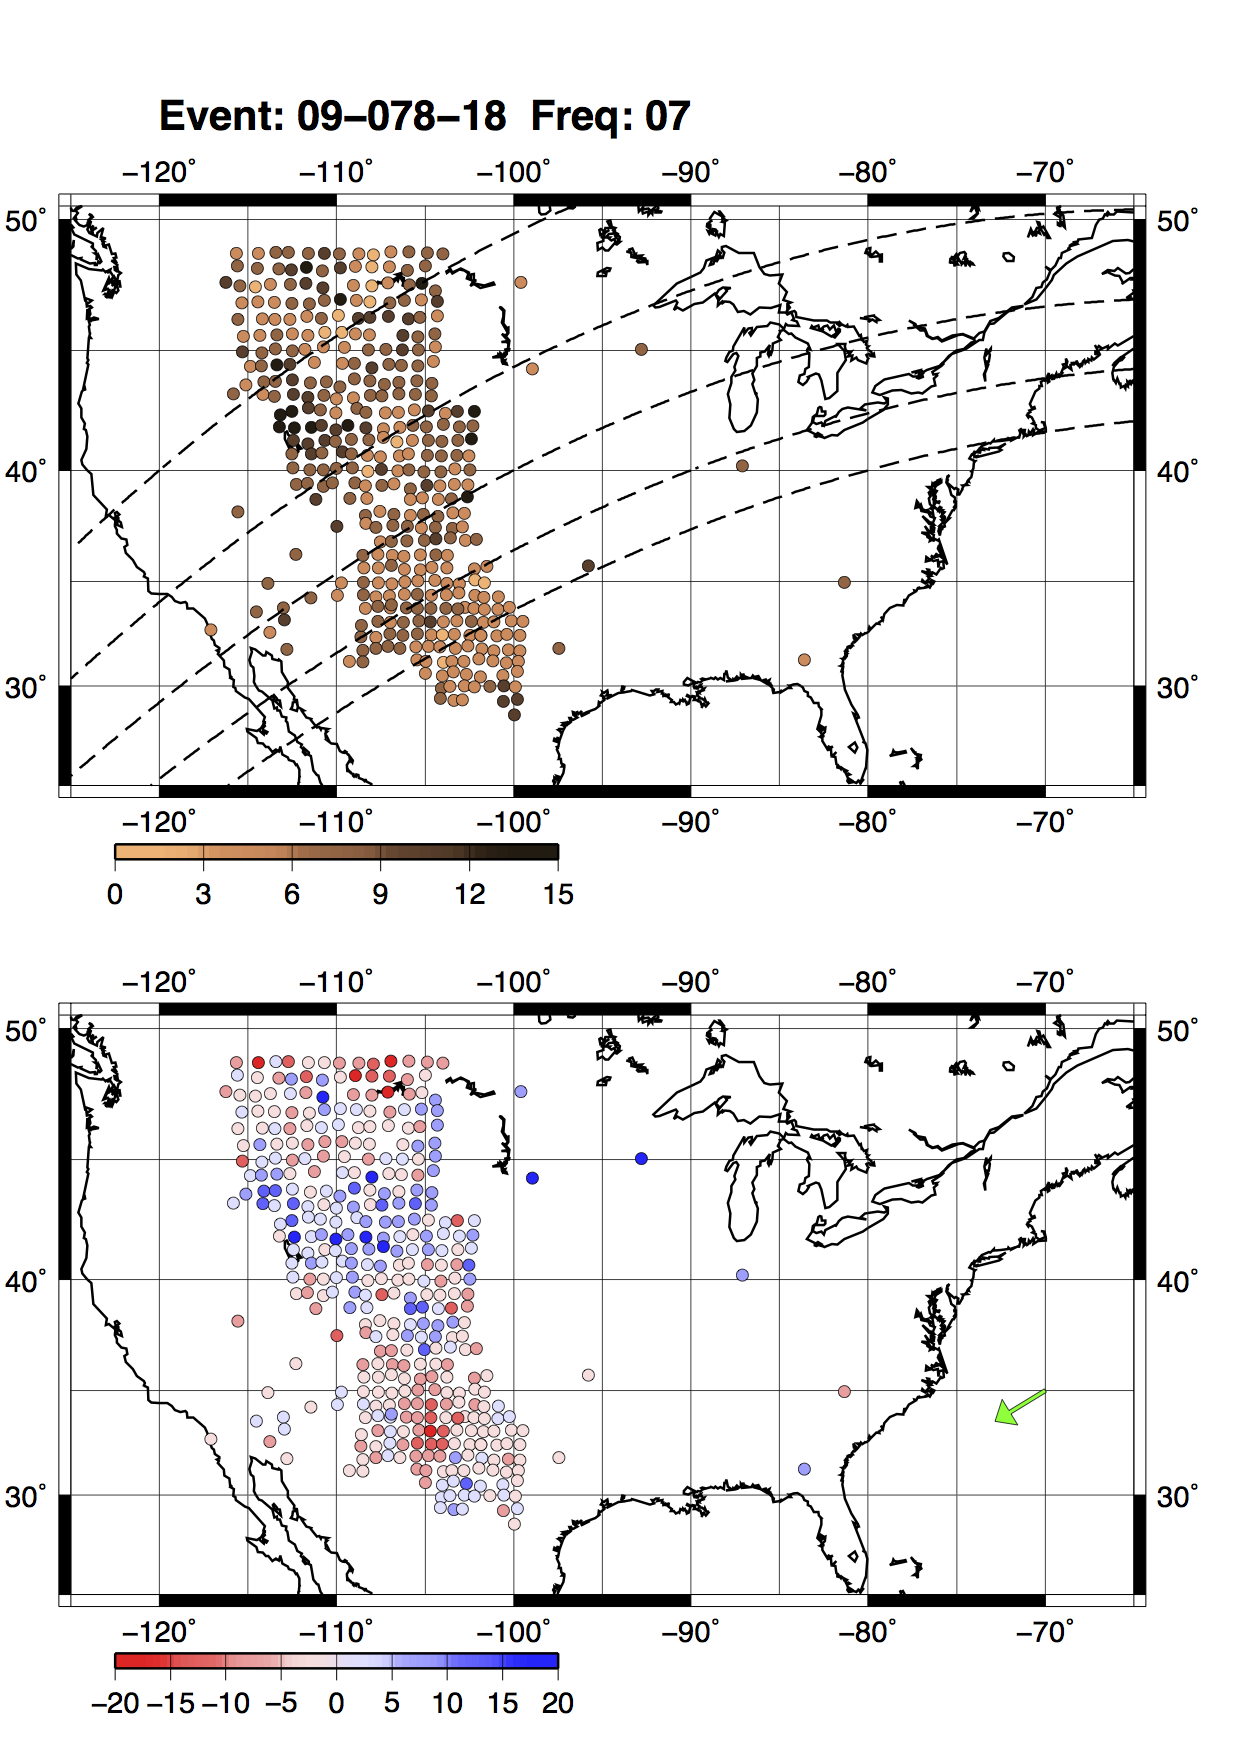
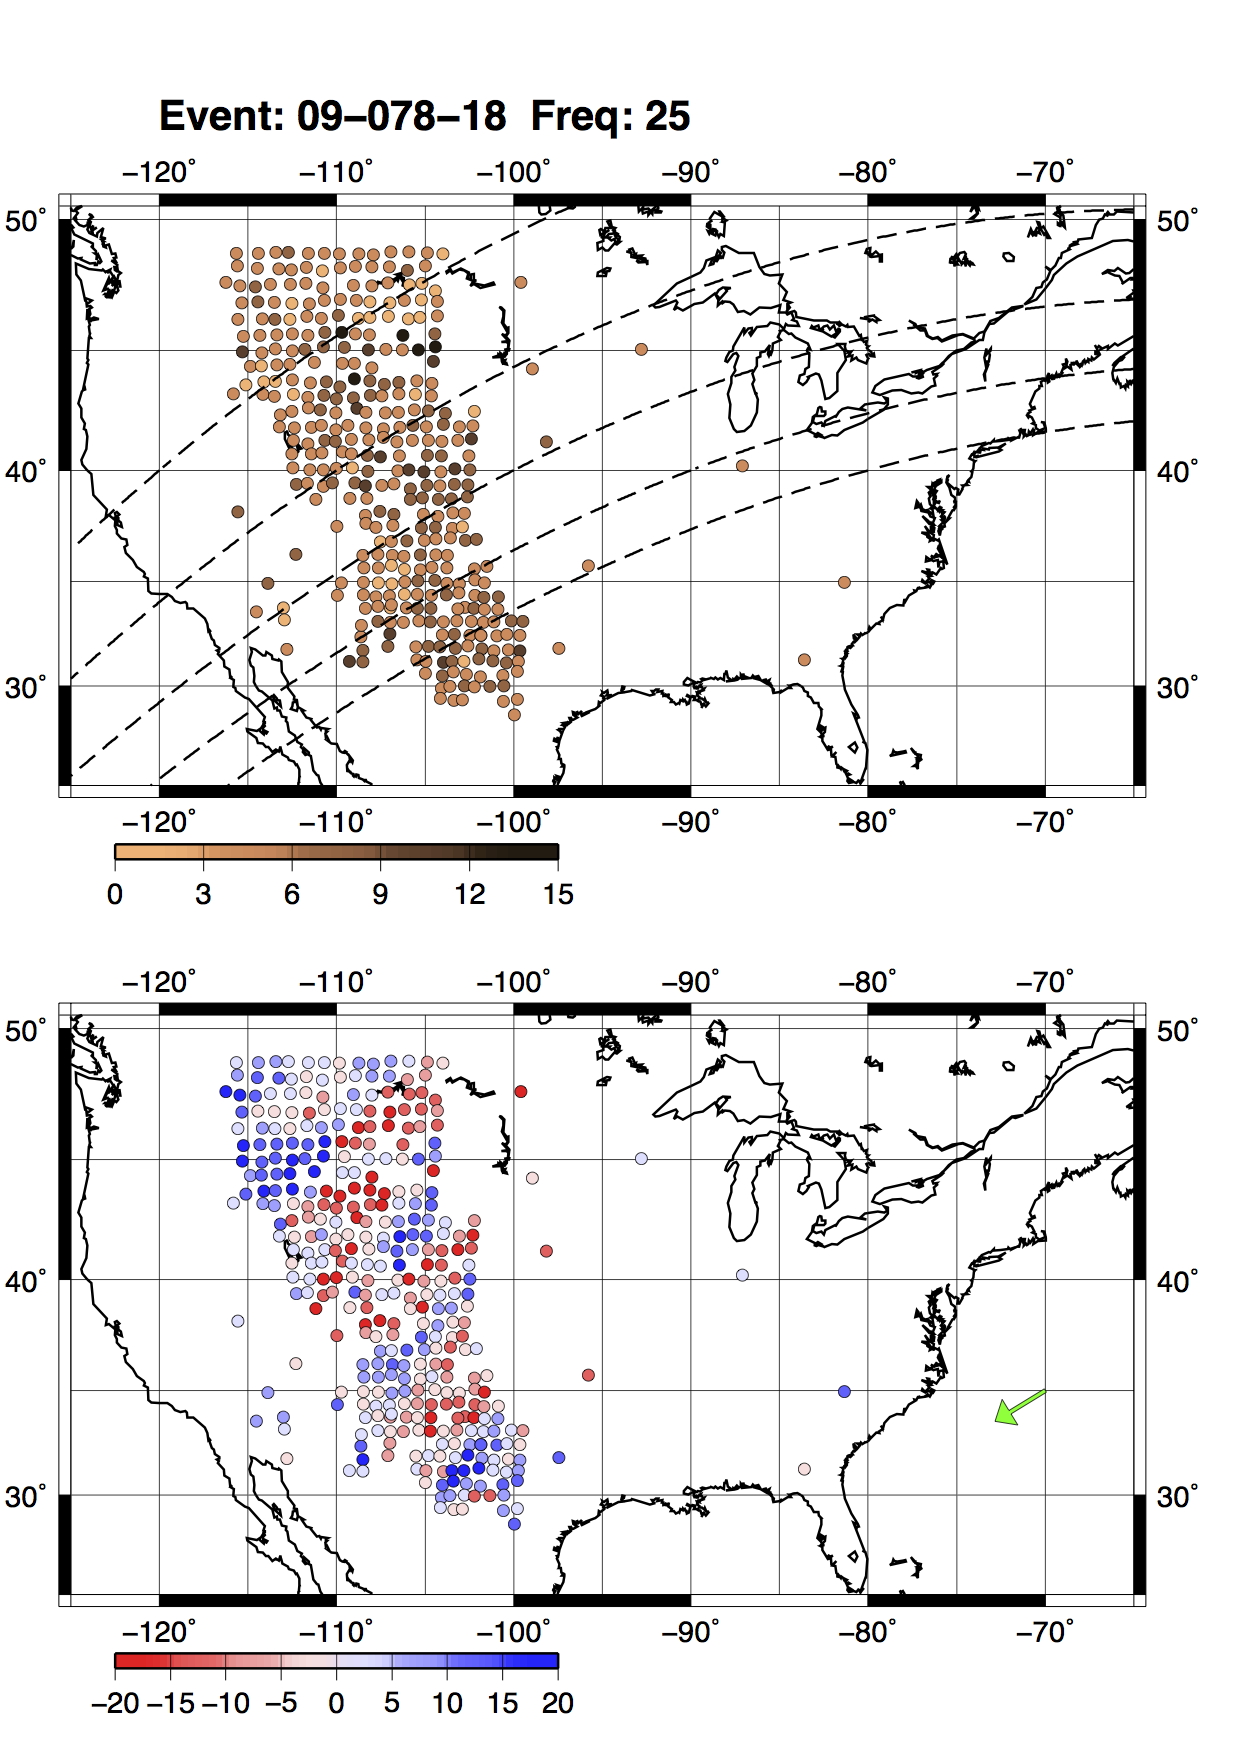
Fig. 2. Rayleigh wave arrival angle measurements for one event across all active USArray stations. A) The measurements at 7 mHz. B) The measurements at 25 mHz. Notice how the patterns are different at the two different frequencies. The event had a surface wave magnitude of 7.6 and came from the Tonga Islands. The depth was 34 km with a distance of about 10000 km to the center of the array. The green arrow represents the great circle direction the to the source.
As this project has developed so has my elevator speech. I have presented posters before and practiced those, but never have given an elevator speech with nothing to reference. I always seem to take about twice as much time as I should, but with more practice I think I will improve. I am already really looking forward to sharing my project at AGU.
Research Cruise
June 24th, 2018
I have just finished the first week of my internship and it was great. I arrived Monday morning and that same evening departed on a 48-hour research cruise on the R/V Robert Gordon Sproul. The purpose of the cruise was to deploy five ocean bottom seismometers (OBSs) to gain a better understanding of some local seismicity off the coast of San Diego. As I mentioned in my first blog post this was my first time at sea and I did in fact get sea sick. Despite the way I was feeling it was a terrific way to learn about ship operations, how to deploy instruments and more about how they work. The crew of the ship and everyone I worked with was great and if I ever get the chance to go on a research cruise again I will take it in a heart beat. Here are some photos I took:
.jpg)
.jpg)
These are the instruments we deployed tied down to the deck.
.jpg)
The computer screens in the science lab. The four left screens are for navigation, while the other two can be used to monitor science equipment. We used the lower right one to observe the data collected from the Knudsen which measures the local bathymetry acoustically.
.jpg)
.jpg)
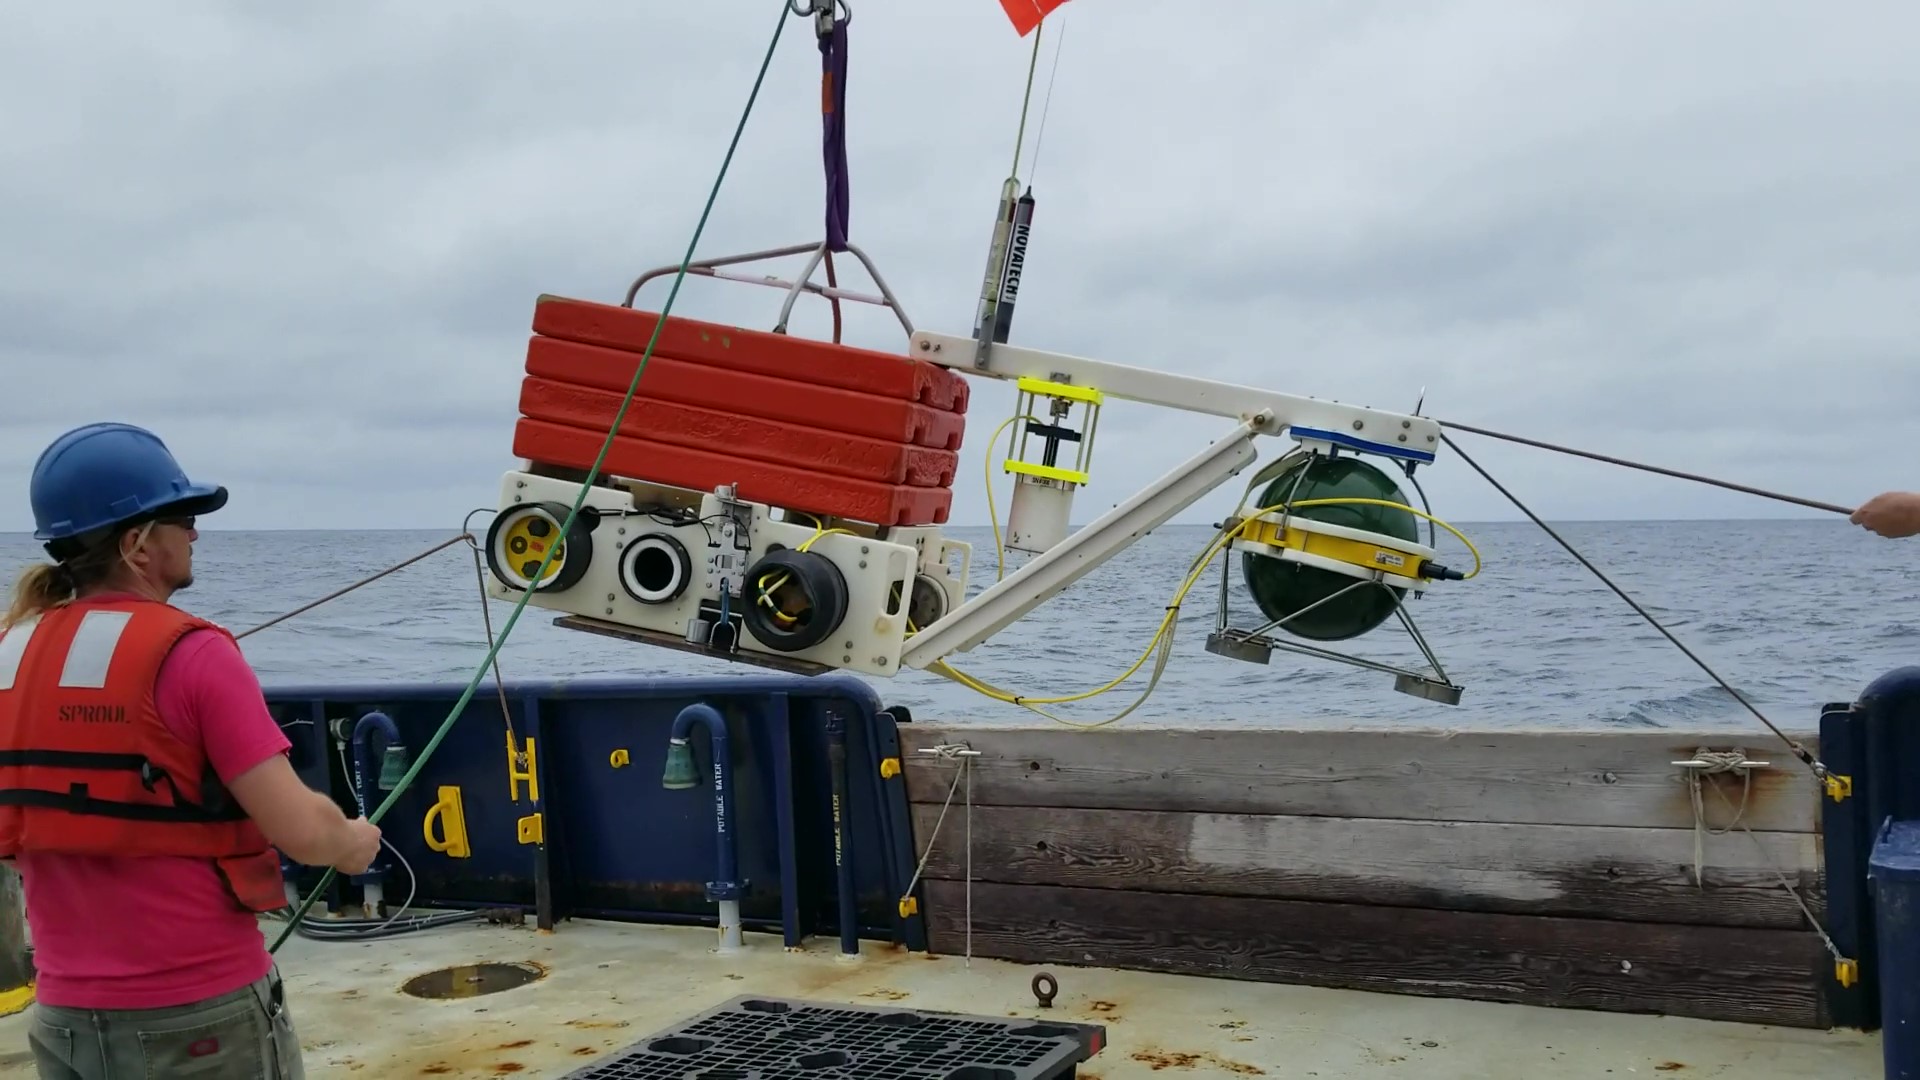
Deploying an OBS. The actual sensor is the green sphere, which drops off of the white arm within 48 hours after two magnesium pins degrade in the salt water. This is to decouple the sensor from rest of the system. The sensor is still attached with a tether so it can be retrieved. The orange boxes are part of the floatation system for recovery. The data logger and other electronics are kept below with the white plastic casing. On the very bottom of the OBS is a steel plate which serves as an anchor and is then released and left at the bottom of the ocean floor to allow for retrieval.
.jpg)
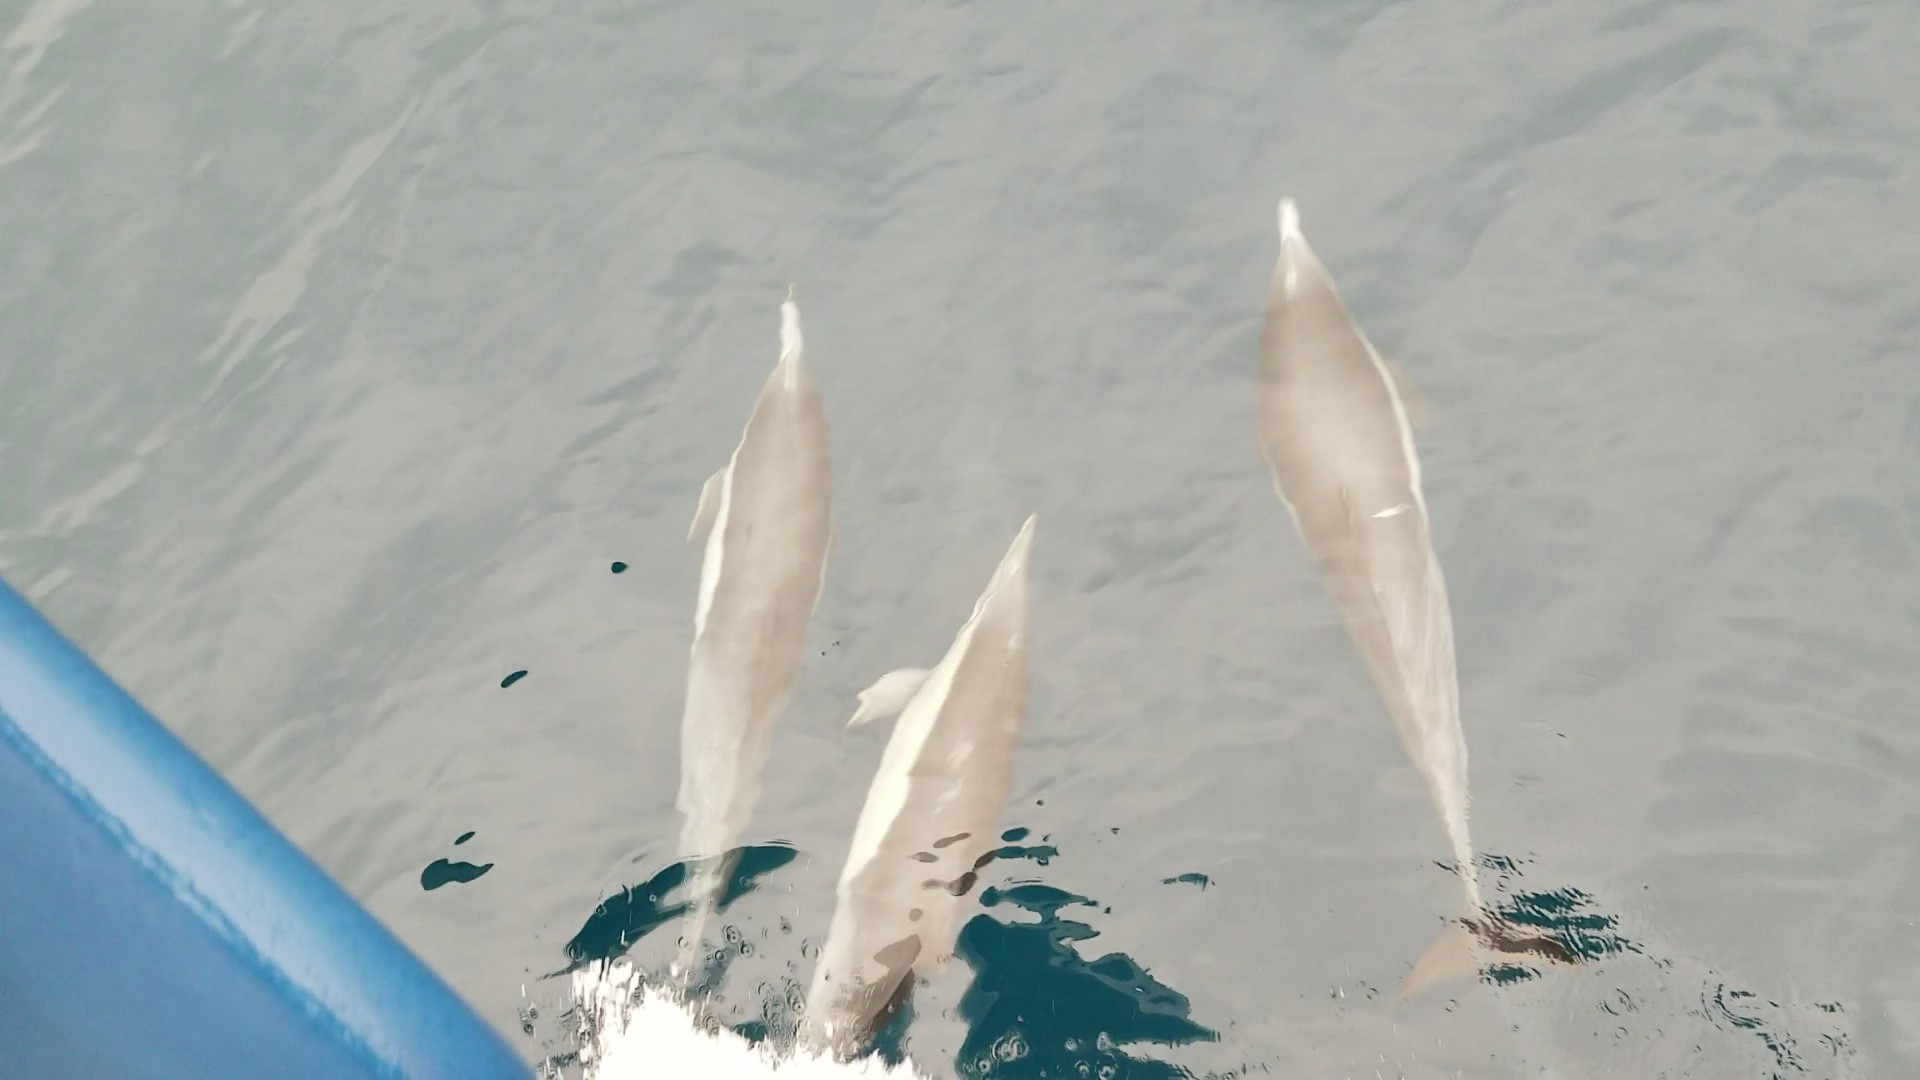
Dophins playing in the bow wave of the ship. If you listened closely you could here them communicating.
Now for the rest of the summer I will be working on USArray data measuring arrival angles. This next week I will be picking rayleigh wave arrivals which are then used to calculated the arrival angles. So far I really enjoy it and cannot wait to get back to work!
The Start of the Summer
June 10th, 2018
So far, my IRIS internship experience has been fantastic. I am so honored to be a part of this program. During orientation week I had the opportunity to meet and make friends with all the other interns all while learning a ton about seismology. I loved hiking at 10,000 feet and exploring San Lorenzo Canyon with everyone. It will be awesome to be together as a group again at AGU, but until then I’ll have to read everyone’s blogs. At my school I am the one of the few undergraduates interested in seismology and it is great to be surrounded by so many students with similar interests.
Due to the quarter system used by UCSD I do not begin my internship until the 18th of June, but I cannot wait to start. My project is focused on seismic surface waves, which I know very little about, but I am eager to learn as much as I can by reading literature. Additionally, I am excited to learn more about synthetic seismograms and how to compare them to real data. I hope to gain as many programming skills as possible this summer. One of the most exciting parts of my internship will be in the first week. I get to go out on a research cruise for three days and deploy ocean bottom seismometers! This will be the first time I have been on a boat for more than a few hours and I am really looking forward to it sans any sea sickness. I’ll try to include photos in subsequent blogs. I can’t wait to start my internship!


