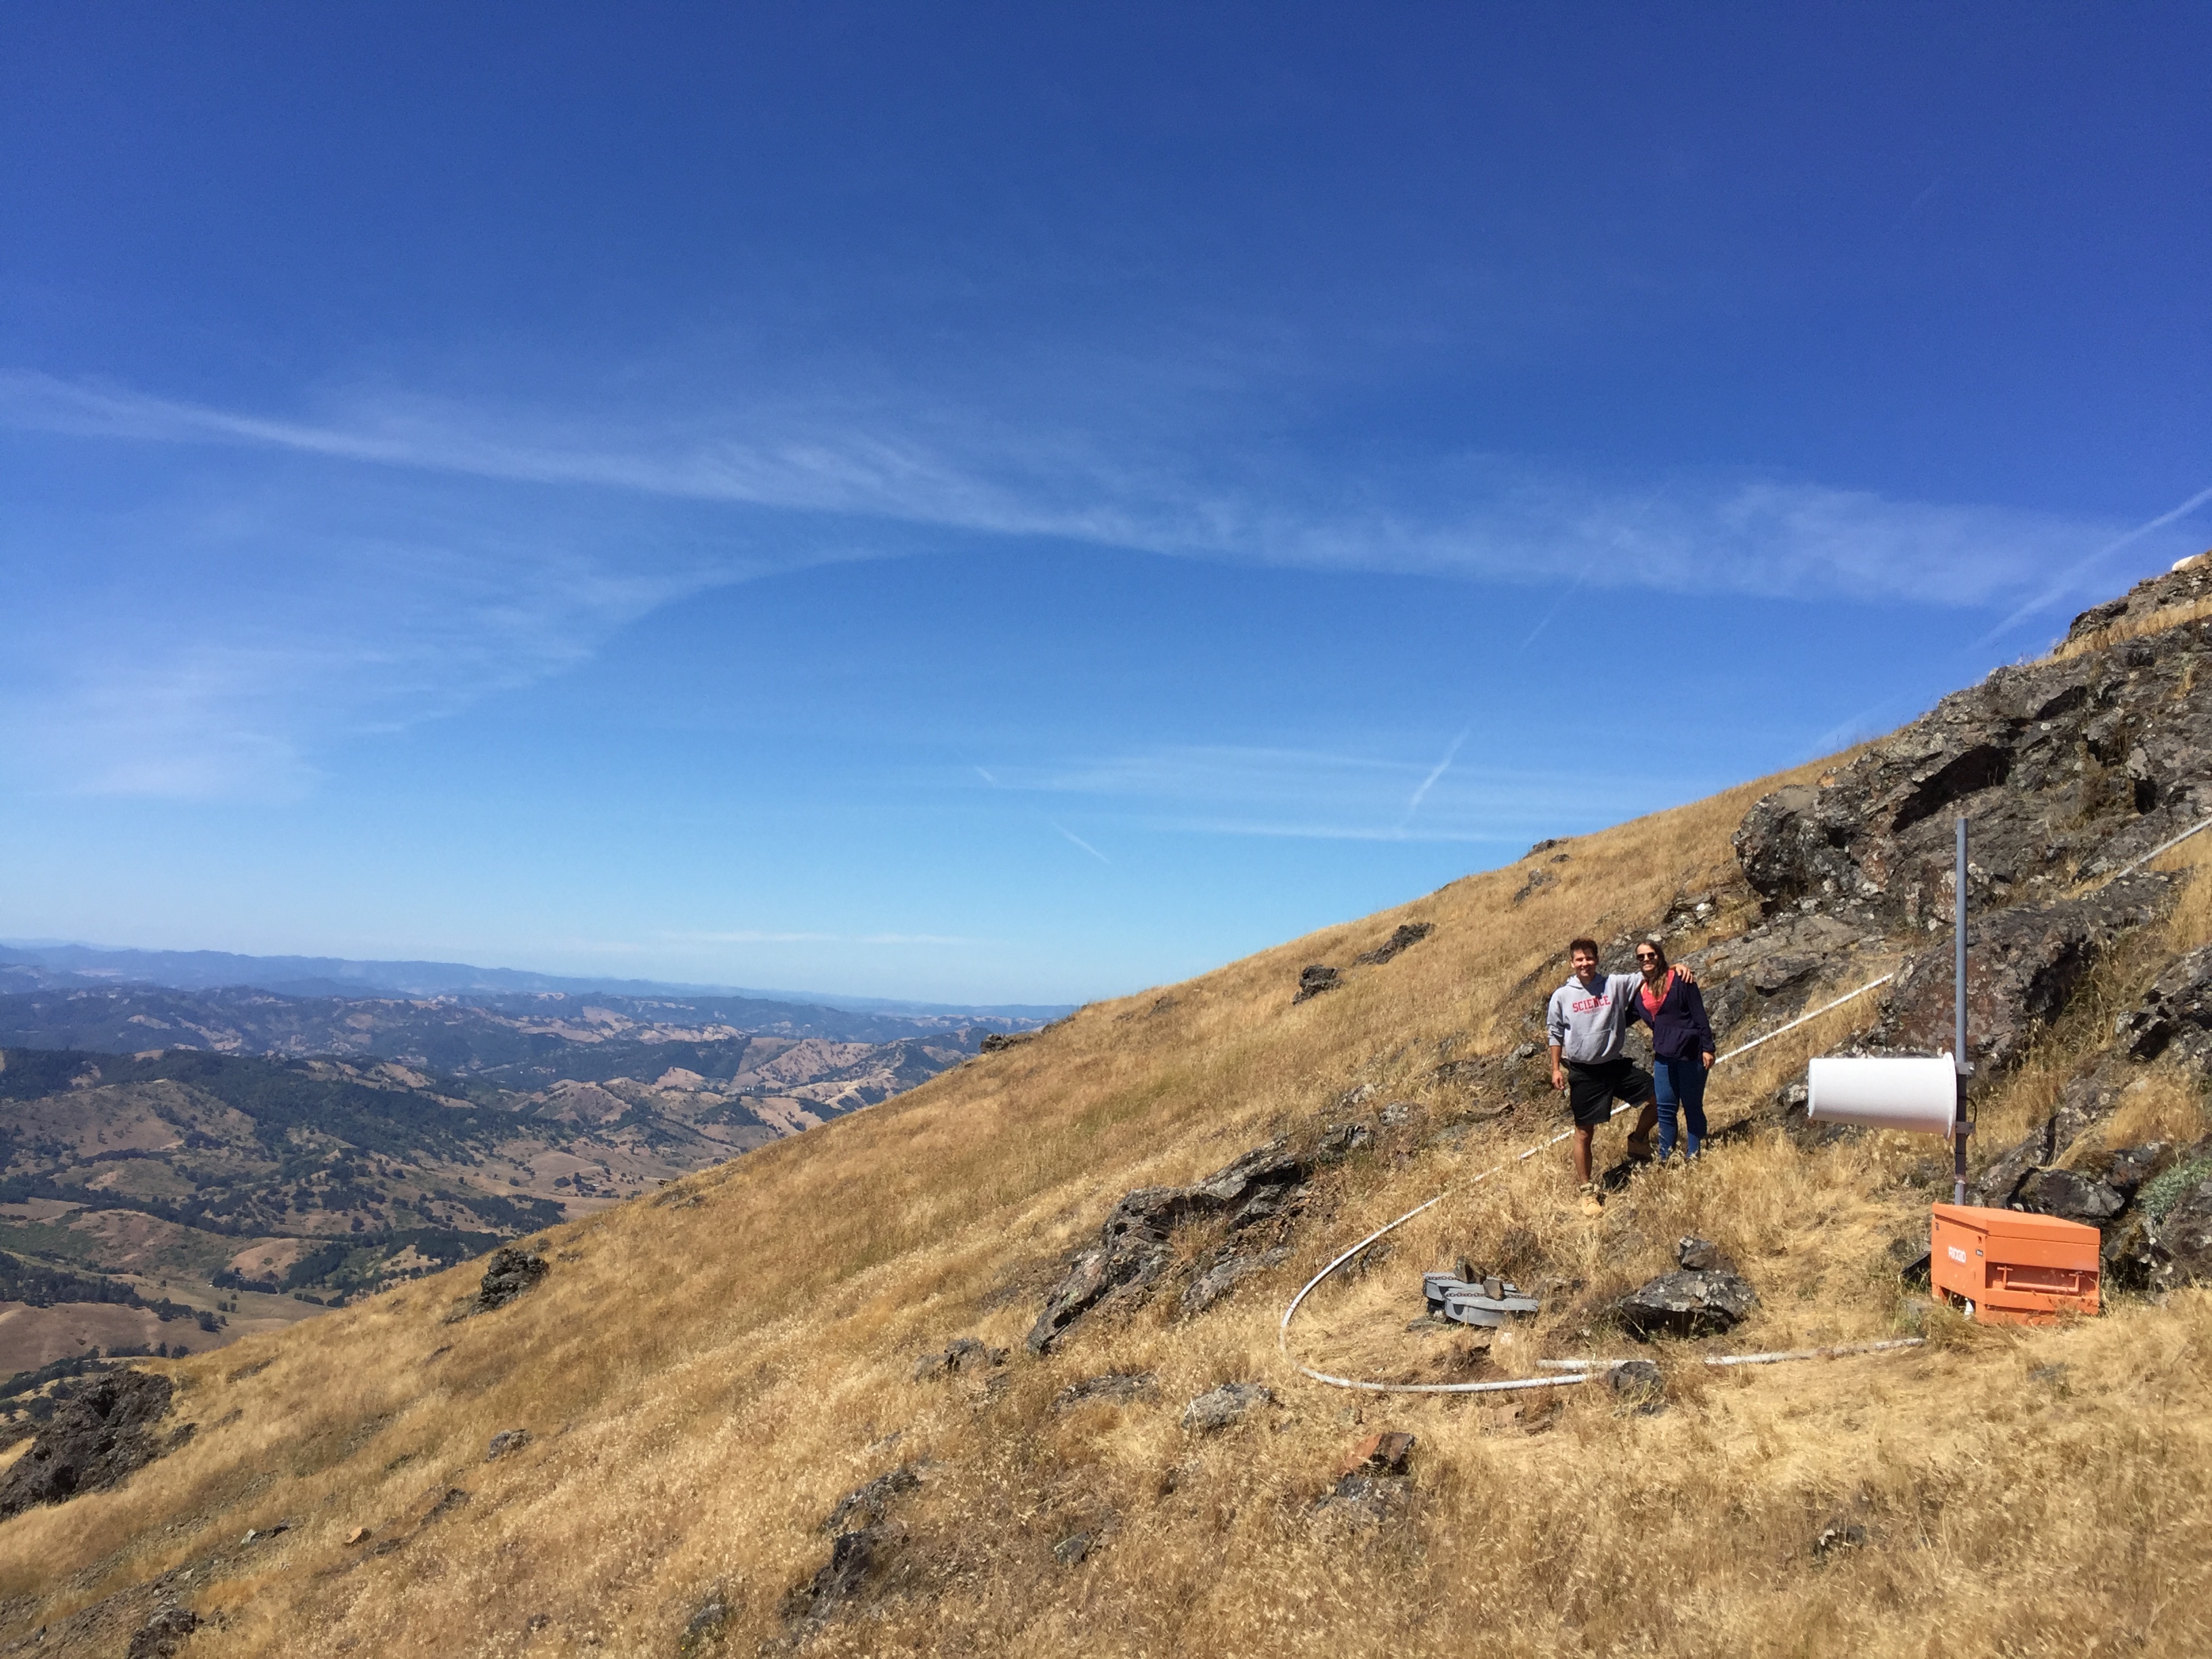
Mariana
Mariana is a student at Universidad Nacional de Colombia currently completing her research at University of Oregon under Dr. Amanda Thomas.
Northern South America is a tectonically complex region in which deformation results from the interaction of three tectonic plates. The understanding of the dynamics of subduction processes in northern South America can be greatly improved if we have an approximation of how energy is released along the different segments of the margin. Subduction in this part of the world is highly segmented, and the mechanisms of energy release along the subduction zone highly variable. In particular, there is a contrast between normal and flat subduction at ~5.5°N at the Pacific margin, whereas the nature of subduction at the Caribbean margin is not yet clear. Besides looking at seismicity patterns, identification and location of tectonic tremor can provide insight into the spatial variations of behavior of the convergent margin. By using available broad-band data from the Seismological Network of Colombia, we intend to detect seismic tremor.
The final week at Oregon University
August 16th, 2018
During my final week, I made a lot of changes in my code to normalize the signal and reduce the anthropogenic noise. The normalization takes the 30 minutes before and after the 1-minute window input (or feature), split the time into 60 windows and take the 25 percentiles in the frequency domain. The figures attached correspond to the Fourier spectra of tremor, earthquake, and noise samples with and without the hourly normalization. I trained and tested the model for this new set of features, then I applied to Central Oregon seismic stations and it detected less noise but we still need to find a way to confirm that is working.
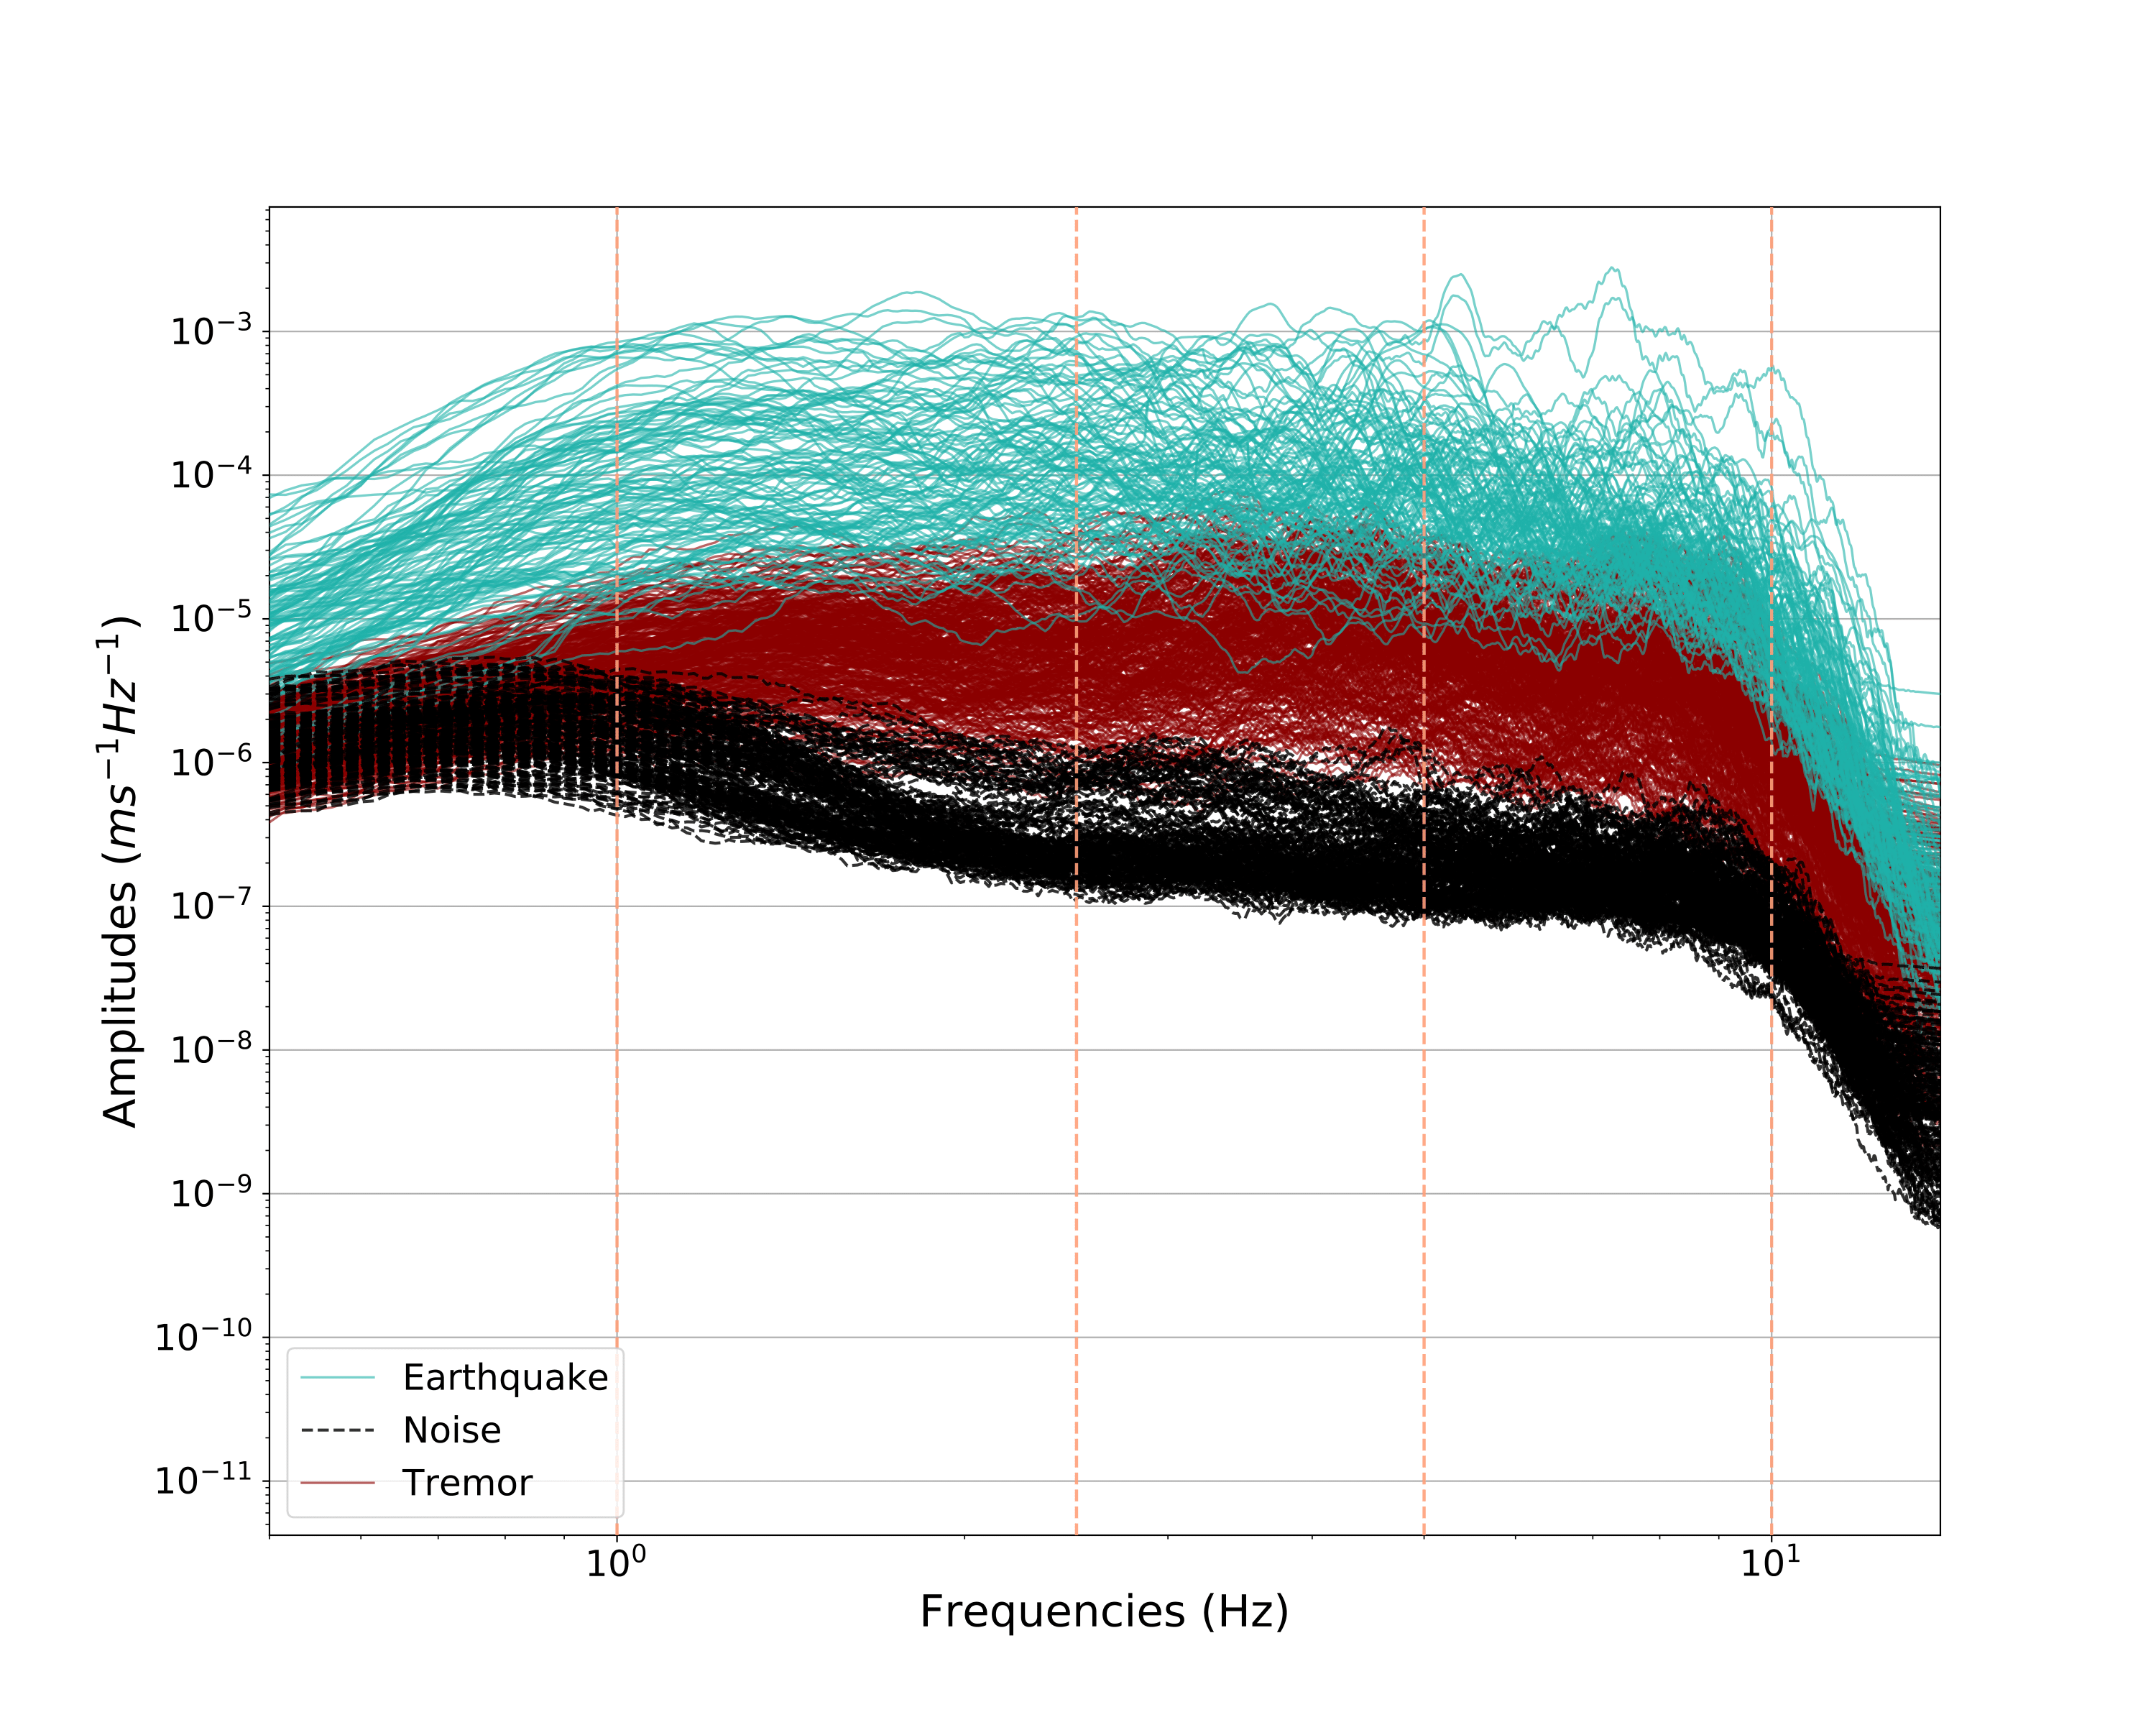
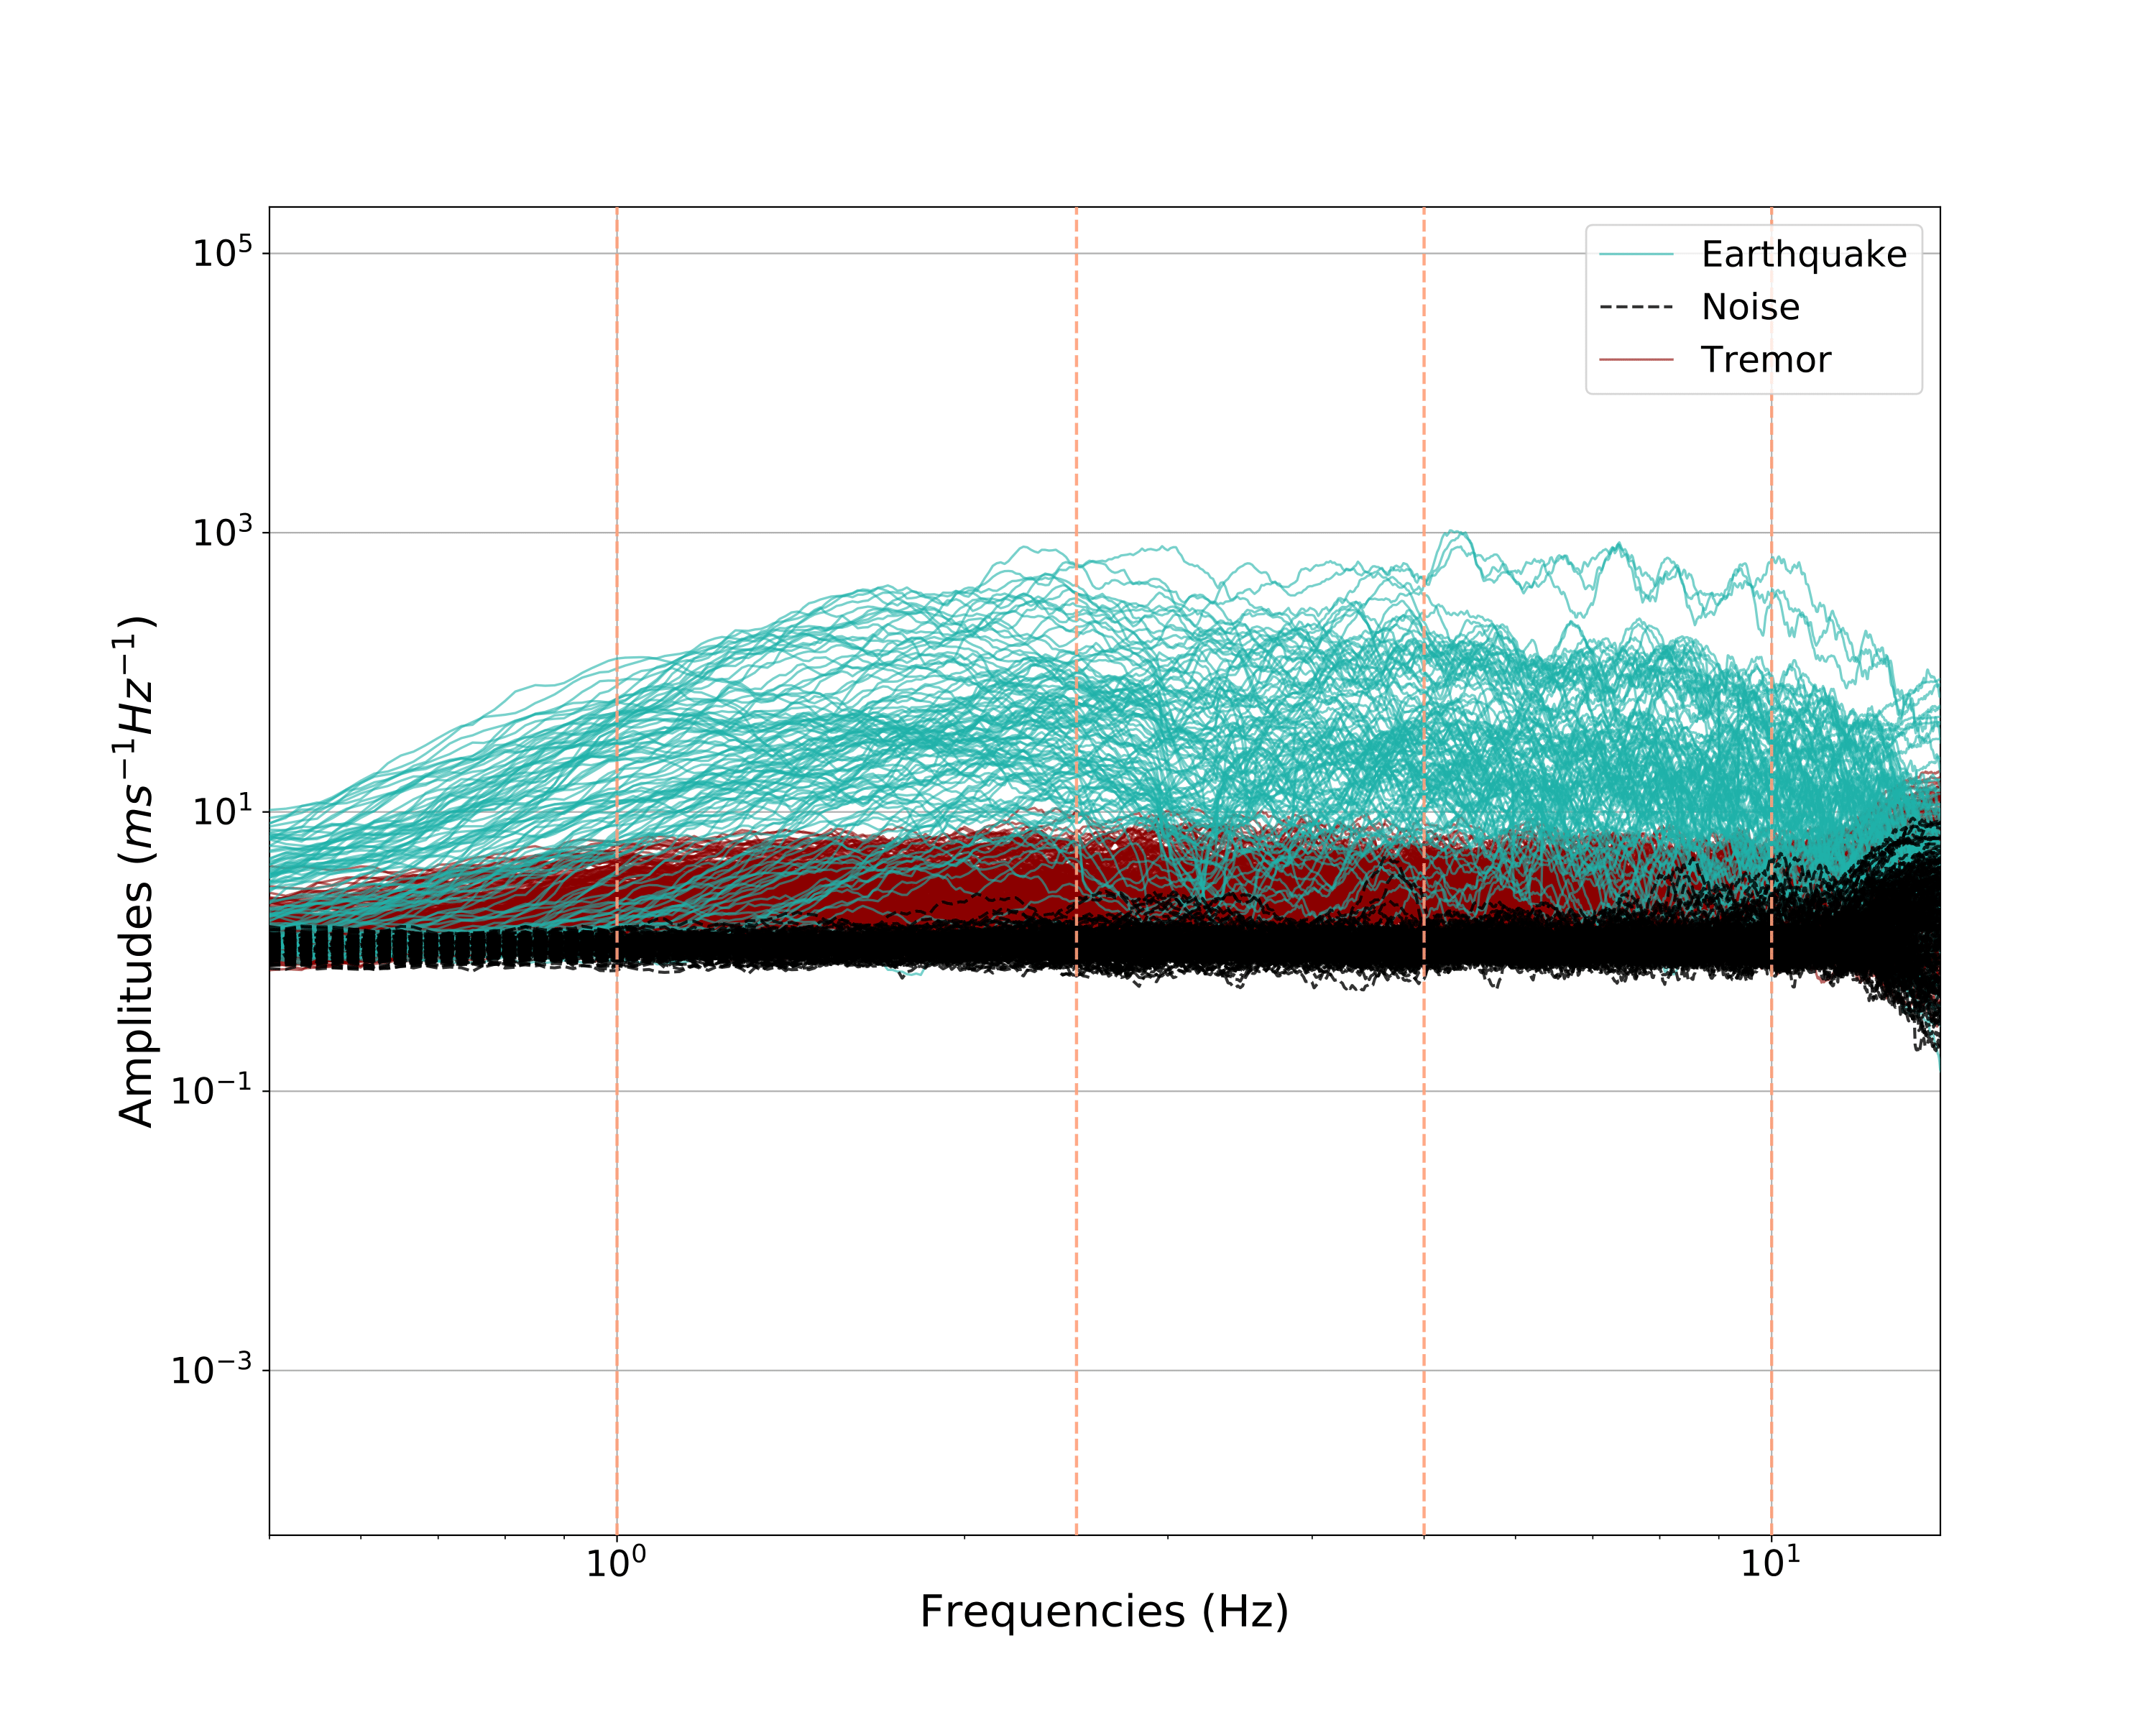
Figure 1. Fourier Spectra of Tremor, noise, and earthquake signal without (left) and with the hourly normalization.


Figure 2. Hourly tremor detection without the hourly normalization for the stations ROGE and CAVE in Oregon.
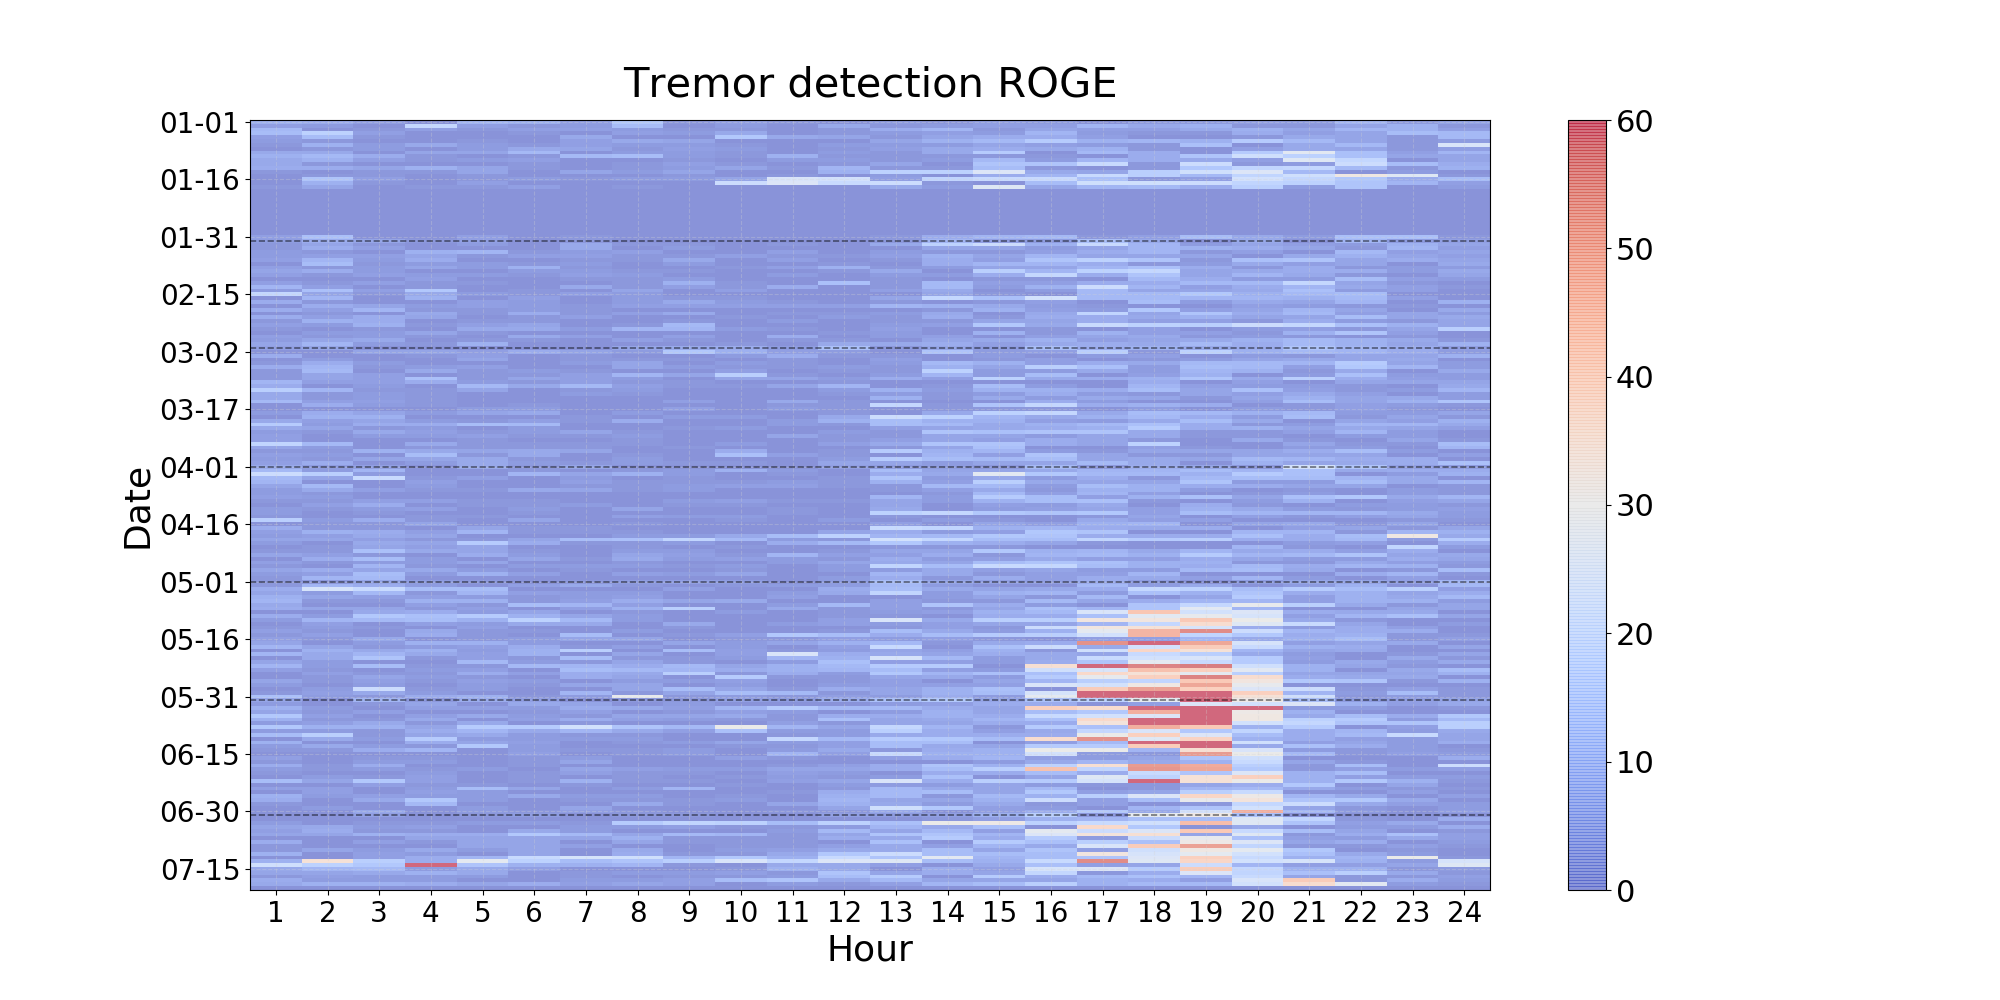
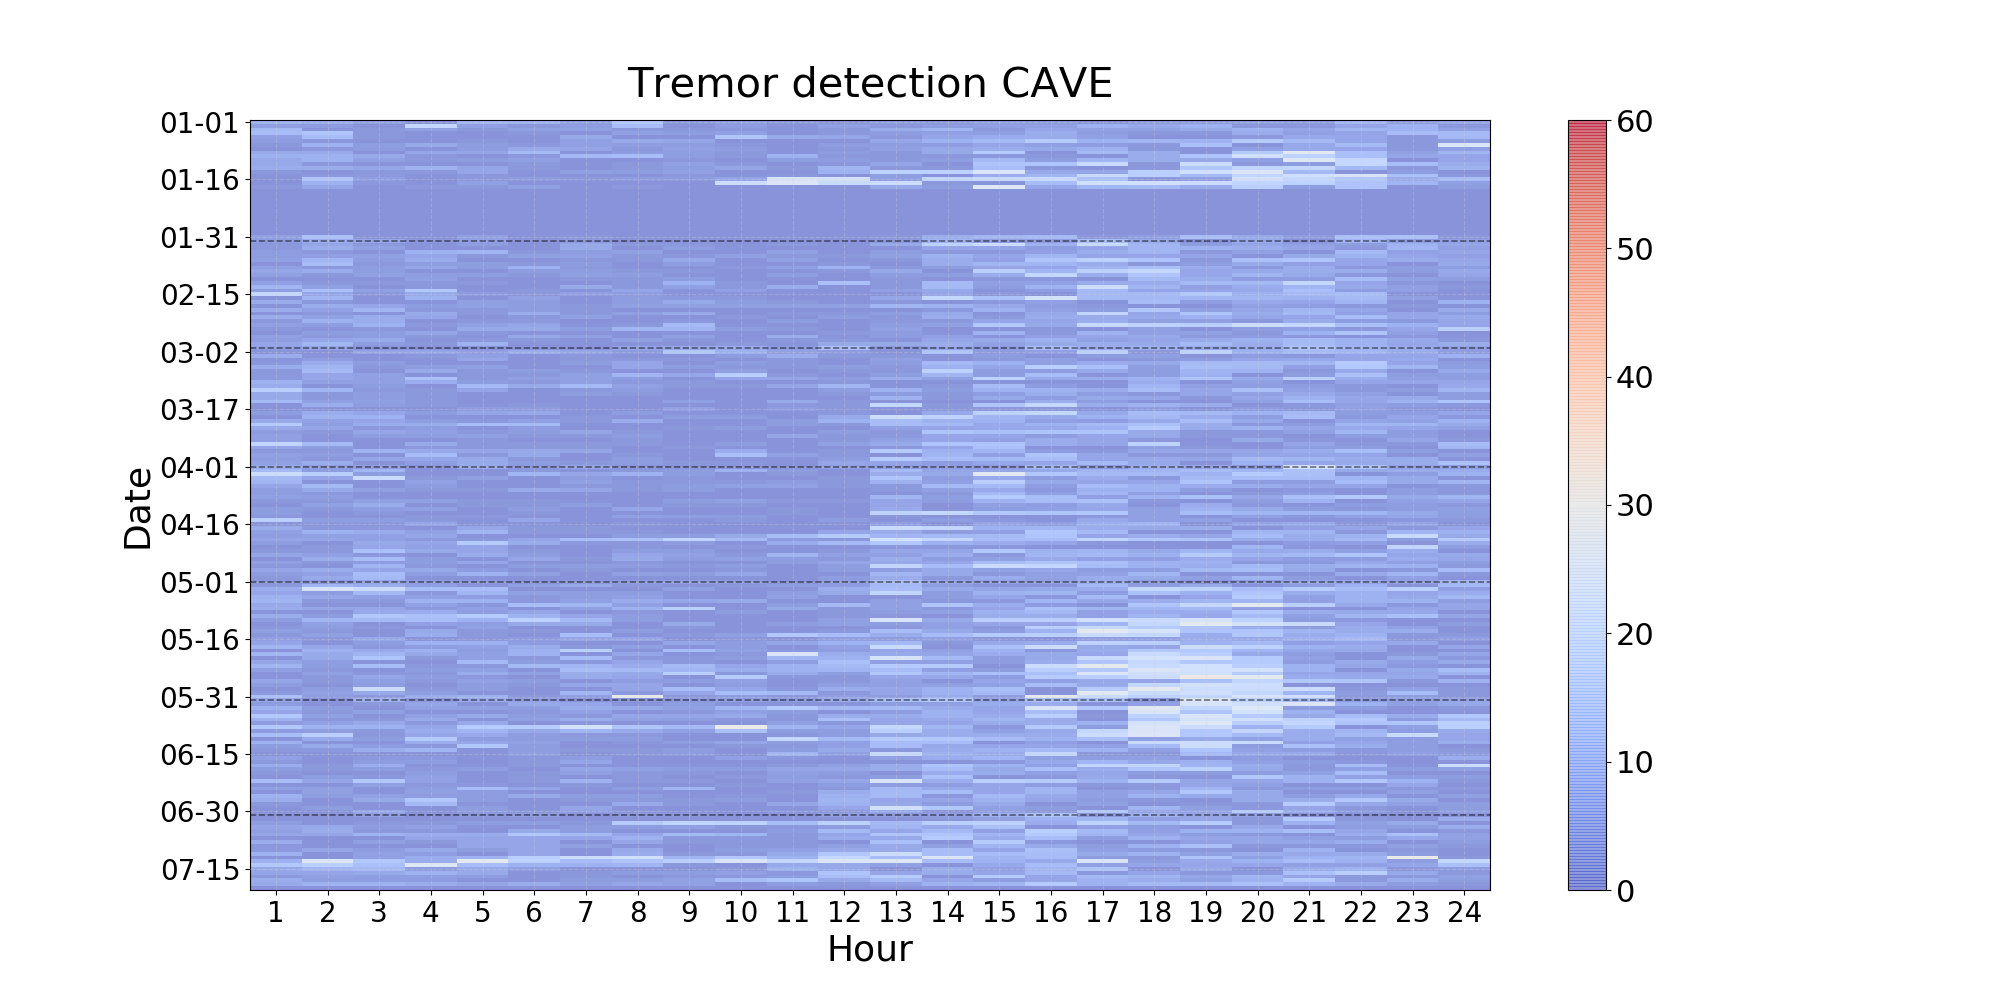
Figure 3. Hourly tremor detection with the hourly normalization for the stations ROGE and CAVE in Oregon.
In the last meeting with Amanda, we discussed a lot of what's next for our project and the things that I'll be working on when I go back to Colombia. We want to make a comparison between our model and Aaron Wech tremor catalog ([url=https://pnsn.org/tremor]https://pnsn.org/tremor[/url] ), maybe using the same stations that they used. Amanda also looked for a big ETS event in Oregon so we can apply our model to it and make the comparison with the tremor catalog available.
Before applying our model in the Colombian stations, we first want to see how it works in the Oregon stations, so we can have more solid results when applying to Colombian data. Amanda also told me about the possibility of writing a paper together with my advisor in my home institution, I really like the idea because it is a way to put all of this work together for motivation to do deeper research projects about seismology in Colombia or even just give another reason for improving our seismic network.
On Saturday, Amanda organized a farewell dinner in her house with all the graduate students in our group. It was nice to spend time with all of them in my last days, I’ll miss them all. It’s hard to leave Eugene and Oregon University, this was a rewarding experience that has changed me in many different ways. Now I feel more confident of what I can approach and I´m emotionally stronger than in the beginning. Living in a different culture and meeting people from other countries was one of my best life experiences. I still remember when I first got to the USA, I had mixed feelings for being outside my country, I could barely speak English and I struggled to understand what everybody said, which made me feel afraid about what followed, but now my English skills have improved and I'll keep improving.
With this experience, I realize that I really want to go to a grad school, but I still need to be more specific about what I want to study. I just can say that it will be something related to geophysics.
Working with Amanda was great because she was always full of new ideas for the project and she is someone that really love making science and conveys that feeling. Also, It was great to share with the grads students, they always were there for helping me and make the days more interesting.
Oregon is amazing, I'm so glad that my internship was in Eugene. Life is always changing and I hope one of those future changes bring me back to this place.

A slow code!
July 30th, 2018
The past two weeks I've been trying to run the code for detecting tremors using one year of the Colombia data. In the beginning, I tried to run the code from my computer but it got frozen, then I ran the code in the terminal but it seemed that was going to take forever. After that, Amanda told me that we could do it through Talapas (the supercomputer of UO), the only problem was that I had no idea of how it works, so I started reading about Talapas and how to submit a job into it. Since spent a couple hours trying to use Talapas and getting more confused about it, Alex (one of the graduate students) came to my rescue and found another grad student that has worked with Talapas for helping me. When I finally submit my job, errors started popping up and then, after hours of looking up how to solve the errors, I decided to divide the code and re-structure it. Finally, I ran the code every three months and it took a long time but it worked.
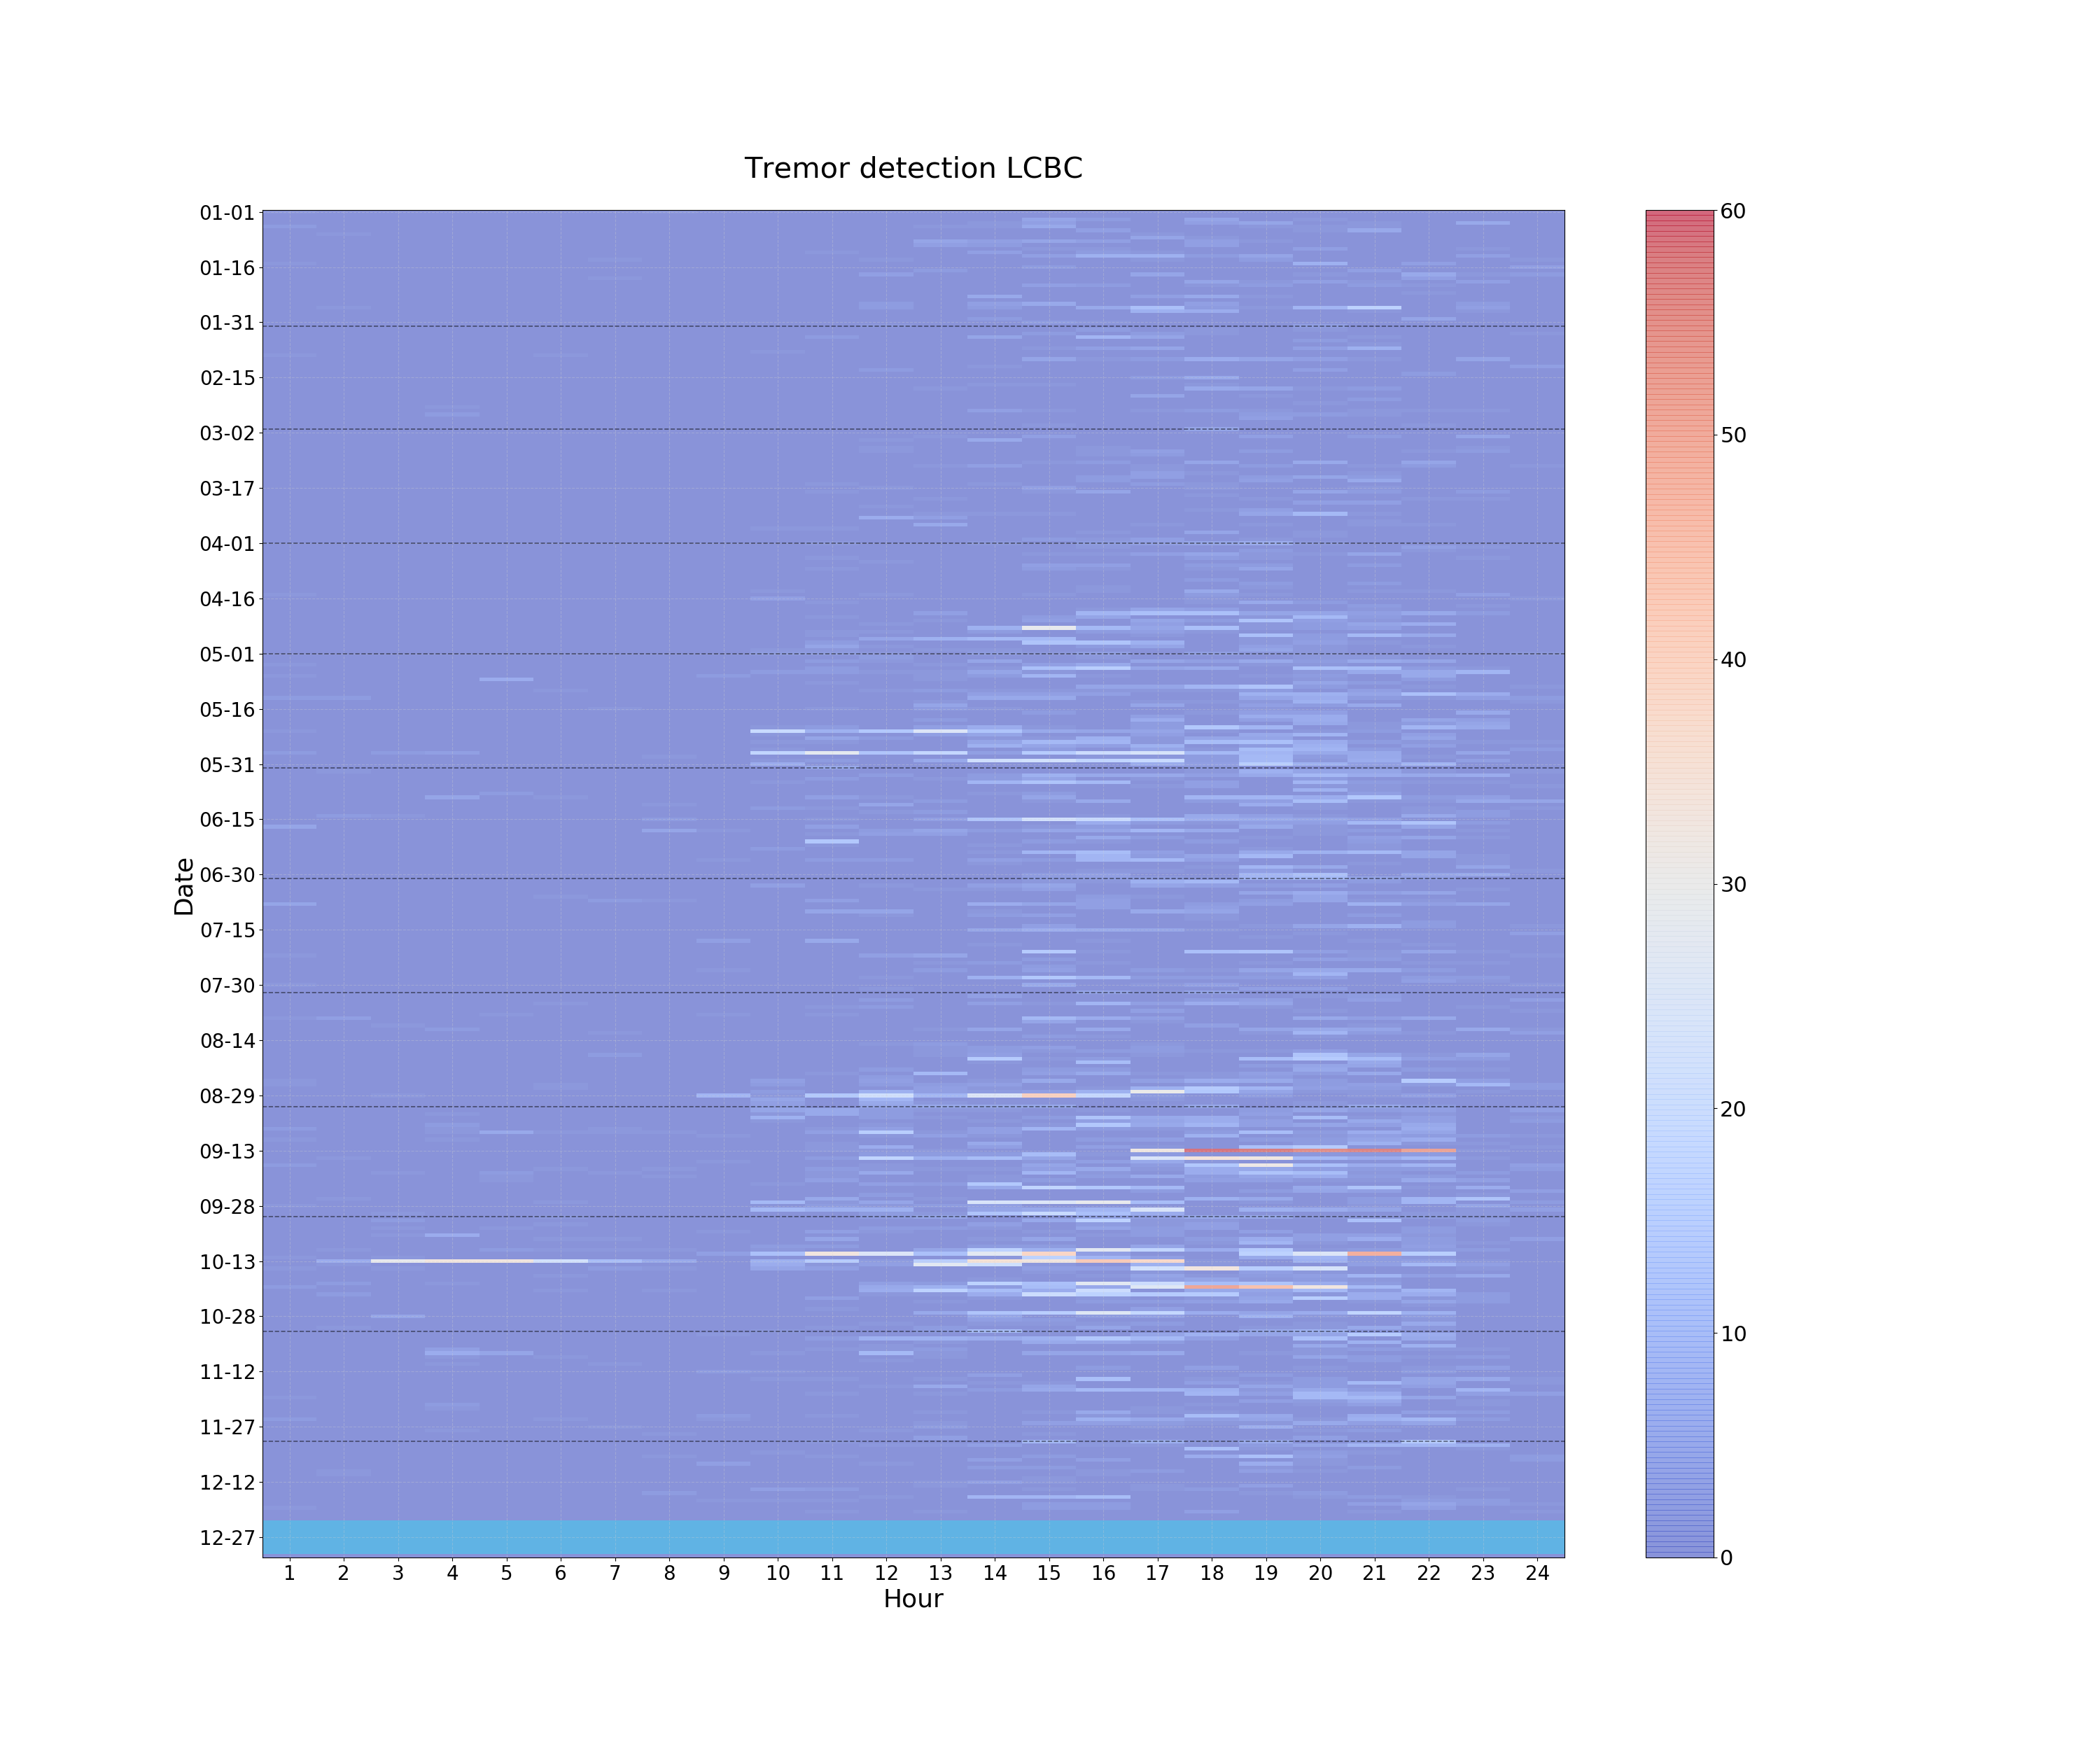
The code extracts the features from Colombia data and then, in another script, I ran those features into the trained model (the multinomial logistic regression model) in order to determine if there's a tremor or not. Unfortunately, most of the stations show a high anthropogenic noise level that has been being detecting like a tremor. In the figure attached, we can see an hourly tremor detection plot. The times are in UTC and for you to have an idea 11:00 UTC equals 6:00 COT, what meant that between11:00 and 23:00 UTC corresponds to the day hours in Colombia, being this the time when the model detected most of the tremors. Although there are some detections during the night hours that may be associated with a tremor event, those detections are clearer in the stations near the Carribean sea.

Since the anthropogenic noise is our big problem so far, we're looking for a way to remove the noise from the Colombia signals in order to clear the tremor detections. The truth is that I've been feeling a little frustrated after don't see a clear tremor signal like here in Oregon, but its complicated in the stations in Colombia, not only because of anthropogenic noise but because of the sparse seismic network. In the end, I realized that there are just two possibilities:
1. By removing the anthropogenic noise we are going to be able to see some detections that may correspond to a tremor event but the distance between stations wouldn't be enough to prove its actually a tremor.
2. Don't find a tremor event in Colombia because maybe there is not (I don't wanna think in this option but it's possible).
The good news is that I made the hourly detection plots for the 2018 ETS event in the tremor PNSN catalog, and the model seems to work well. I chose three nearby stations and most of the detections occur at the same time, which confirms that is a tremor.
Last week I also made my abstract for AGU, it was a little complicated since we still don't know if we are going to find some tremor event, but I finally did it and I'm really excited for participating in an international congress.
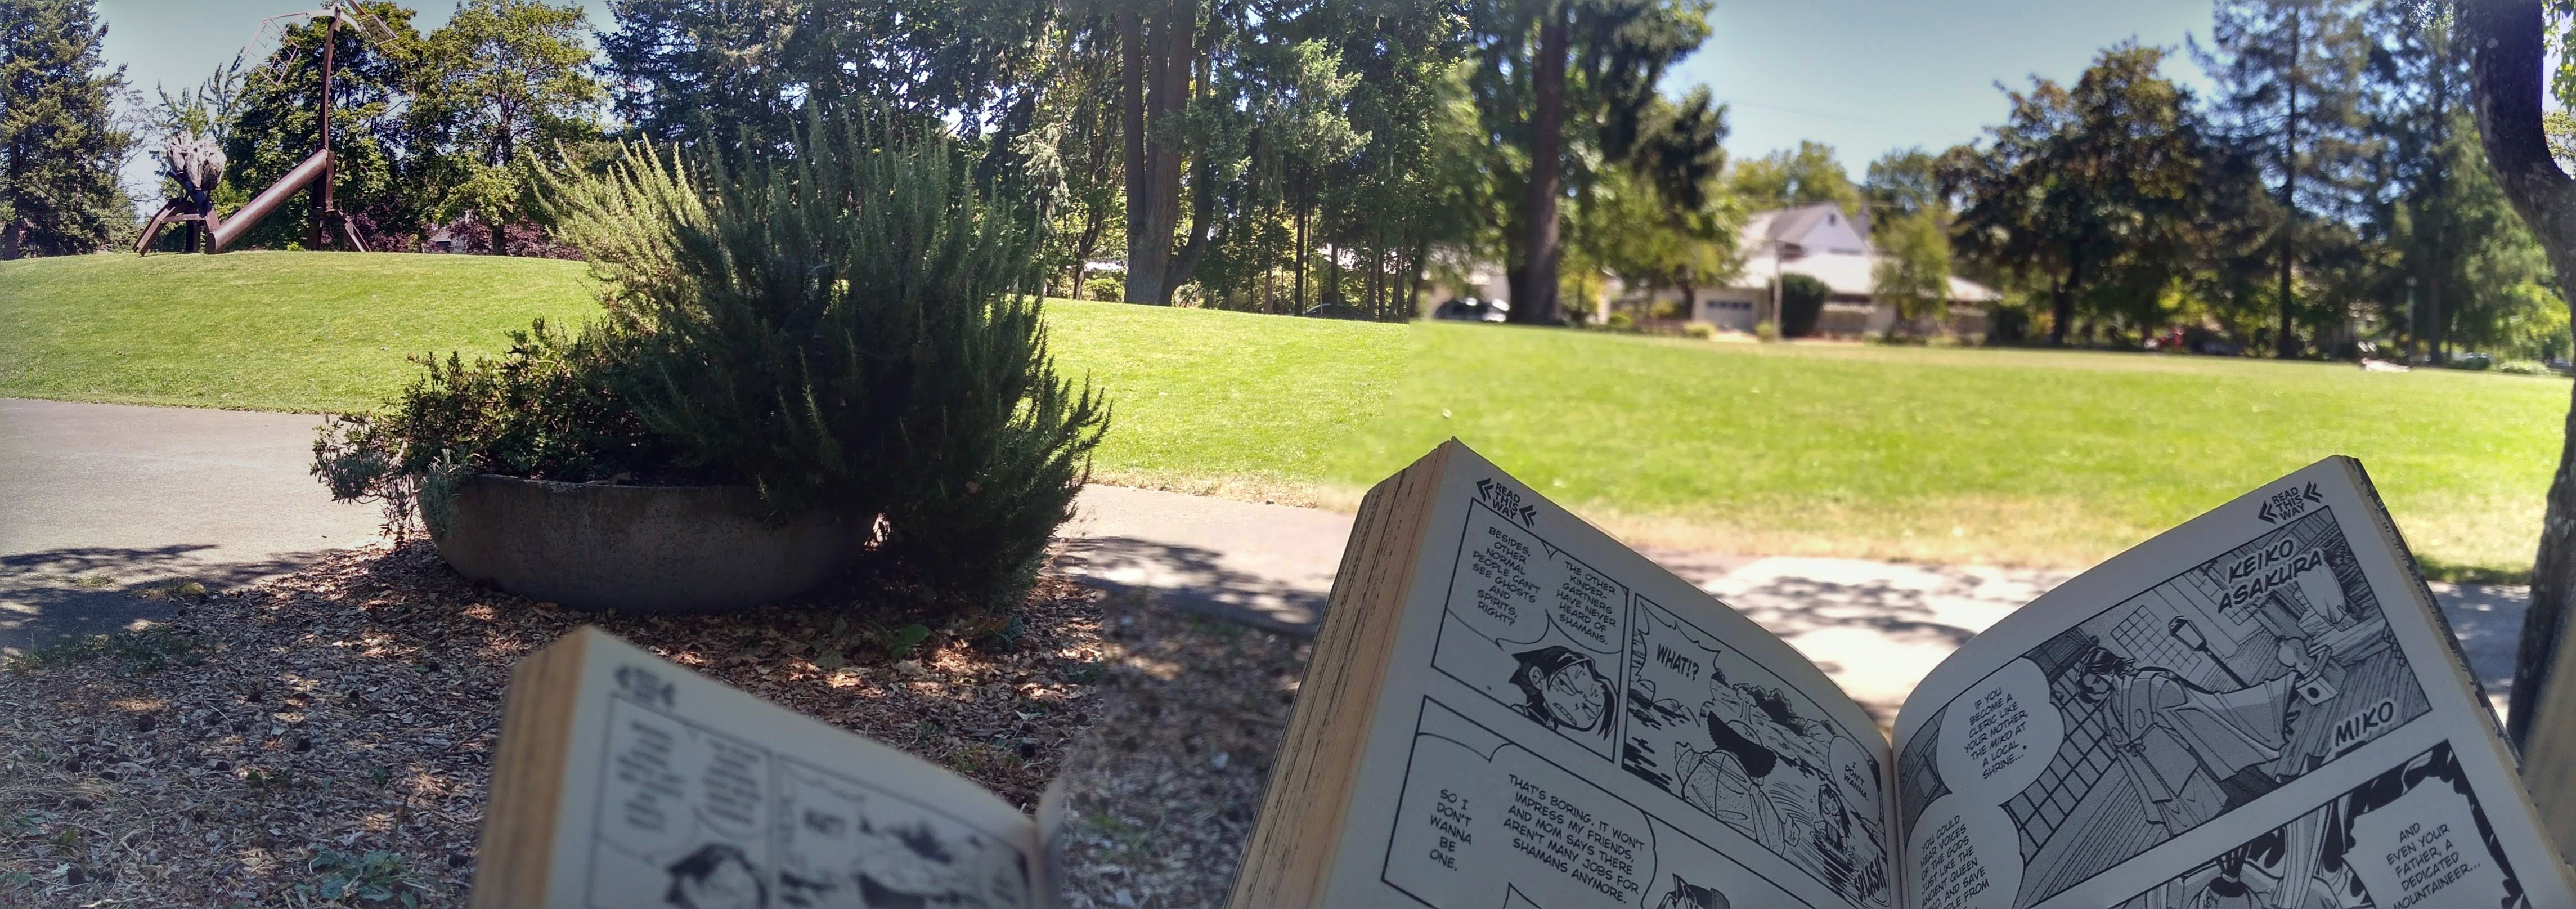
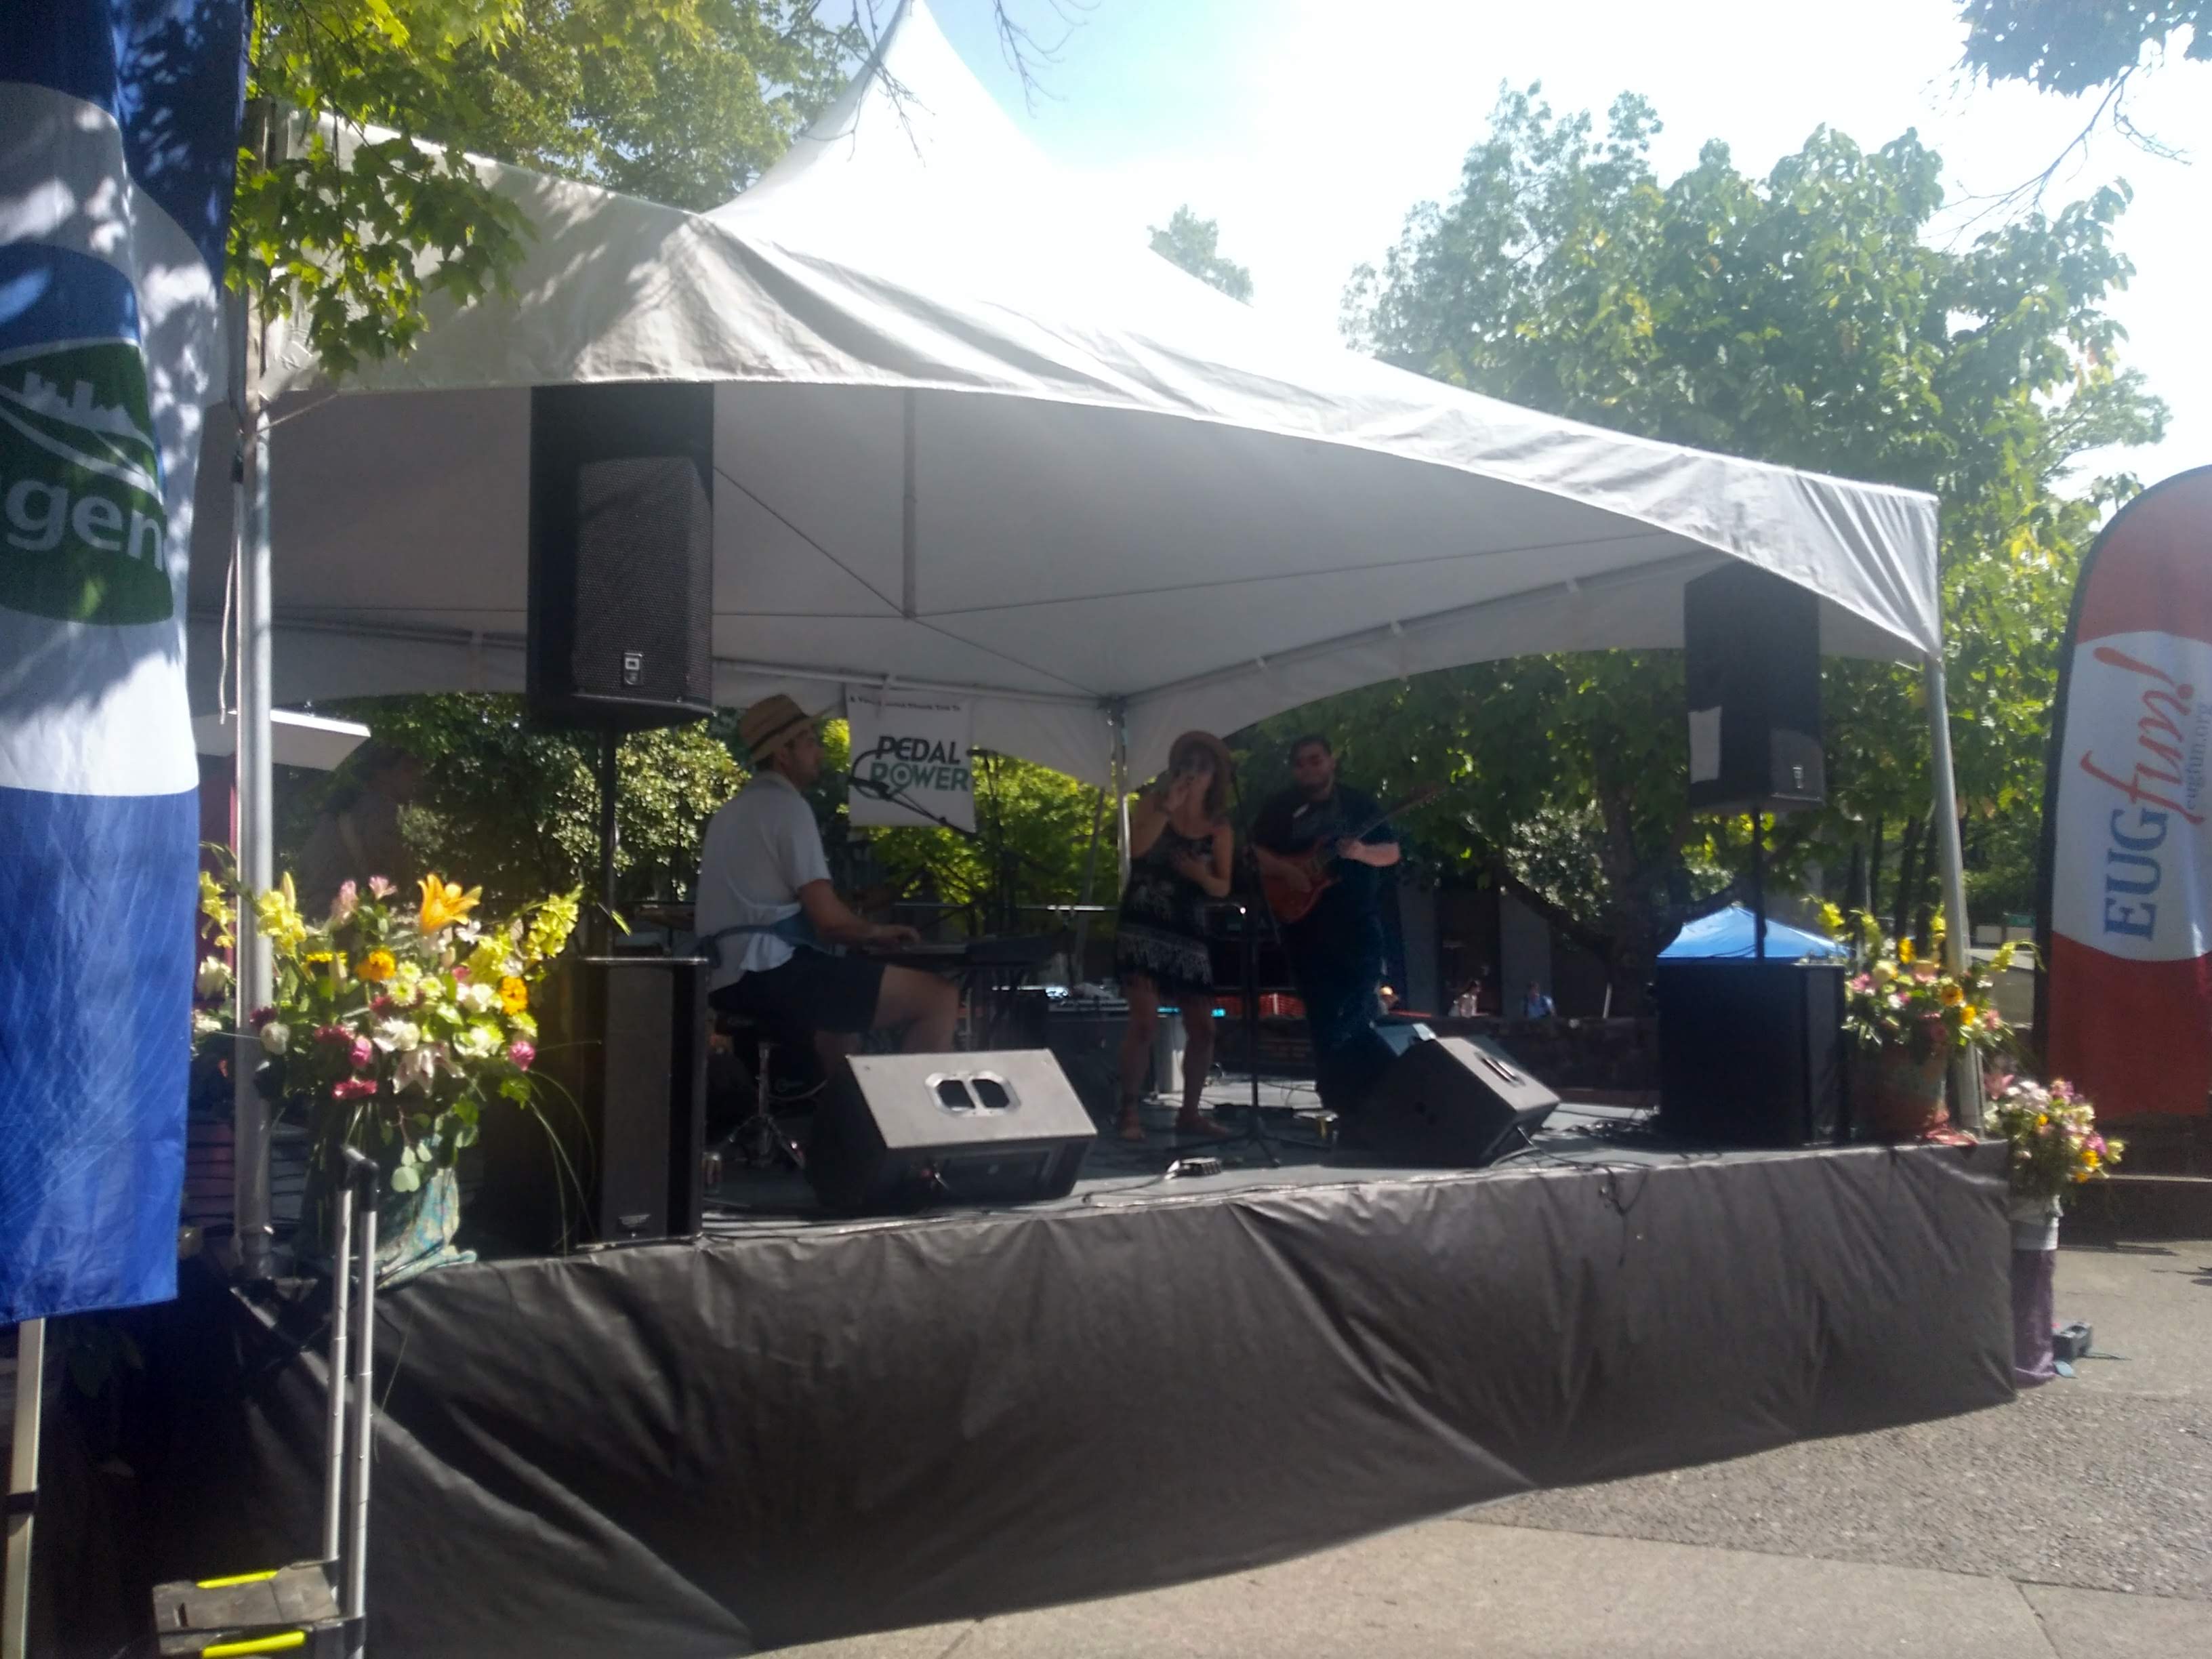
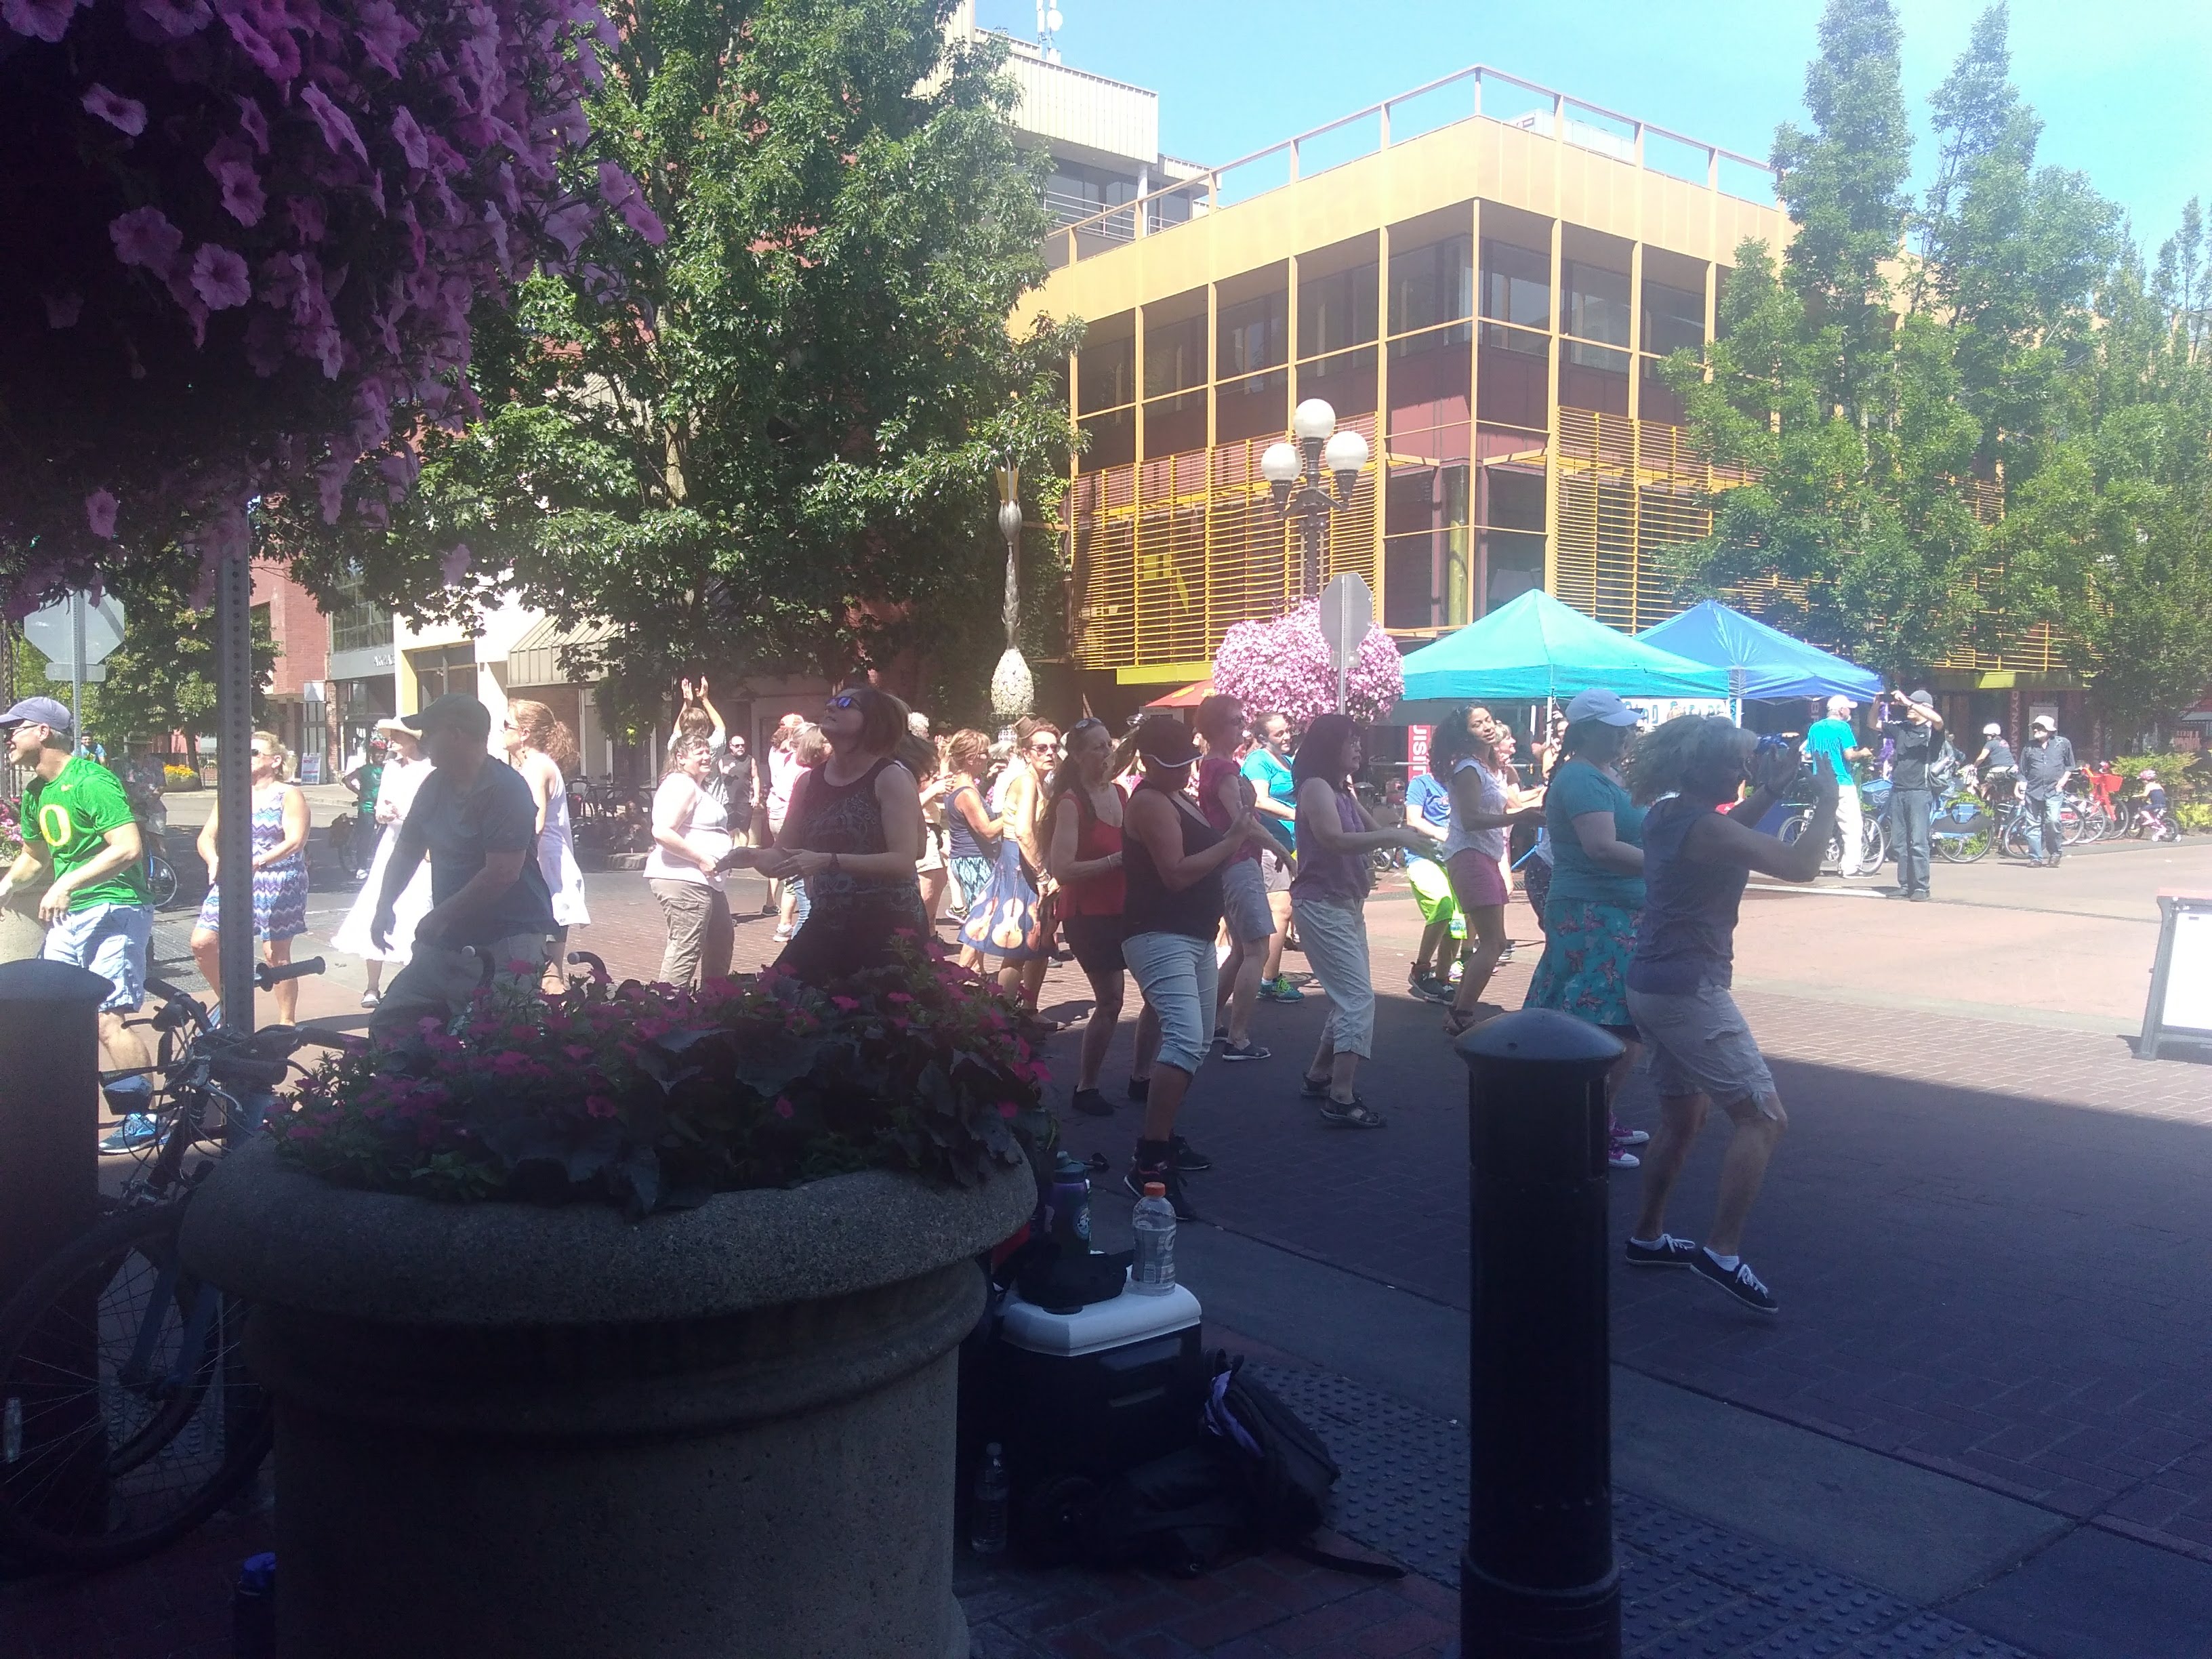
This weekend I visited the Saturday market that is famous here in Eugene, it was nice but too hot. I also spent some time reading the "Manga" of one of my favorite animes ( If you know the anime, maybe you'll recognize it in the photo). The best part of the weekend is that I listened to a lot of singers in an event called Eugene Sunday Streets and I saw the parade of the event. It was so much fun, I loved all the people dancing and singing in the streets.

Organized codes, organized data !
July 17th, 2018
The time is running out and I feel that there is still a lot to do. Last week, I organized all my codes and created some functions to make them easy for us. Then, I started organizing the Colombia data and I eventually loaded it. When I was finally ready to run my data into the logistic regression model, I found an error in the features code, so I had to go back and fix it. It took me a while because there was a problem with the filtering data. I didn't take the correct low-frequency boundary (which I believe was the right one) and this was one of the first steps.
After that, I started running my data but my algorithm was incredibly slow, so I modified it to get a better run-time. Currently, the algorithm seems to be working fine, so I can extract the inputs of the data and run it into the model for predicting the tremor. I feel very nervous and I worry about how the code is going to work with my data. Please stay tuned and I'll tell you how we are doing with this.
Most of my time I've been coding and not too much about reading papers, so I still need more of the tectonic tremor theory, although, there's a paper from Reynen and Audet (2017) that has been of help in understanding how the machine learning works and the extraction of the features. Here is it: https://doi.org/10.1093/gji/ggx238 .
Additional fun work this week!!
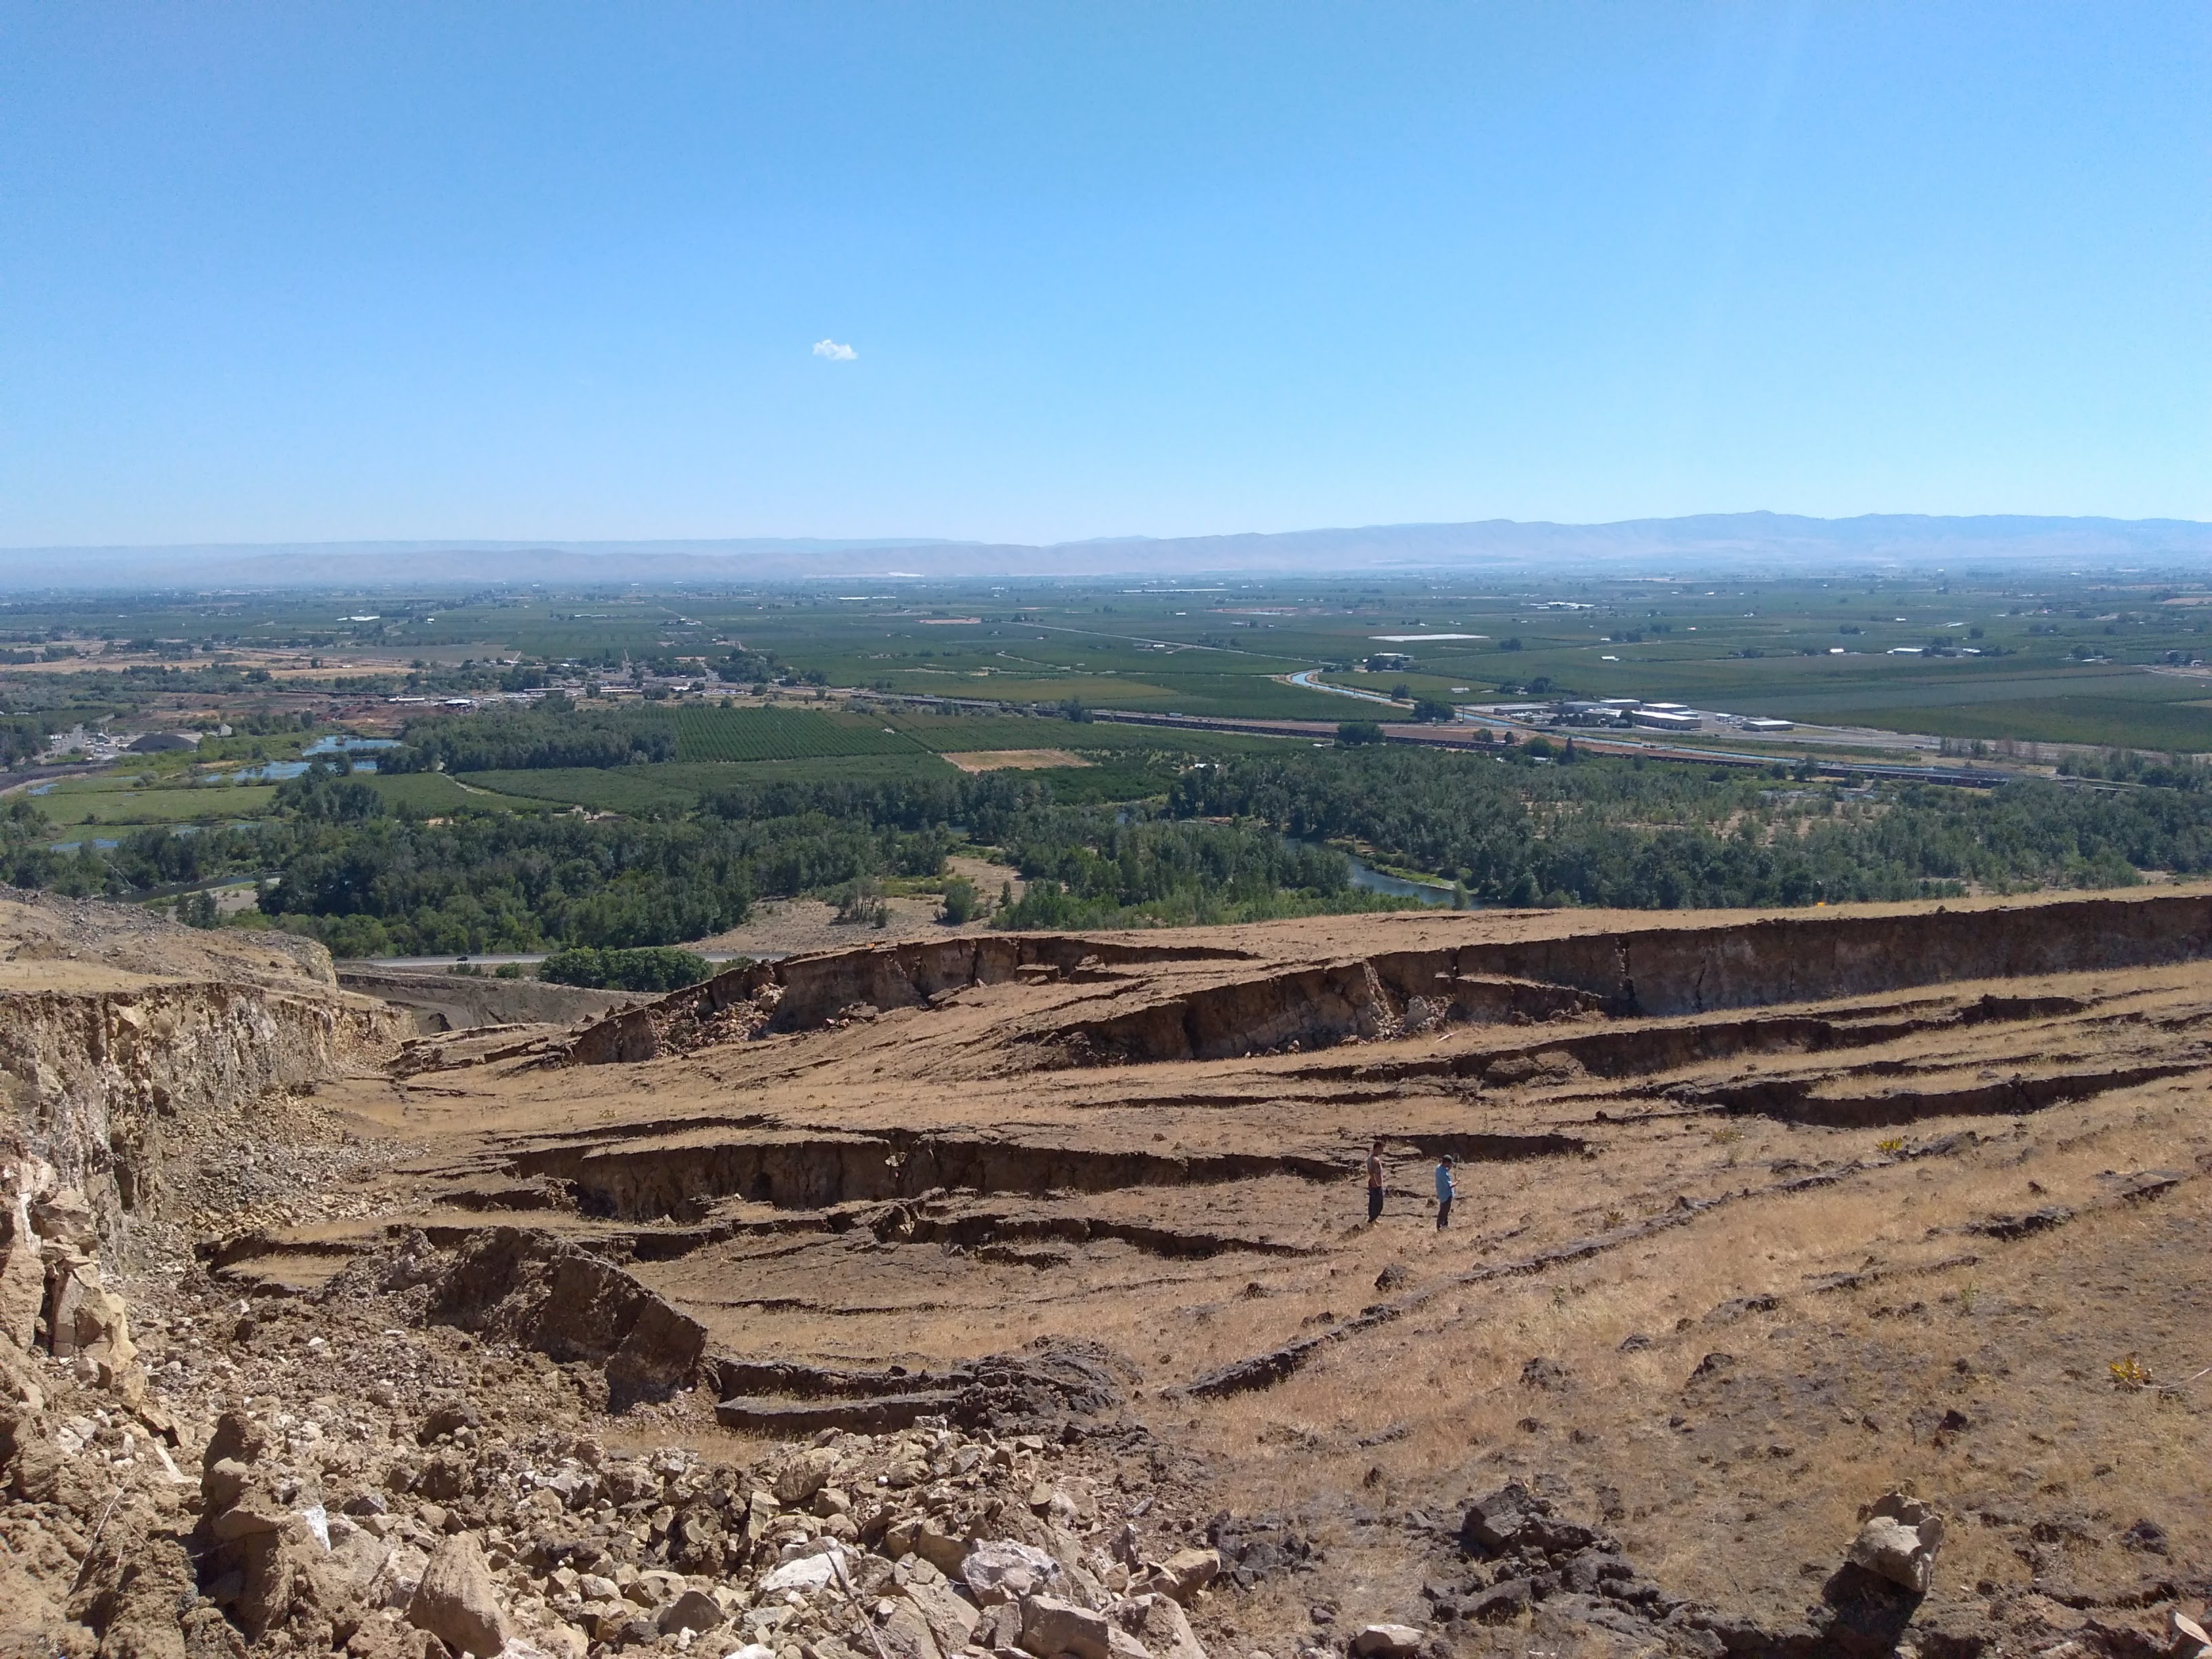
Last Monday, I went to Washington with Alex (a graduate student) and Ty to a landslide that my advisor has been monitoring. There, we deployed around 40 seismograms. This landslide has been moving ~1 ft per week and it has a lot of big cracks that are more than 4 ft deep. It was really hot ( 94°F) and dry there, and being from a country where the humidity is almost 3 times the humidity where we were, it was a little difficult staying all afternoon. Overall, it was worth it the heat because the view from the top of the landslide was awesome.
Week 5: Halfway!!
July 9th, 2018
This week I've been finishing up the tasks that Amanda (my advisor) told me to do before she left for her vacation time. I thought that I wouldn't be able of finishing them all, but on the last day before she comes back, I finished them. What I did was to build a code for extracting all the 'inputs' for our logistic regression model, so I calculated the averaged value of our 4 frequency bands and the DOP of the samples selected, then I plotted a histogram of the DOP values for the noise, tremor and earthquake samples that is here:

How I explained in the last blog, the DOP is a measure of how much the ground is moving in a given direction, so this histogram is interesting because we can see that most of the noise samples have the lowest DOP values, and the earthquake samples have bigger DOP values, differentiating from tremor DOP values, what makes sense with the meaning of DOP and also means that the DOP is a good 'feature or input' for training our model.
After having all the features, I started training the logistic regression model using scikit-learn Python's library. At first, I tried with a binomial logistic regression model, so I labeled the data as tremor= 1, noise= 0 and earthquake=0, then I split the data into a training dataset and a testing dataset (30% of total data). Finally, the classification accuracy for this model was of ~70%. Then I used a multinomial logistic regression, so I labeled the data as tremor= 1, noise=2 and earthquake=3, I applied the same process for this model and I got a classification accuracy of ~81%. As I've trained the model with 5 features, I can't visualize it, there're some ways of plotting the training model but losing information, for example, I tried principal component decomposition, and it works well for visualizing the data (I'll show some figures the next time). I still need to play with and understand more the accuracy values and look how it changes with the regularization term in order to avoid overfitting or underfitting (note: the regularization term is a parameter that penalized the model "against complexity").
Our next step is sorted the Colombia data for using in the model and see if we're able to observe some tremors in it.
In other news, this week Ty and I went to one of the seismic stations in Oregon that belongs to the Pacific Northwest Seismic Network, we learnt a lot there, Leland who coordinates all the stations in Oregon, taught us how it works, this station has a broadband and a shortband seismic instrumentation; we helped them changing some of the wires there, but they still have a lot of work in that station because there was a problem with some tube of a wire, I'm surprised that they are just three persons for taking care of all the seismic stations in Oregon and they should visit at least one station per week. Ty and I had a great time there, the view was beautiful, here is a picture of the place.
This week I also tried to make my elevator speech (one of our internship assignments), it was easy beginning with the speech but then, when I tried to explain more about the project the things turned difficult, the hardest part is selecting what to say and what not without losing the essence of the project and of what one wants to convey.
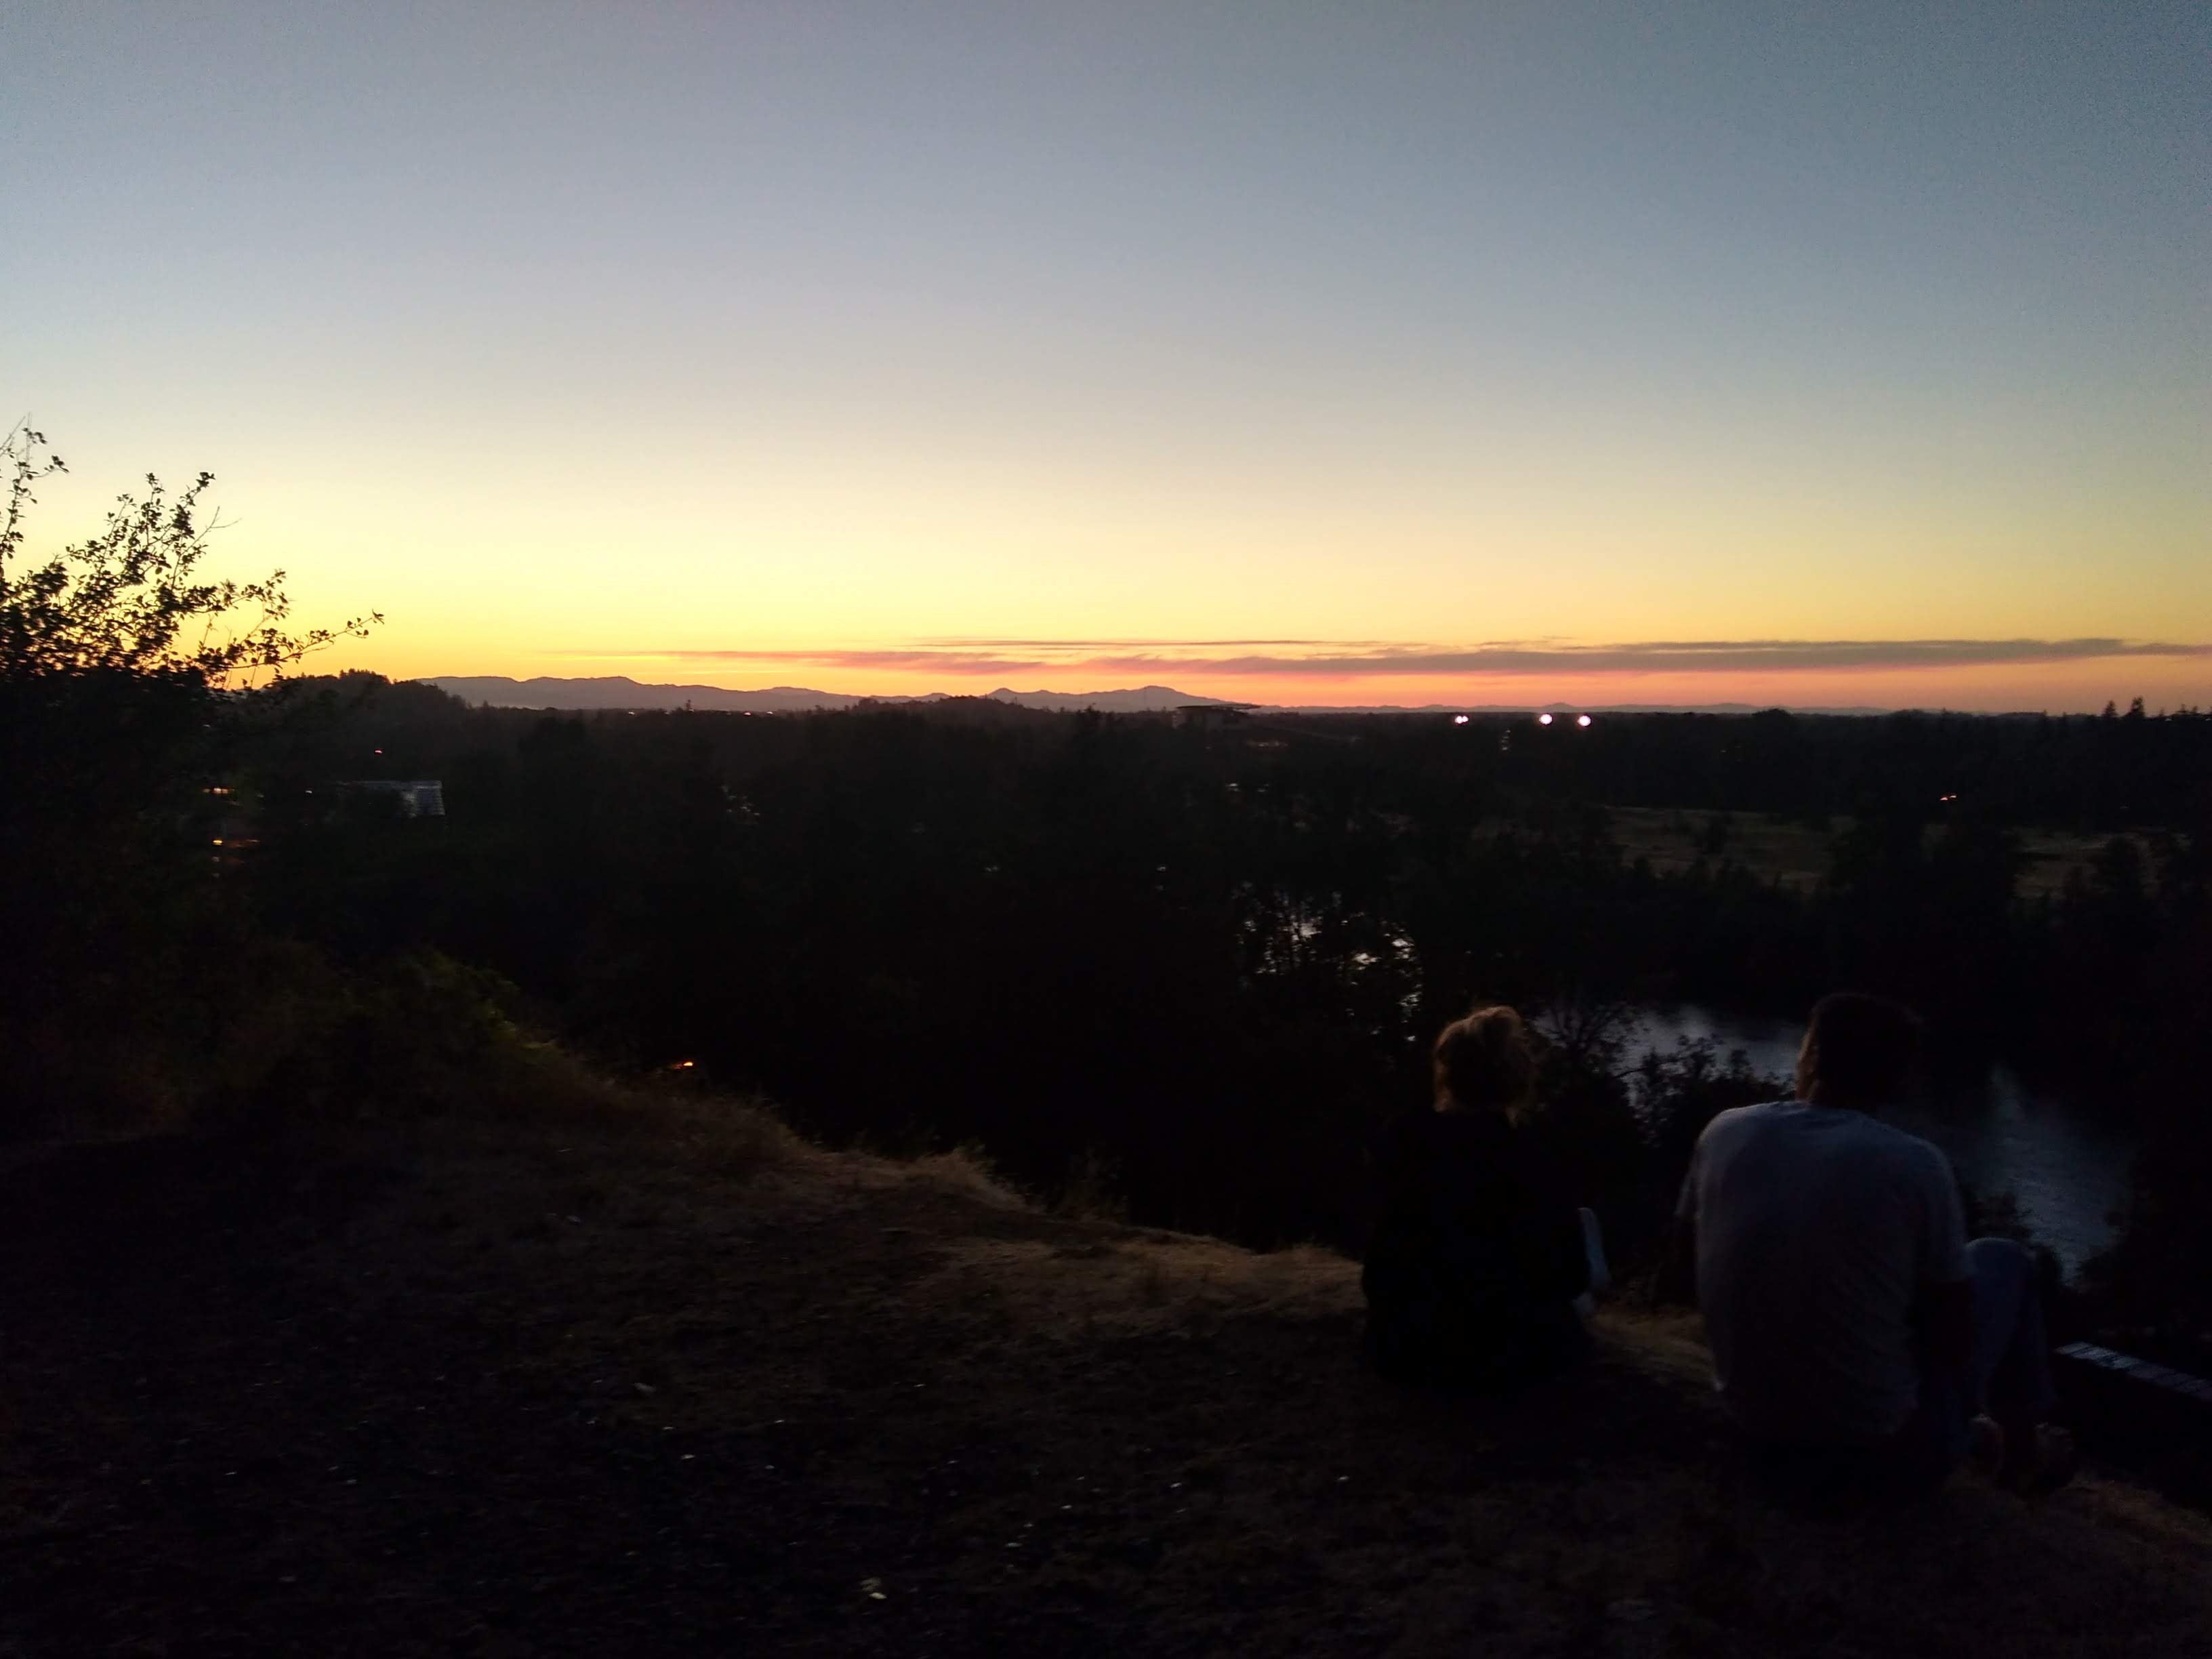
MORE FUN!! I went to the pool in the recreation center of the university and I love it, I also visited Hendricks park and Skinner view that is inside the town, I really enjoyed because this place allows you to view the sunset perfectly.
Week 4: Collecting samples…
July 1st, 2018
During this week, I've been collecting all the noise, earthquakes and tremor samples that are going to be used for training the model and finally detect the tremors, I had to check every sample visually for confirmed that it corresponds to the type of labeled signal. It sounds like a boring work to do and it's true! ahahha, nevertheless, it's one of the most important steps in order to increase the reliability of the resulting model. For those samples, I calculated the Fourier spectra but some of them had an unexpected behavior, it was a little frustrating because I had to come back and take a look at the signal's plots, I really didn't understand the Fourier spectra behavior at some of those samples. After thinking a lot about it, I decided to keep just the samples that have considerably different Fourier spectra values in compare of the other types of signal.
What we want to do with the samples is divide their Fourier spectra in four frequency bands (0.5,1,2.5,10 Hz) and calculate an average value of the spectra in each band relative to the others, also we want to calculate the DOP of each sample (this is a measure of how much the ground is shaking in a specific direction). The purpose of this is to use the four frequency bands and the DOP value as inputs for the machine learning (I'll give you more details later).
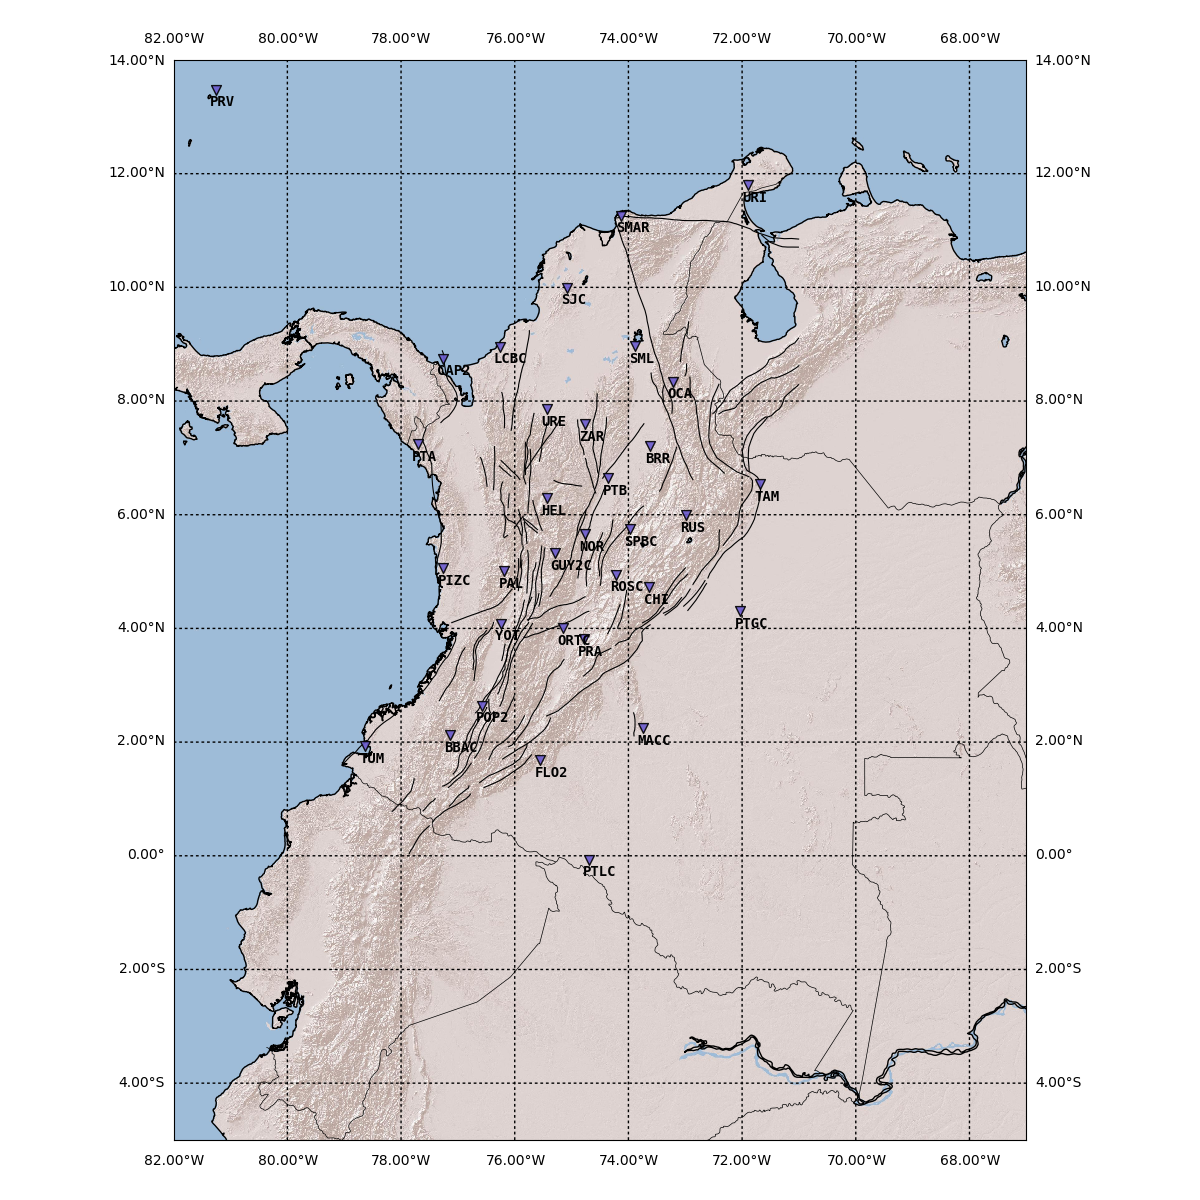
I made a map of my study area in Python using Basemap, I decided to use this library because there are a lot of tutorials available on Internet and is easier because I've been manipulating my data with python, so it's better just to use one coding language; however I tried to plot a map on GMT, but I think that the coding language it's more difficult than python's language, so I finally chose Basemap. Here is a map of Colombia (my study area), I tried to plot the tectonic setting but I could only get the shapefile of the main faults in Colombia, I'll try to have the tectonic setting map the next time.
Week 3: how does tremor signal look like?
June 25th, 2018
After don't see any "clear" tremor signal in the seismic stations located in Washington (from the Pacific Northwest Seismic Network, PSNS), we tried to look for it in the stations located in Oregon, where we finally could observe the tremor, it was evident that several stations were showing the same signal at the same time and I felt so happy for finally seeing the expression of the tremor in a plot made by me and not only in a paper. Then, we started to extract some 5 minutes samples not only for tremors but for noise and low magnitude earthquakes with epicenter nearby the stations in order to make plots in the Fourier spectra and define the bands of frequencies in which we can observe the most difference between the tremor and these other seismic signals. At first, I made the Fourier spectra plot with one sample of each type of seismic signal, but the resulting plot didn't have any sense, so we re-made the plot with several samples of each signal type, but it wasn't clear again. After that, I tried smoothing the data with a moving mean and then with a Savitzky-Golay filter but we are still working on improving the plot.
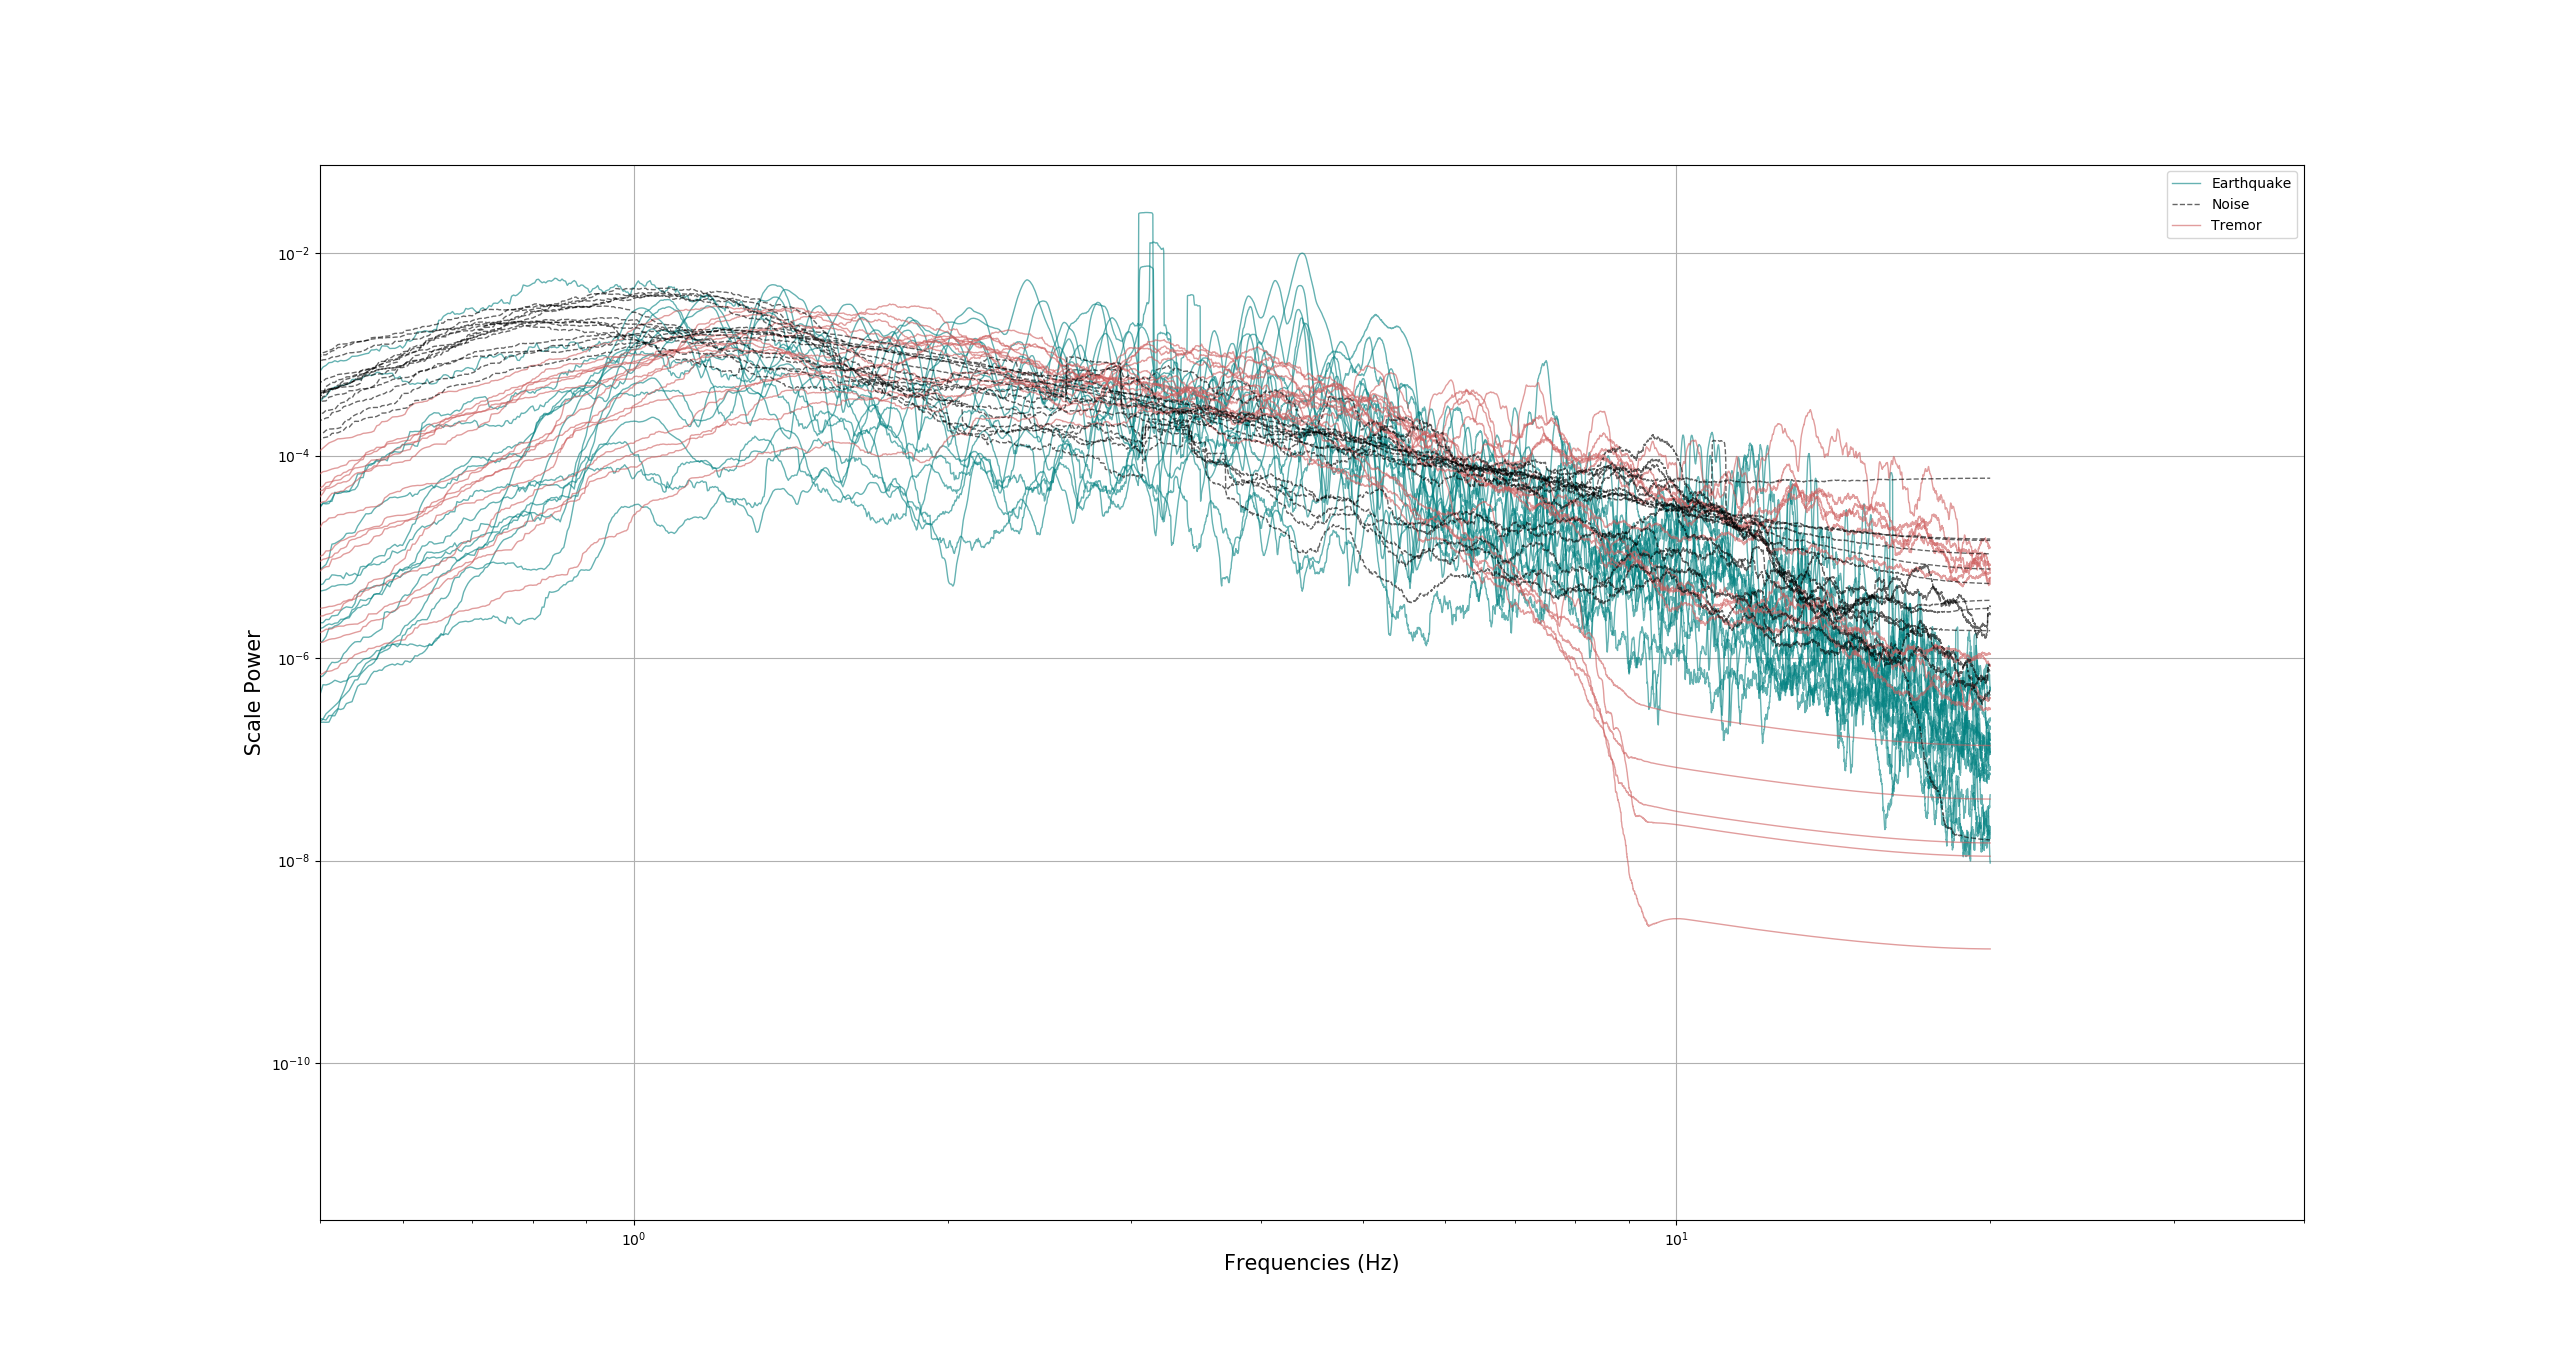 --> Plot of an Fourier Spectra, this is the plot that I have to smooth (:/).
This week I also went to the Jordan Schnitzer Museum of Art, I don't really know too much about art but here is a picture of what I liked most:
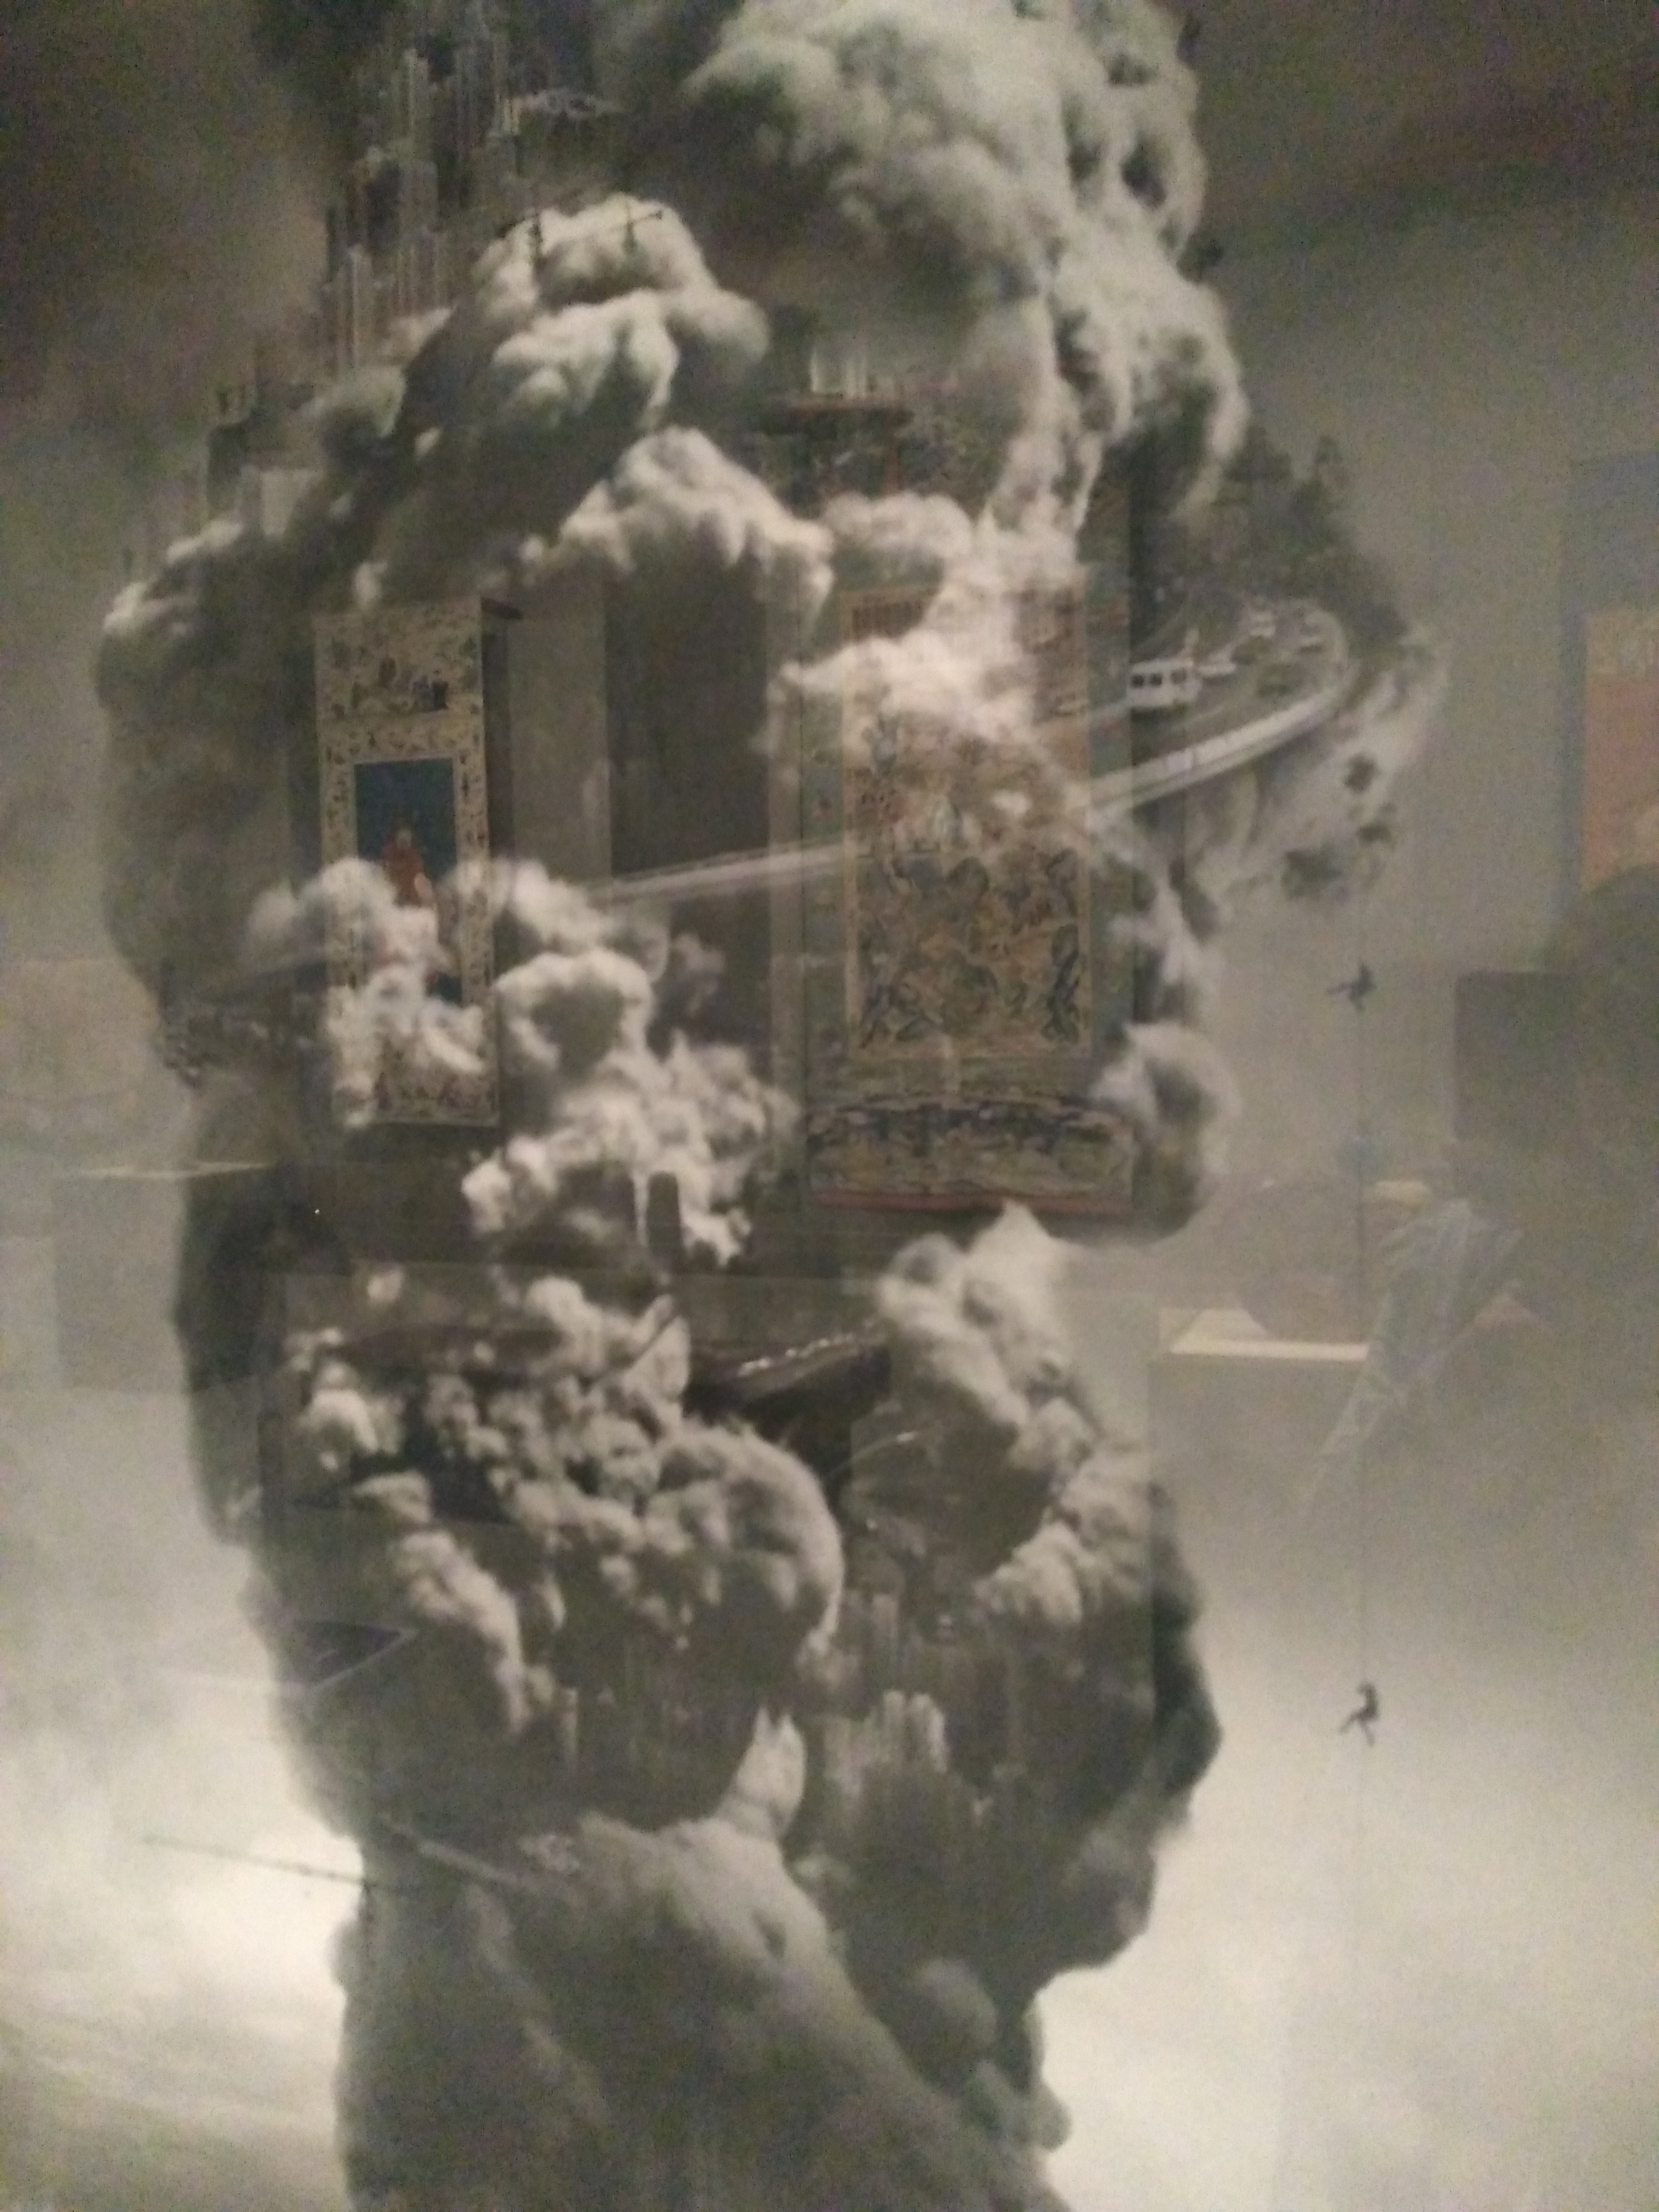
It is an inkjet print represented a heavenly city (by Yang Yongliang). Later I was in a place from where I could see the sunset, near a bike path. Eugene is the perfect place for those who want to live in constant connection with nature.

And of course, I also watched Colombia vs Poland soccer game. So happy because we won!.
Trying to identify tremors (First step)
June 17th, 2018
This week I've been looking at some events of tectonic tremor in Cascadia, in order to find the "features" for training a model and detecting the tremor using machine learning. I've been requested some data from the Pacific Northwest Seismic Network based on the date of the events in the catalog of tectonic tremor in Cascadia ([url=https://pnsn.org/tremor]https://pnsn.org/tremor[/url]). With the data requested I tried to identify the tremor in several stations but it's still difficult for me to do this in the seismographs, so I plotted the spectrograms (with Obspy) of some of the traces requested for analyzing the variation with time of the signal frequency content and the tremor seems to be a little more clear, nevertheless we have to be sure that our feature is a tremor because the behaviour of the model depends on that . This week, the progress was a little slow because I had to deal with some difficulties in trying to get some python packages installed along with other errors in the codes.
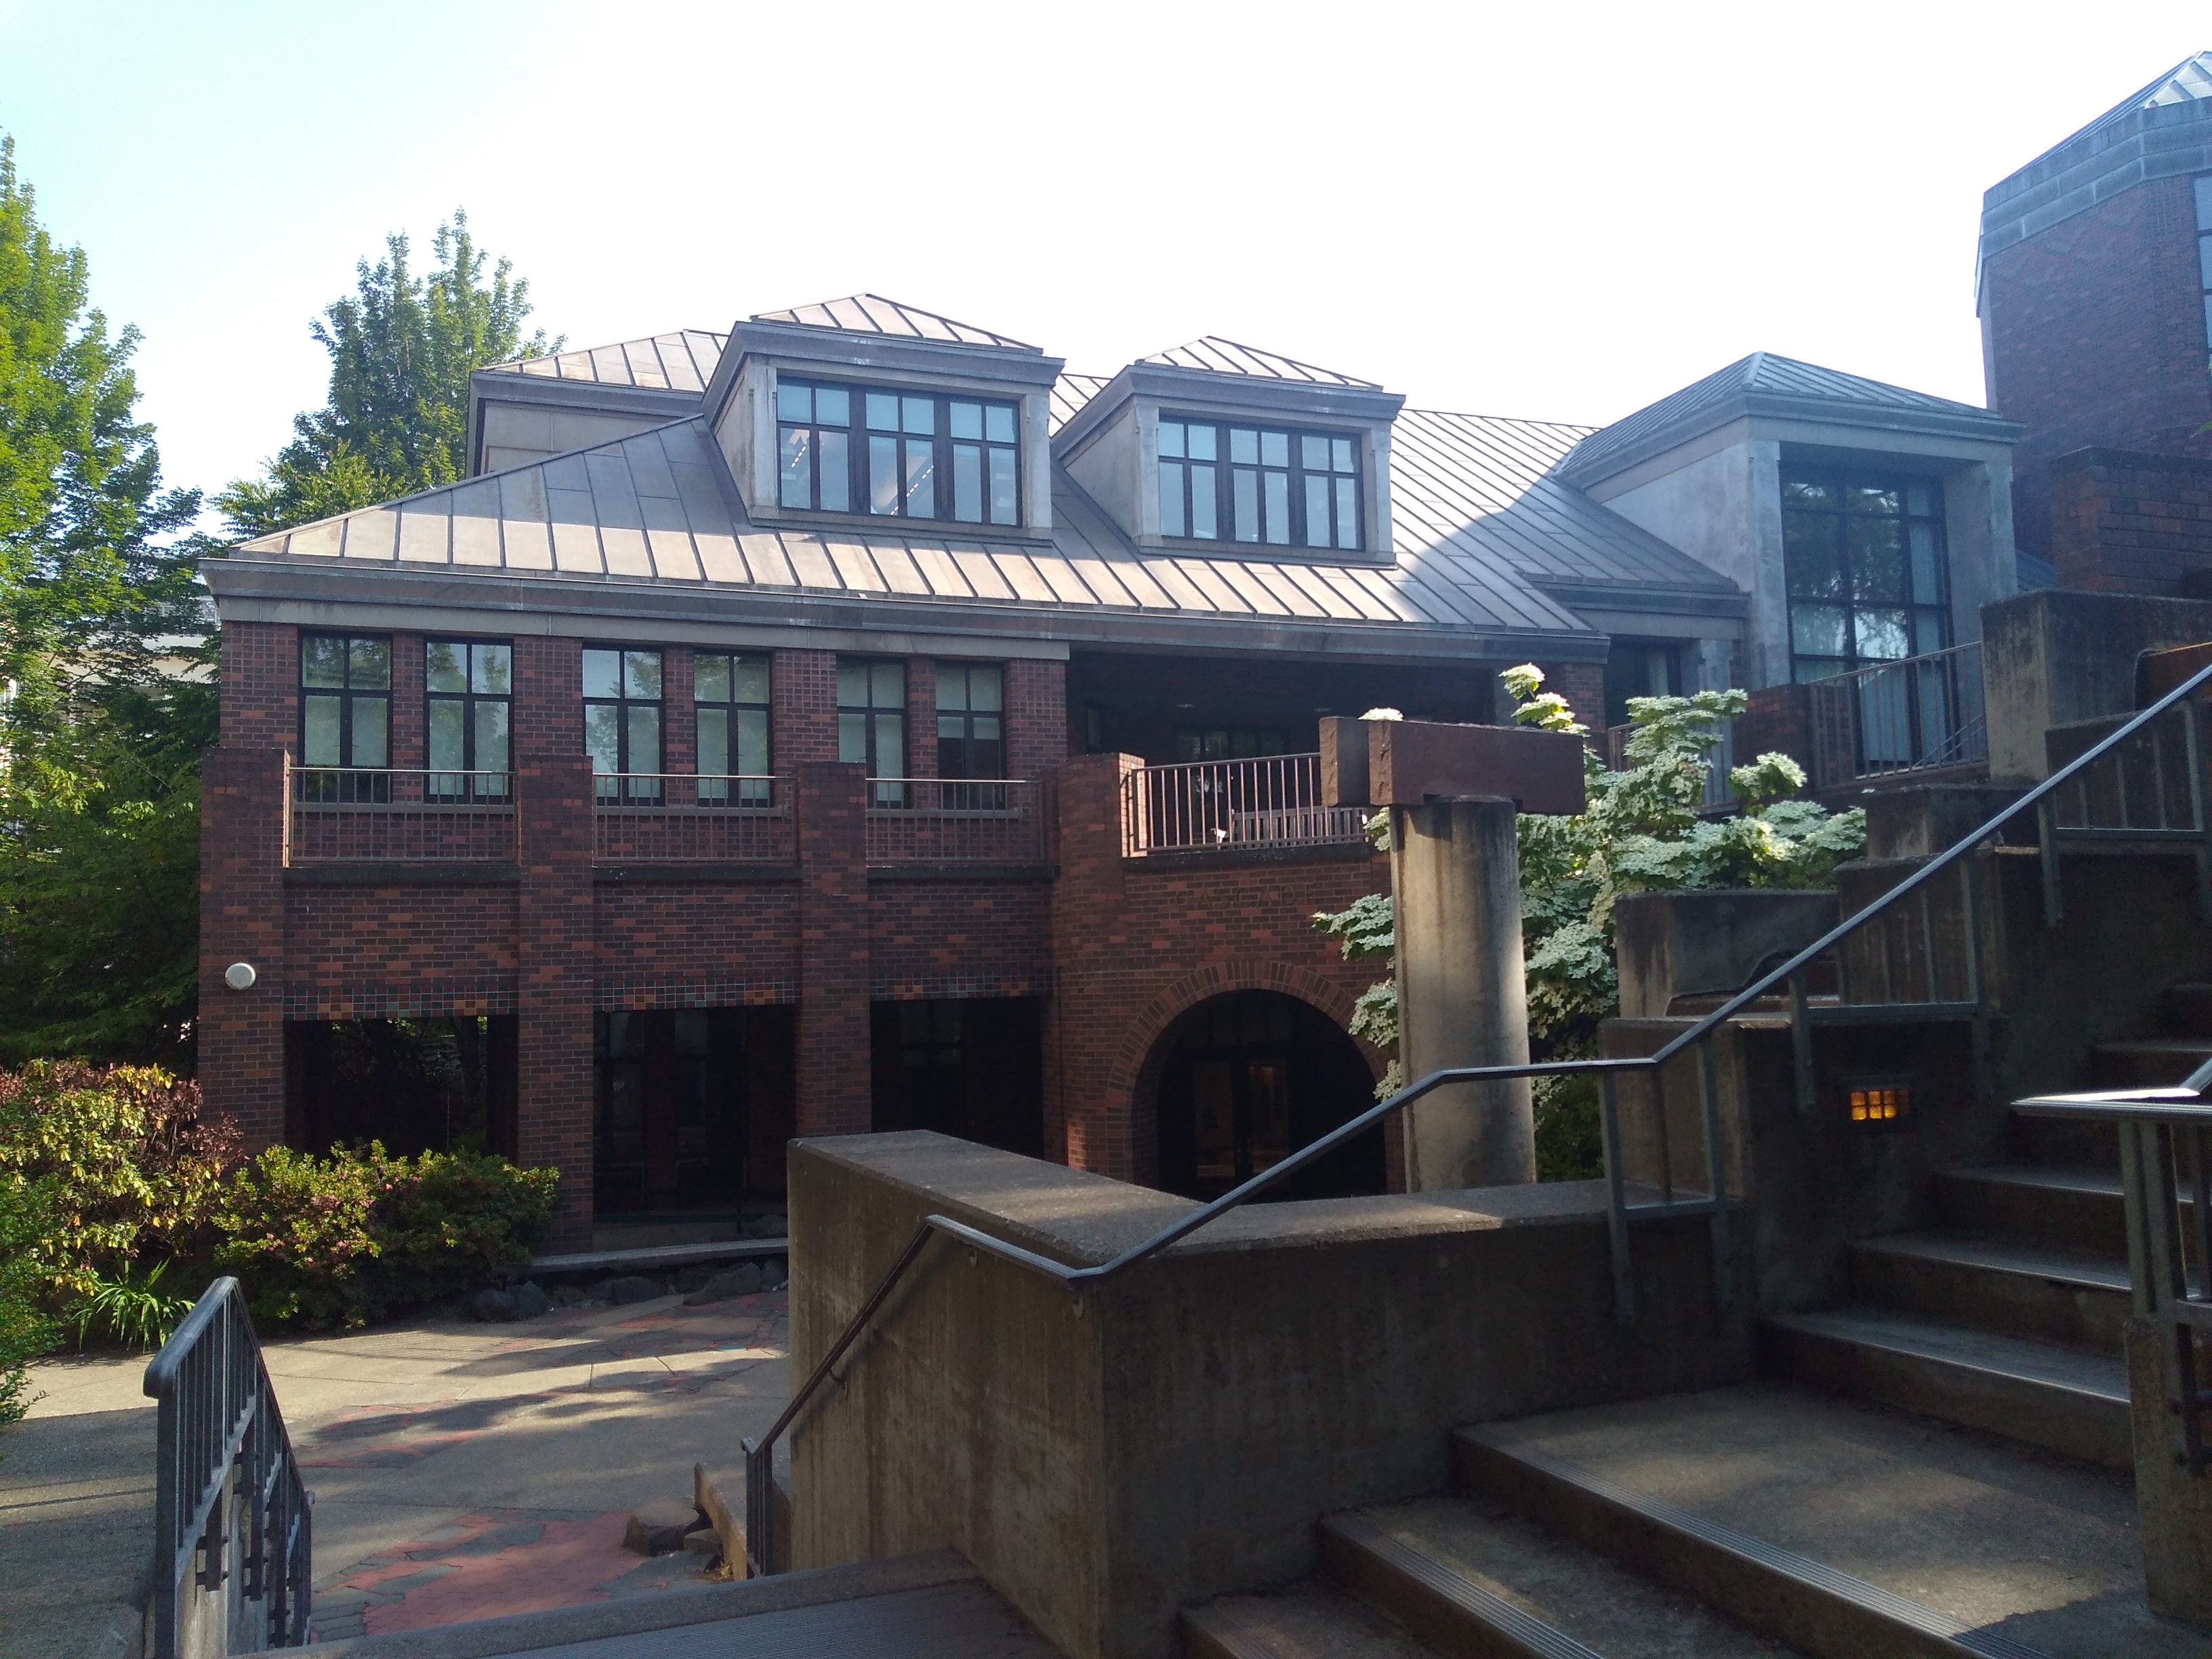
This place continuing being amazing for me and people here are very friendly, even the walk to the office in the mornings is nice (I attached a picture of it).
The beginning of a new experience
June 9th, 2018
Hi!
I'm Mariana, an international IRIS intern from Colombia.
Last week I arrived at Eugene airport in Oregon after a great orientation week with other 18 interns, one of the best weeks ever!! but also I had days filled with worries because my bag got lost in Dallas Airport (I recover it 4 days later). After that, I had a crazy trip because I almost missed my connection flight to Eugene, but I finally got on the plane!.
So now I'm in this beautiful town in the NW of the United States, I live in an apartment near the University of Oregon with other intern and now friend: Ty, and other two girls. This week has been so difficult because of all the process of adapting myself to another culture and for trying to filling out all the documents for my payment, but at the same time is awesome to be able to live this experience.
I met my mentor (Dr. Amanda Thomas), and I started trying to grasp the theory of my project and how could I use the data from the National Seismic Network of Colombia to detect tectonic tremor with some supervised machine learning, I made some tutorials and read the basic theory of machine learning. My main goals for this summer internship are: (1) Getting a well understanding of the state of art in tectonic tremors (2) Developing algorithms for tremor detection and (3) linking the results with the tectonic setting of Colombia.
Furthermore, I met the grads students that work with my mentor (Tyler, Alex, Tim, Emily, and Geena) and they are great, they are so nice to me and Ty. It's so good to be here and I'll try to get the most out of this internship, it's exciting to think about all the new experiences that are going to follow it.


