Lauren
Lauren is a student at Rollins College currently completing her research at Brown University under Dr. Colleen Dalton.
Ambient noise often caused by ocean waves and other natural phenomenon can be detected by seismometers and provide information about Earth's structure. Using data collected from 2014-2018 by the USArray Transportable stations in Alaska and measuring Rayleigh wave phase velocities over a 5-25 s period will provide information about the Earth's crust.
Week 8: A Week of Podcasts
July 29th, 2018
Week 8, aka, the most busy, productive, and chaotic week I’ve had this summer. As I said in my last blog, on Friday I started my first Matlab code to run for Aug 2014 to June 2018. Now, when I got into work Monday at noon, the code was still going to run for a while. In the end, it took 78 hours and finished Monday around 6pm.
Thus, Tuesday morning I was very excited to see that it had finished and saved. Now, this is where things began getting chaotic. Of course, I checked a few things to make sure that everything worked okay but somehow, I overlooked checking the number of files had saved before I began the next program. Pretty quickly I realized that I was missing multiple station pairs. Upon further inspection, only roughly 7500 pairs had saved instead of 19110. Now, in my defense, the files that saved, or didn’t save, appeared to be random. All of the TA stations have a 4-digit code that starts with a letter. No specific letter or string or string of stations were missing, nor was it based on pair separation. Everything appeared random. Of course, my first instinct was to panic because I was running out of time to finish the project. However, it was concluded that for now, this was still a large enough data set since it was a random selection. So my mentor and I decided that we would expand the distance range to 150-600km. When we have all station pairs this will give us over 6000 pairs but right now we have around 2800. Since this would still take me all week to pick and process, and I needed maps by this coming Wednesday, we decided to run with it and work out the rest of the stations during the school year.
Now, the fun part of my week, ie. the part where I listen to podcasts for 4 days straight while picking points on ~2800 graphs. I don’t know if anyone is still invested in reading these blogs anymore, but this was a very exciting week for me. But first, let me explain a little bit about me. I get distracted very easily if I’m not doing multiple things at once. I am often that annoying person who is playing games on their phone or coloring while watching tv, or doodling during lectures. So very quickly, I realized that I needed something to keep my mind occupied while looking at hundreds of graphs. I’ve been told this happens to a lot of people and that podcasts are great. I have never been that into podcasts because I’m much more of a visual person than audio, but I figured, I’d give it a shot, and let me tell you, it was a fabulous decision.
Through podcasts, this week I learned a lot about Mars, laughed at Hank and John Green, was intrigued by a murder mystery, and learned about the disappearance of the Korean flight in the 80s. But by far my favorite podcast I listened to was one called The Story Collider. This podcast tells real science stories and it’s amazing. People tell stories from their PhDs, from field studies, of dealing with diseases, experiencing discrimination, etc. It’s so fun, very uplifting, and I love everything about it. Honestly, it just makes me want to tell my story (but I’ll wait a few more years for that). I’m aware that I’m behind on the podcasts movement and no one cares, but I highly recommend it! Also, Hello PhD seems like a good one to listen to in the future if I decide to follow that path. So thank you podcasts for keeping me sane during my very monotonous task this week.
Now, back to research. I finished inspecting and picking all of my points from my graphs at 4:50 Friday afternoon, just in time to quickly make a few maps. I was able to run my first program that calculates phase velocities and then categorizes them by period. A few of these preliminary graphs are shown in Figure 1. Then, I was able to use a code that my mentor has used in many other projects to make phase velocity maps for 10s and 25s (shown in Figure 2). This was a very exciting break through and I’m feeling much better about having results to put on my poster for the Brown symposium next week. All of the maps I’ve posted here are very preliminary and I still have a lot of analysis to do in order to try to understand what they mean, but it’s a great start.

Figure 1: Phase velocity maps of Rayleigh waves in Alaska at periods of 25, 20, 15.4, 10, and 5 seconds. Each dot is found at the midpoint of two stations and the color corresponds to the average phase velocity between the two points. Slower periods appear to correspond to slower phase velocities and the nothern part of Alaska has faster phase velocities.
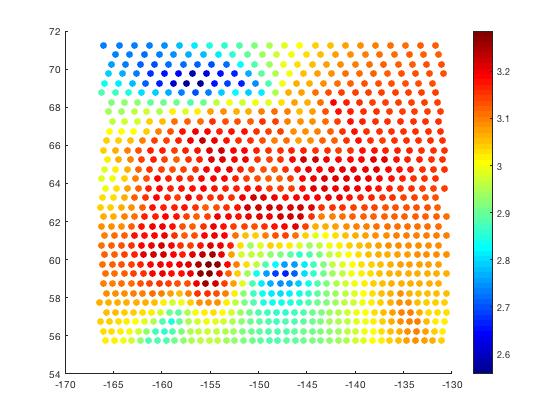
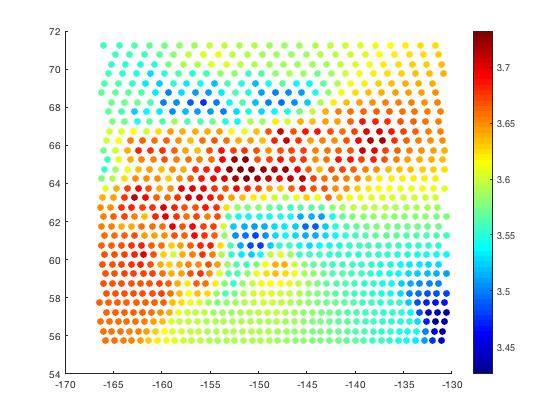
Figure 2: Phase velocity maps at a) 10s and b) 25s. Smoothing peramertures have been applied.
To wrap up this weeks blog, for my last weekend I went to see Shakespeare’s Much Ado About Nothing in the park with some of my housemates Saturday night. It was very funny and a great time outside. After, we ventured down to WaterFire which was fun because this time we went to the main hub where most of the action happens. My favorite part was that you could rent a kayak to paddle around the river, between fire cauldrons, with a giant LED fish on top. This is now one of my life goals to be a fish kayaker. The on Sunday I went to café down the street from me and spent some quality time in nature working on stuff and relaxing. Now to prepare for an even busier final week!
Week 7: Forward Momentum
July 23rd, 2018
Things are starting to fall into place! This week we spent a lot of time making sure that our codes were all set and ready to run on the full data set. For most of the week I was using my cross-correlated stacked spectrums from Jan 2017 to June 2018 since this was a long enough (but not too long) time frame with all of the stations.
From our phase velocity maps showing the different zero crossings, I can now hand pick the data points that we want. So if a pair only has good signal for long periods, I can select just those points. Or if there is a weird discontinuity somewhere, I can pick two different sets of data points. While this will take a very long time, I actually find it kind of fun to inspect every trial and hand select the points we will be using. Luckily, we cut back our sample from 19,110 to just under 5,000 by limiting the distance between two stations to be between 200 and 500km. This range was producing the most reasonable samples given our methodology. While sorting through 5000 graphs will still take me a few days next week, my mentor and I agreed that this was the best way to accurately sort through the data and as I said, I even find it kind of fun.
I also wrote a code that will go through each file of selected points from each pair and categorize the phase velocities measurements by frequency. In the end, we will use this to make our phase velocity maps. Right now, we have just been testing it out by using the midpoint between the two stations and the graphs look amazing so far! Interesting finds include that the longer periods correspond to faster phase velocity and the north has slightly slower phase velocities than anywhere else. Of course, these are very preliminary, but my mentor and I were both very excited to already see trends forming! Unfortunately, I forgot to save or screenshot any of these, so I will have to post them later on in the week. I also finished up my abstract this week for the Brown symposium and AGU.
This week we are supposed to reflect on some of the challenges we have faced and how we overcame them. I feel like I’ve already talked a lot about the summers challenges in my blogs but it’s still good to reflect on the whole. At the beginning, I struggled a lot with the coding aspect (still do quite often but less now). I think patience and persistence helped me get better. A lot of times I just want to give up but if I take a little break from my code and then go back to googling or ask for help, then I can usually solve the issue. I also struggled with understanding the big picture and conceptual parts of my project. But after a nice conversation with my mentor, we were able to patch up a lot of those holes. My mentor has said that she is happy with my progress this summer and overall, I think I’m pretty happy with it too.
This weekend I took a quick trip home for my birthday which was really nice. Got off to a little rocky start with a cancelled flight resulting in a 3:30am wake-up call on Saturday to catch the only open flight that day. But going home was nice since I got to spend a lot of time with friends and family. Now I’m back, feeling refreshed and ready to finish strong!
Week 6: Quiet Days
July 17th, 2018
This week was pretty quiet at work. My mentor was on family vacation all week and the grad students were either at a conference or were working from home, so most of the week it was just me and maybe one or two other undergrads. Then add in the fact that I spent most of Monday and Tuesday waiting for a code to run that hadn’t run over the weekend. So, I can’t say this was the most productive week, but I did get all of my codes working eventually and processed 18 months of data with all 196 stations. By the end of the week, we had almost everything set up to start making phase velocity maps.
The other things I did this week included making my presentation for Friday, writing my first draft of my AGU abstract, attempting the Up-Goer Five challenge, and reading some papers. I think my presentation, along with everyone else’s, went well. Two minutes is a very short time and I felt like I was talking way too fast, but I was happy with everything I was able to cover in the short amount of time. It was also fun to learn about the other projects that people are working on. As for the Up-Goer Five challenge, this was just something that I thought would be a fun way to force me to really understand every aspect of my project. While frustrating at times, it was a nice way to take a five-minute break from coding and write one sentence at a time.
This weekend my brother and grandma came to visit me, so I was able to do a lot. Saturday, we went to Newport, RI to see a bunch of mansions and the ocean. Saturday night was WaterFire, a Providence summer tradition where giant cauldrons are lit on the rivers in downtown. Sunday, we took a short trip to Boston and toured the USS Constitution, the oldest surviving Navy ship. Fun Fact: a very distant uncle, Edward Preble, was captain from 1803-1804.

Week 5: We’re Half Way There
July 8th, 2018
I have successfully reached and surpassed the halfway point for the summer! While the first few weeks were almost painfully slow, the last two weeks have really seemed to pick up pace a little bit. This week was a little hectic just because of having Wednesday off for the 4th and then preparing for Colleen to be gone all next week (had to make sure all 3 undergrads, 3 grad students and 2 post docs were prepared for the week!). But overall, I felt like this week was extremely helpful in bridging some of the gaps in my understanding and setting up for the next (and possibly final) stage of the project.
My main goal this week was to collect and process all of the data from August 2014 to the end of June 2018 for the 196 Alaska TA stations. This took most of the week because A. it’s a lot of data, and B. because there first was an issue on the backend of the DMC that had to fixed and all of my requests reprocessed and then we had some memory/storage issues with my computer. Luckily everything got worked out and I now have all of the data needed to make my phase velocity maps next week.
This week was also good because Colleen and I were able to have a nice discussion about my progress so far this summer. We discussed what I’ve learned and things I’m doing well at and I finally got to ask a lot of the questions I’ve been having. I think this was really helpful at getting us both on the same page again moving forward with the project. She also gave me a couple of papers to read to help me understand the “why” of the project, which I’ve been struggling to understand. We also had a little bit of time at the end of the week to talk about what should be included in my mini presentation at the end of next week which was helpful.
Speaking of presentations, a couple of weeks ago, our assignment was to work on an elevator pitch and I keep forgetting to reflect on it in my blog. Having done science fair since 7th grade, the concept of a short 1-2 minute speech about my research is not something unfamiliar to me. However, it was a little difficult to write one at the very beginning of a project instead of at the end. I easily came up with a general description of my project, but I wasn’t very satisfied with it for the first few weeks considering I didn’t really understand what my end goal of the project was. Now that I’ve discussed my project in more detail with Colleen, I feel like my elevator speech has improved and will help me prepare my presentation this week.
Fun of the week: We had two different group meetings this week, a surface wave paper discussion and our bi-weekly seismology group presentation. I learned some interesting new concepts from both which was fun. For 4th of July I went to the City of Providence fireworks display which was a pretty spectacular show! Finally, this weekend I went to the zoo, and Natural History museum and planetarium, and anyone who knows me knows that I adore planetariums! I’d say it was a pretty good week.

Week 4: We Have Lift Off!
July 1st, 2018
Finally, after three and a half weeks, we finally have something that seems to be working! After last week when a lot of our results weren’t making sense, we decided to go back a few steps. First, we modified our seed-to-sac file so that each day was split into 4-hour time segments that would then be cross correlated and stacked. Then, we had to modify our Matlab files. Instead of performing one-bit normalization, bandpassing the signal and then cross correlating, we switched to Ekstrom’s method where the spectrum was normalized, had spectral whitening, and was cross correlated all using one equation. When this stacked signal was smoothed, it looked much more reasonable. From here, we determined the zero crossings and phase velocities like before. Good news! Graphs of the phase velocities looked amazing and very close to what we expected! A sample of the smoothed spectrum and phase velocity plot of one station pair is shown below.
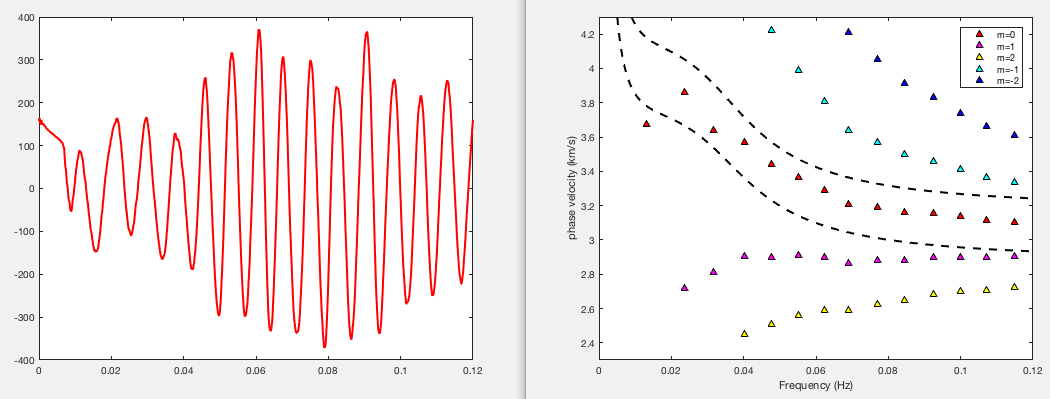
Figure 1: For station pair C27K-H27K from Oct 2016-May 2018 (a) is the smooth spectrum with frequency in Hz on the x axis and (b) is a graph of phase velocity (km/s) v. frequency (Hz). The colored triangels represent how the zeros from the spectrum were matched to the zeros of the Bessel Function. The dashed lines represent the "reasonable range" as indicated by literature.
(I can almost hear my current and past science teachers/professors yelling at me for not having the one graph labeled but these are extremly preliminary results).
The interesting thing is that some station pairs look better than others. Stations that are ~300-400km apart have the best signal but 200-600km still produces realistic plots in most cases. Any pair with a larger separation has poor signal. This seems reasonable though and follows the Ekstrom method which limited their study to 50-300km.
Next steps: retrieving all data for 190 stations from 2014-2018 and processing.
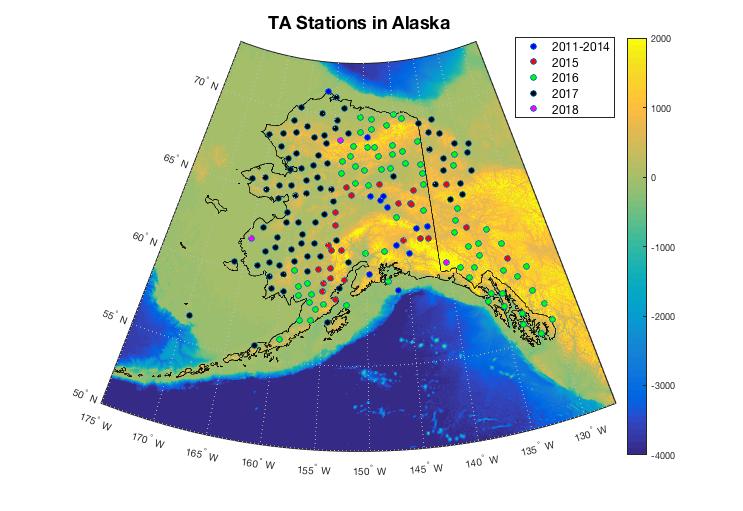
One of our IRIS tasks this week was also to create a map of our subject area. This was a fun project for me even though it was extremely frustrating for a while. My map was made using Matlab and the usamap feature. I also downloaded a topography file to make it look it nicer and more interesting. Each marker on the map represents a TA station that I will be using for my analysis. The colors represent what year the station was installed.
Fun time! On Monday the Department of Earth, Environmental, and Planetary Sciences (DEEPS aka where I work) had a pizza lunch for all of the undergraduate interns from Brown, Leadership Alliance, and whoever else was around (ie me). It was fun to meet some other undergrads and my mentor brought her two sons who I got to hang out with for a while. Also, I got to go to a Leadership Conference in Nashville this weekend where I learned some awesome information and had tons of fun!
One Step Forward, Two Steps Back
June 24th, 2018
Another slow and seemingly uneventful week. My mentor was attending a deep carbon conference this week and was only around Tuesday afternoon and Friday. My task for the week was to write a Matlab code to identify the zero crossings for a Bessel function and our cross-correlated spectrums. Colleen helped get me started but it took a lot of googling and a little more guidance before we finally got them working. After identifying the zeroes, I was supposed to match them up to determine the phase velocity of the waves. However, the results were not within a “reasonable range” like we expected.
For this project, I am following the procedures (with some modifications to better suit my data) established in Ekstrom’s 2009 and 2014 papers. Thus, we were anticipating getting similar results, but this was not the case. Troubleshooting, I went and collected an additional seven months of data, and then played around with some of the parameters, but nothing seemed to be working. Colleen and I spent almost 2 hours on Friday analyzing my code and couldn’t figure out why the results weren’t making a lot of sense. Finally, we came to the conclusion that this coming week we would go back several steps and replicate his procedure exactly to see if we can get more reasonable results.
This whole process was rather frustrating but nothing out the norm when it comes to research. There’s always bumps in the road and setbacks, but you just have to keep moving along. I think this was just harder for me than normal since the subject area and coding are a little more out of my comfort zone than normal. I felt like I constantly had more questions than answers. But I know that this week was a good learning experience for me and I am optimistic about progress this coming week.
As for weekly fun, the whole lab took a bonding trip to Starbucks on Monday, and I went to the mall and saw the Rhode Island state capital building this weekend!

Week 2: Slow Beginnings
June 17th, 2018
As with any new project, starting is the hardest and slowest part. While this week was productive, and I learned a lot, it felt incredibly slow since my mentor was gone until Friday at an IRIS workshop. Luckily, one of the other undergrad interns knows a lot about coding so we worked together and got a lot accomplished Monday and Tuesday. But then productivity significantly slowed down when we reached a point where our conceptual understanding started lacking. The next couple of days where then filled with requesting and processing data, reading, and fiddling with code. But once Colleen got back on Friday, things kicked back into gear as we got more code written and a lot of our questions answered. Hopefully, this productivity carries into next week.
Since I now have a slightly better idea of what I’m working on, let me explain my project a little more. USArray has a network of transportable arrays (TA) stations that first swept over the continental United States and are currently deployed in Alaska where they will stay until 2019. I will be using the data from these Alaskan stations to learn about the Earth’s structure, particularly the crust. I will do this by analyzing ambient noise which is caused mostly by ocean waves but also other natural phenomenon. From the seismic data I will measure Rayleigh wave phase velocities over 5-25s periods.
All of the data I will be using is raw data that I am requesting from IRIS. So far, I have collected raw data from 20 stations over one year. Eventually this will be expanded to all TA stations over approximately four years. With this data I have been able to remove the mean, trend, and instrument response. After that we bandpass filtered and normalized the data. Finally, we could cross-correlate the data on any particular day between pairs of stations. Next step: measure phase velocities (this will be much harder and more time consuming than these previous steps).
Throughout the summer, we will be asked to self-reflect on some target skills. One skill from the self-reflection guide that I am focusing on this summer is the ability to use computer programs to collect and analyze data. Up until this summer, I had very little coding experience (a little bit of Labview from my research at Rollins is about it). I think in order to be considered proficient, someone needs to understand the languages enough to know which program works best for a specific problem and be able to write their own codes for any given case. Of course, there will still be errors, trials, and troubleshooting, but comfort and confidence with a program is the goal. This coding skill is important because a lot of science is done through these computer programs today. So, while this summer is pushing me out of my comfort zone, I’m happy that I am getting a chance to build on this skill.
Now, for the more fun stuff. Since I’ve been here I’ve done a lot of walking around my general neighborhood, walked along the Seekonk River, found a couple of cute cafes, seen some beautiful houses and architecture, and visited the Lippitt House Museum. The weather has been absolutely perfect, and I look forward to spending more time outside.
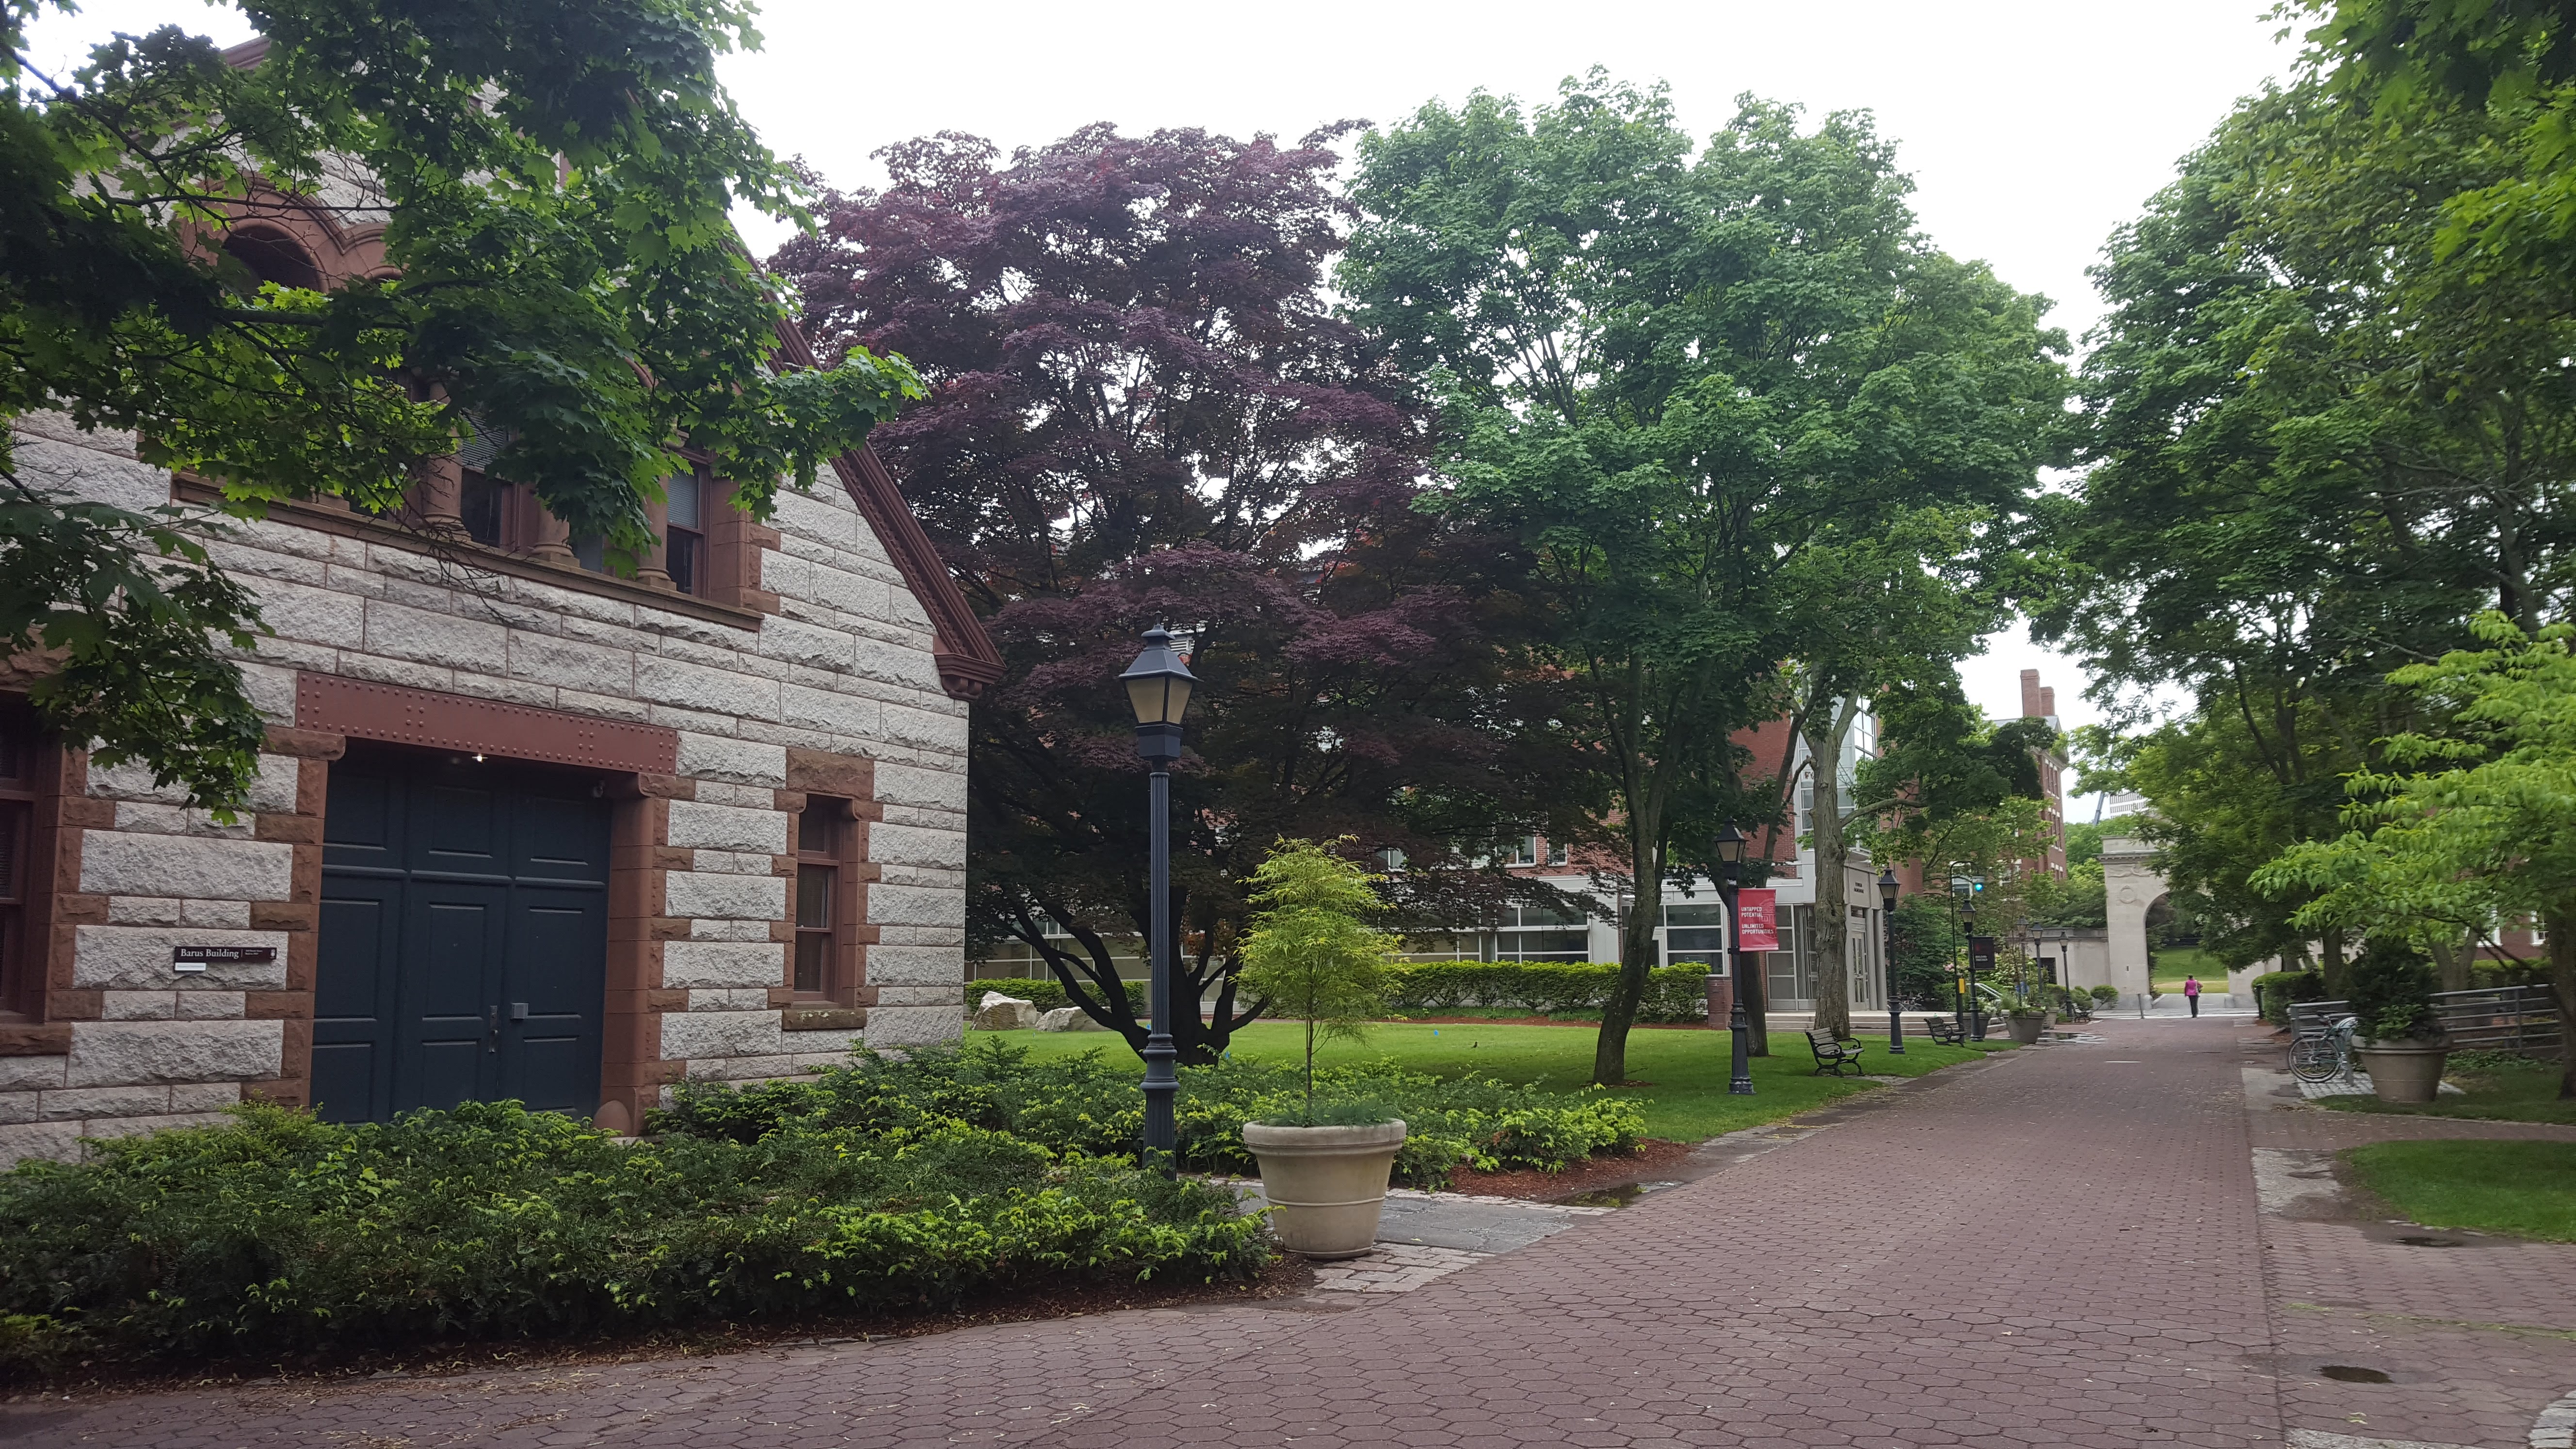
Getting Started and Summer Goals
June 10th, 2018
My summer placement is at Brown University, working with Colleen Dalton. I started working last Monday June 4th, and the week was relatively easy and relaxed. I started the week by reading a few papers and learning more basics in Unix and Matlab. Then on Wednesday we started working on a mini-scale trial project. For my real project I will be looking at data from all of the Transportable Array (TA) stations in Alaska over many years. But to start understanding the codes I will be using, we decided to start small with 6 stations over 3 months, so this is what I worked on most of the week and will continue this coming week.
I have many goals for this summer, some personal and some academic. My personal goals included:
- Explore many different parts of Providence by walking and observing. (already started on this one!)
- Go to a few events and step out of my comfort zone.
- Visit museums and parks, and try new restaurants
- Take lots of pictures and keep friends and family up-to-date
My academic goals include:
- Become comfortable with Unix and Matlab
- Learn more about the field of seismology and, more broadly, geophysics
- Talk to as many people in the field as possible
- Ask more questions and take lots of notes
- Feel confident in my subject knowledge and prepared for a poster presentation by the end of summer
I feel like these are all reasonable and achievable goals for the summer and I've already started taking efforts towards most of them. I also know that I have a large support system to help me achieve them: friends and family from home, my fellow interns, and my mentor and other lab mates. I'm excited to see my progress over these next 8 weeks.
An Amazing Orientation
June 10th, 2018
Hello! This will be my blog during my time as an IRIS intern. I’ll start by saying that I am a rising junior, physics major at Rollins College in Winter Park, FL. I’ve been interested in geoscience and earthquakes since middle school, so I am excited for this opportunity.
I’m going to start off with Orientation week which was a blast (and now over a week ago)! It was like the summer science camp that I never went to as a child. I was honestly amazed at how fast we all became friends. Even in the airport and van ride, it felt like a reunion of old friends, not a meeting of strangers. We had such amazing conversations right off the back and those conversations carried through the entire week. Even with long days, we often chose to stay up late talking outside our rooms or playing in the fields. No one wanted to say goodbye at the end of the week so we gladly gave up a little sleep just to spend more time together. I am really going to miss this amazing group of kind, funny, and intelligent individuals, but I’m happy that I now have 18 new friends and I can’t wait to see them all in December.
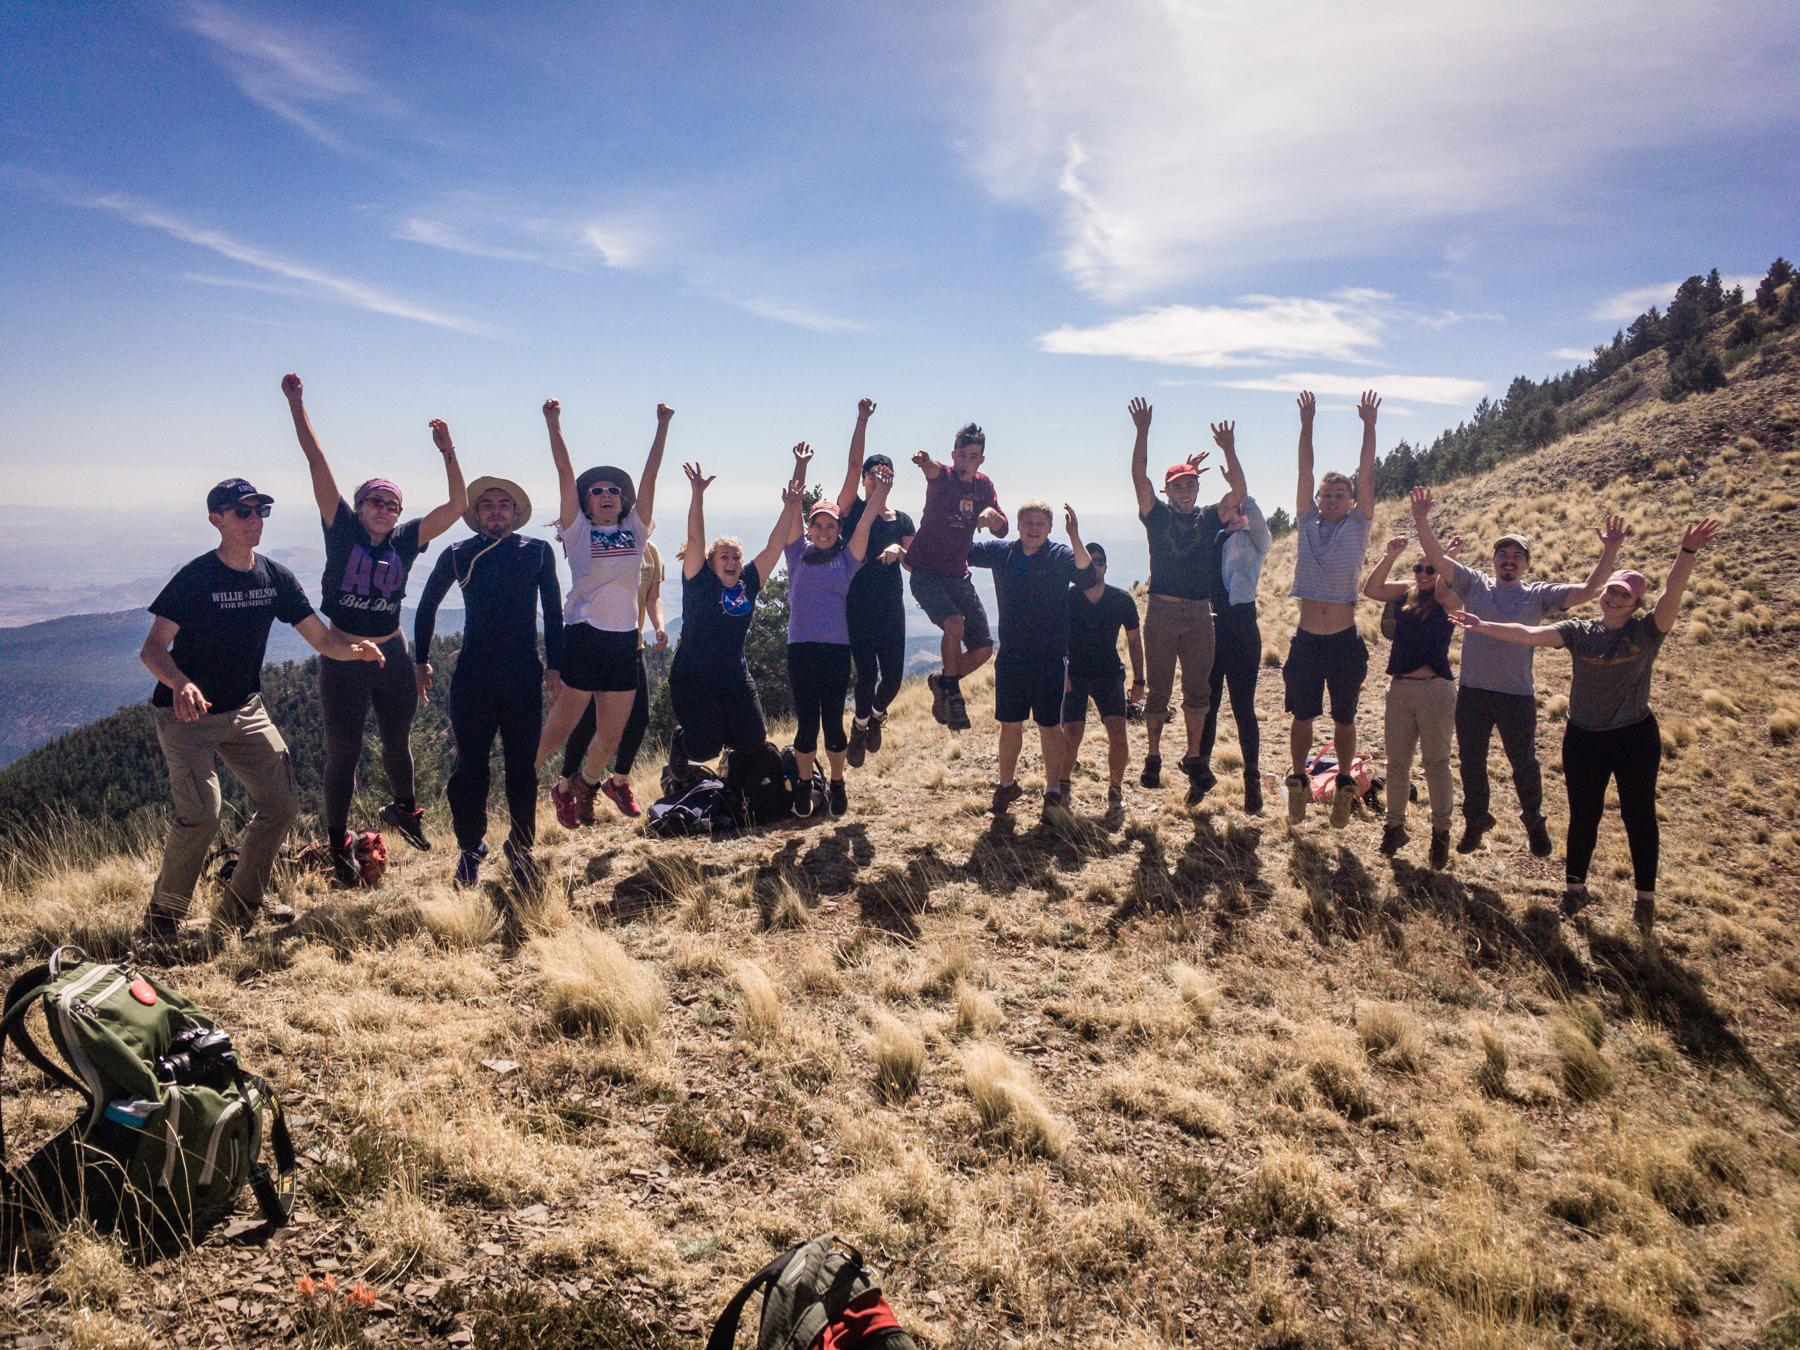
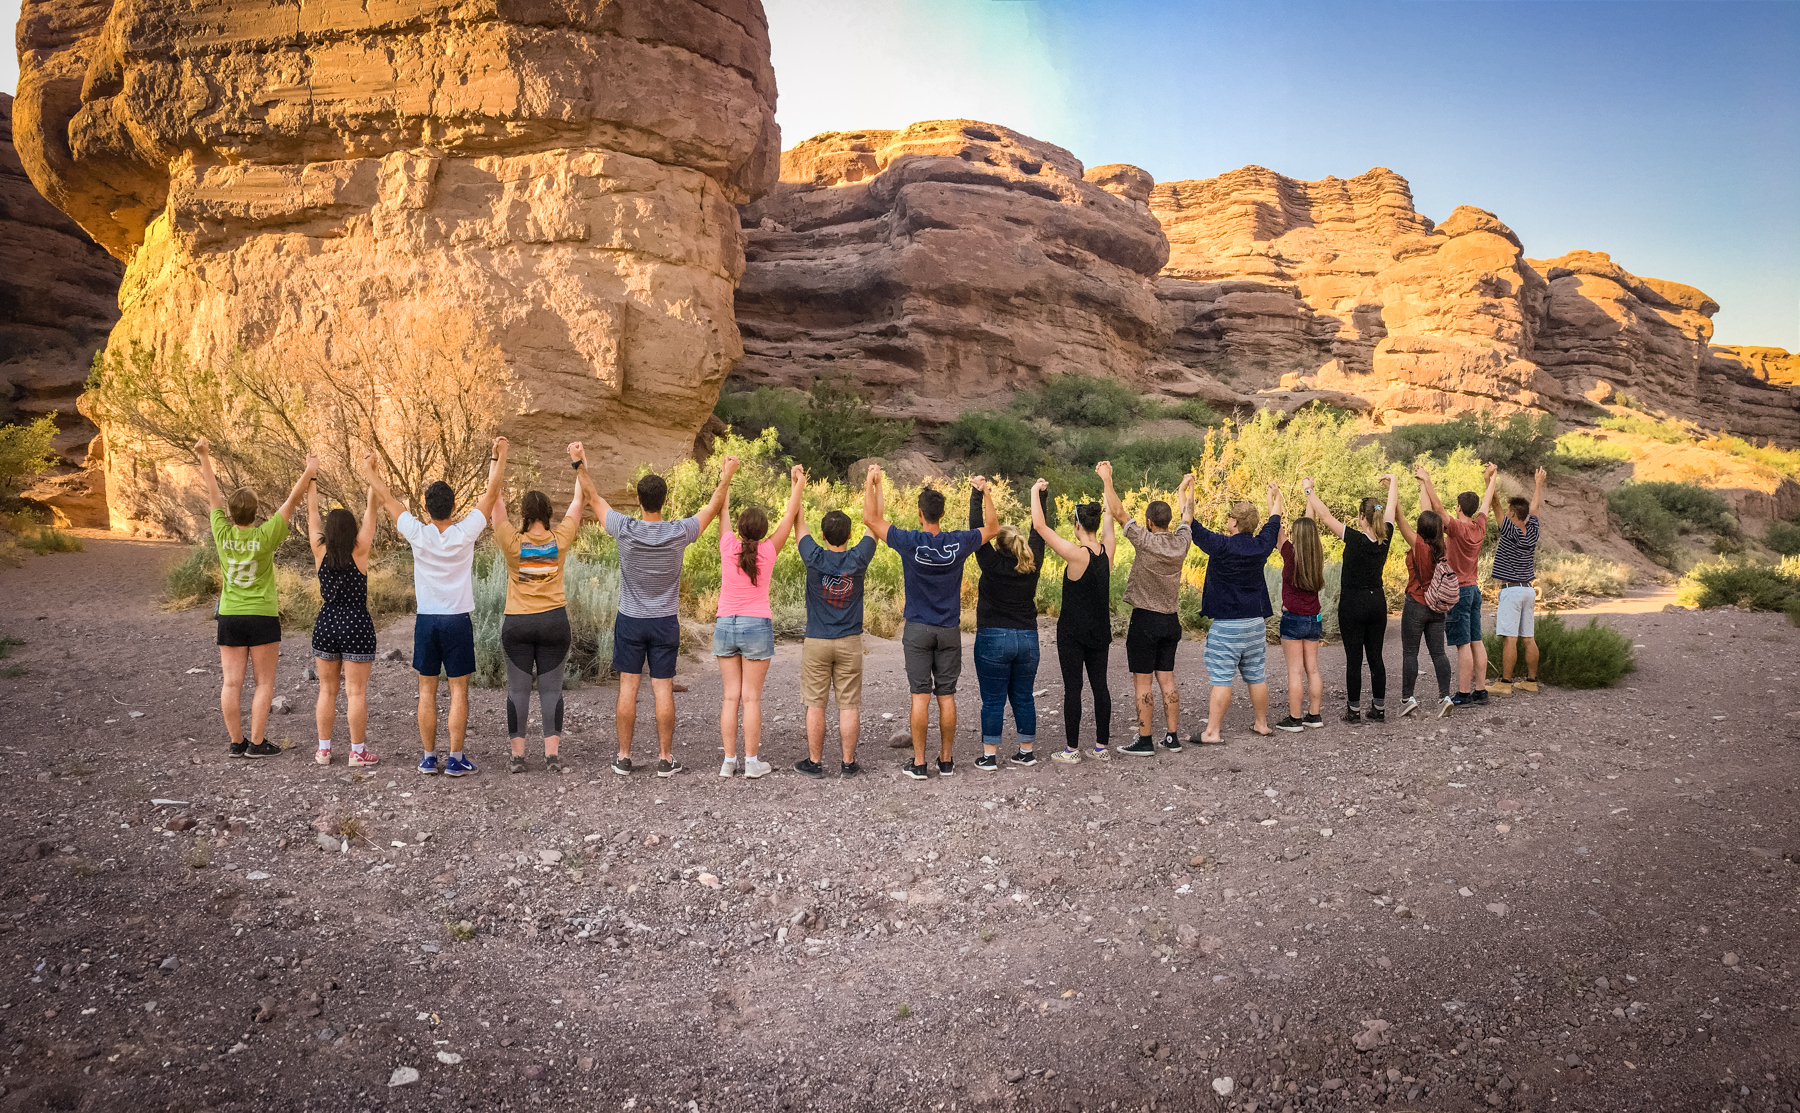
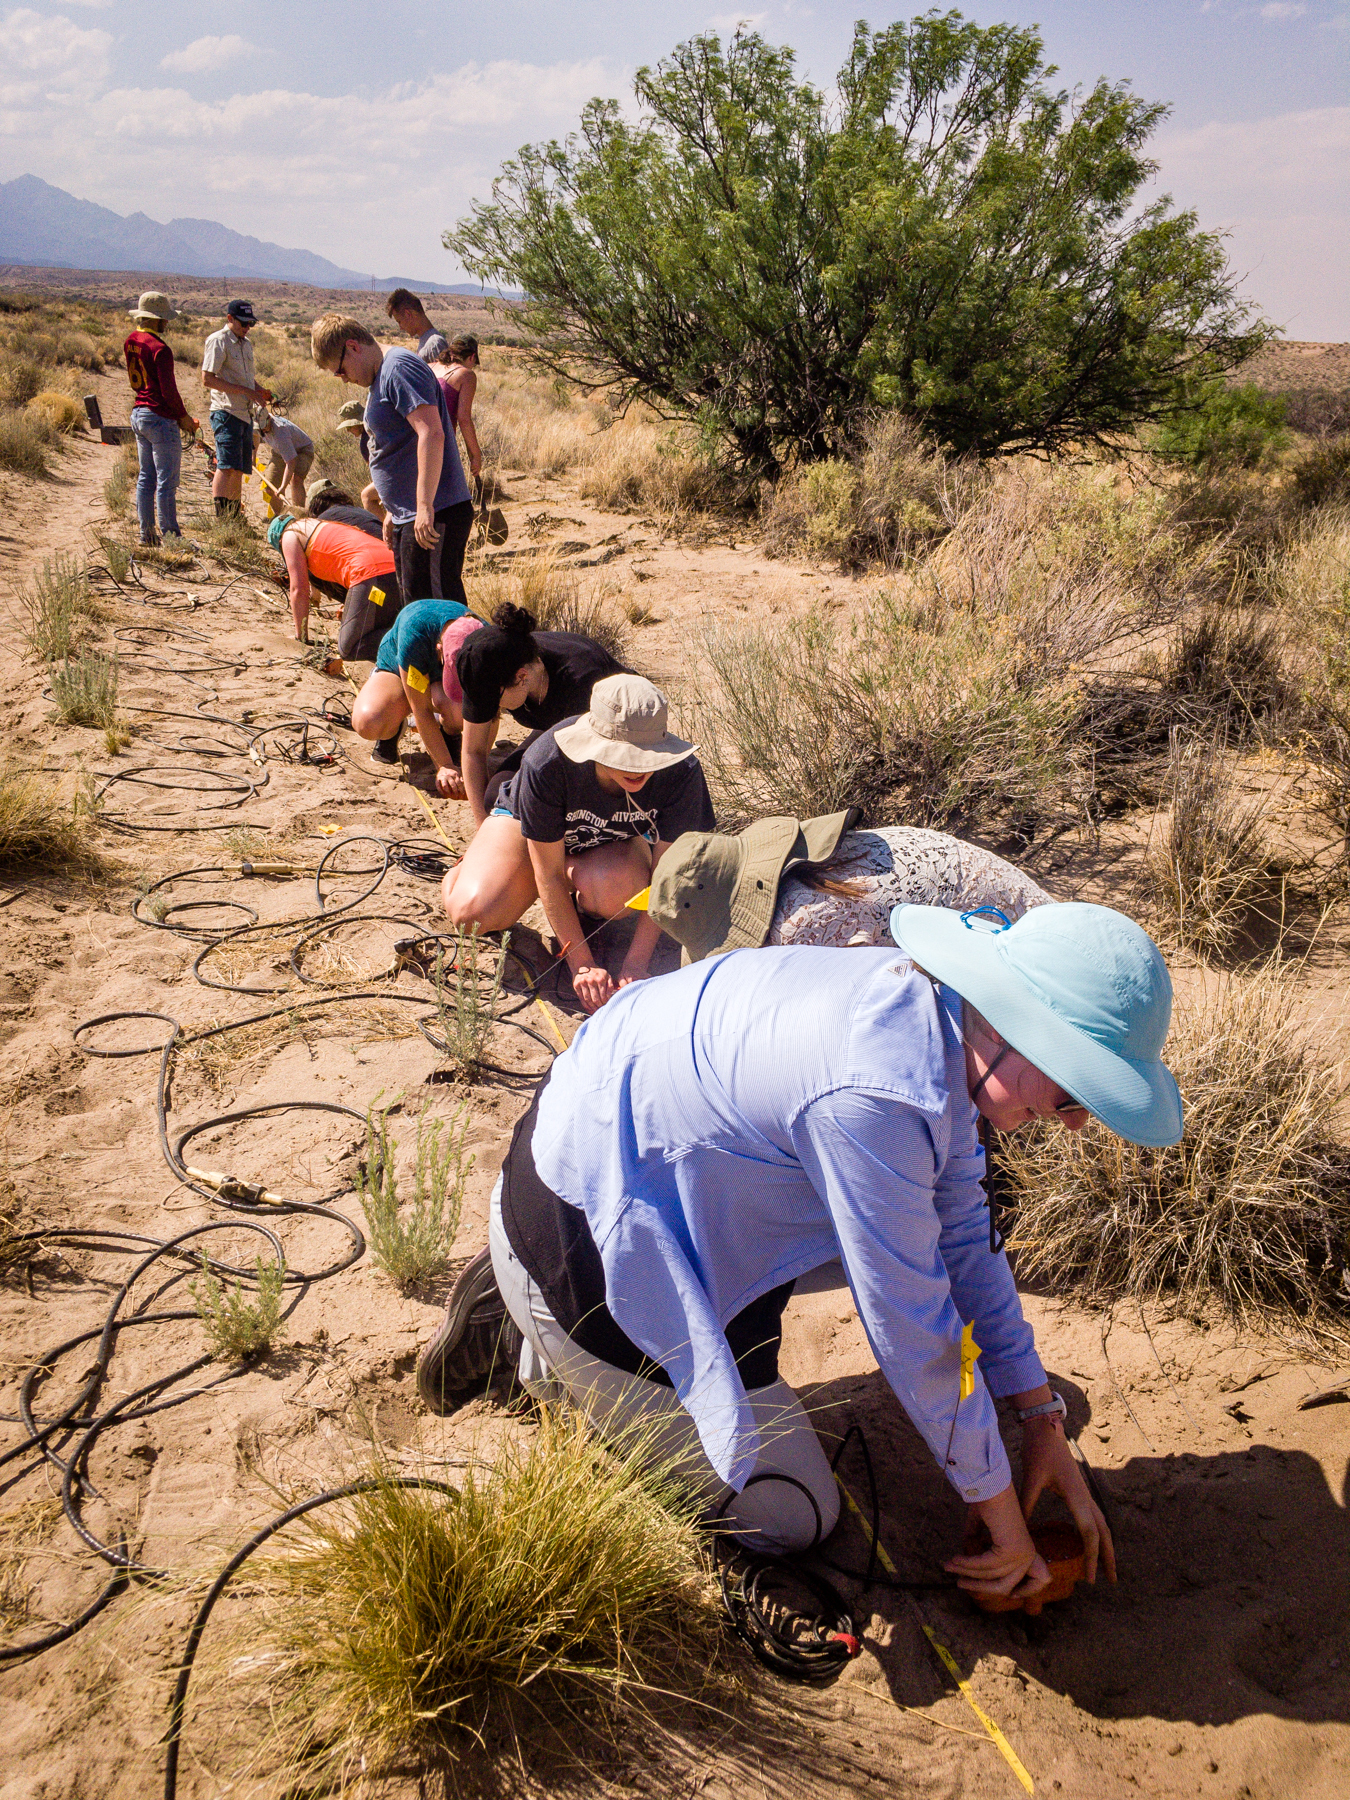
The week was a whirlwind of activities. Lectures ranged from topics of seismology to grad school tips. It was also nice that we learned a little bit of coding and how to analyze data which will be helpful this summer since it's most of what I’m doing. We also got some field experience by installing both broadband seismometers and geophones.

My favorite parts though were the hikes (surprising since I’m not an outdoorsy person). We had a geology hike where we saw some awesome rocks! I may not have known what rocks I was looking at, but it was fun to find shiny ones and everyone was really nice about explaining them to me. I also really enjoyed our Magdelena Mountains hike. It was so beautiful and peaceful. Being up at 10,000ft was a blissful experience and I would love to go back one day. The observatory was just a cherry on top for my inner space nerd.

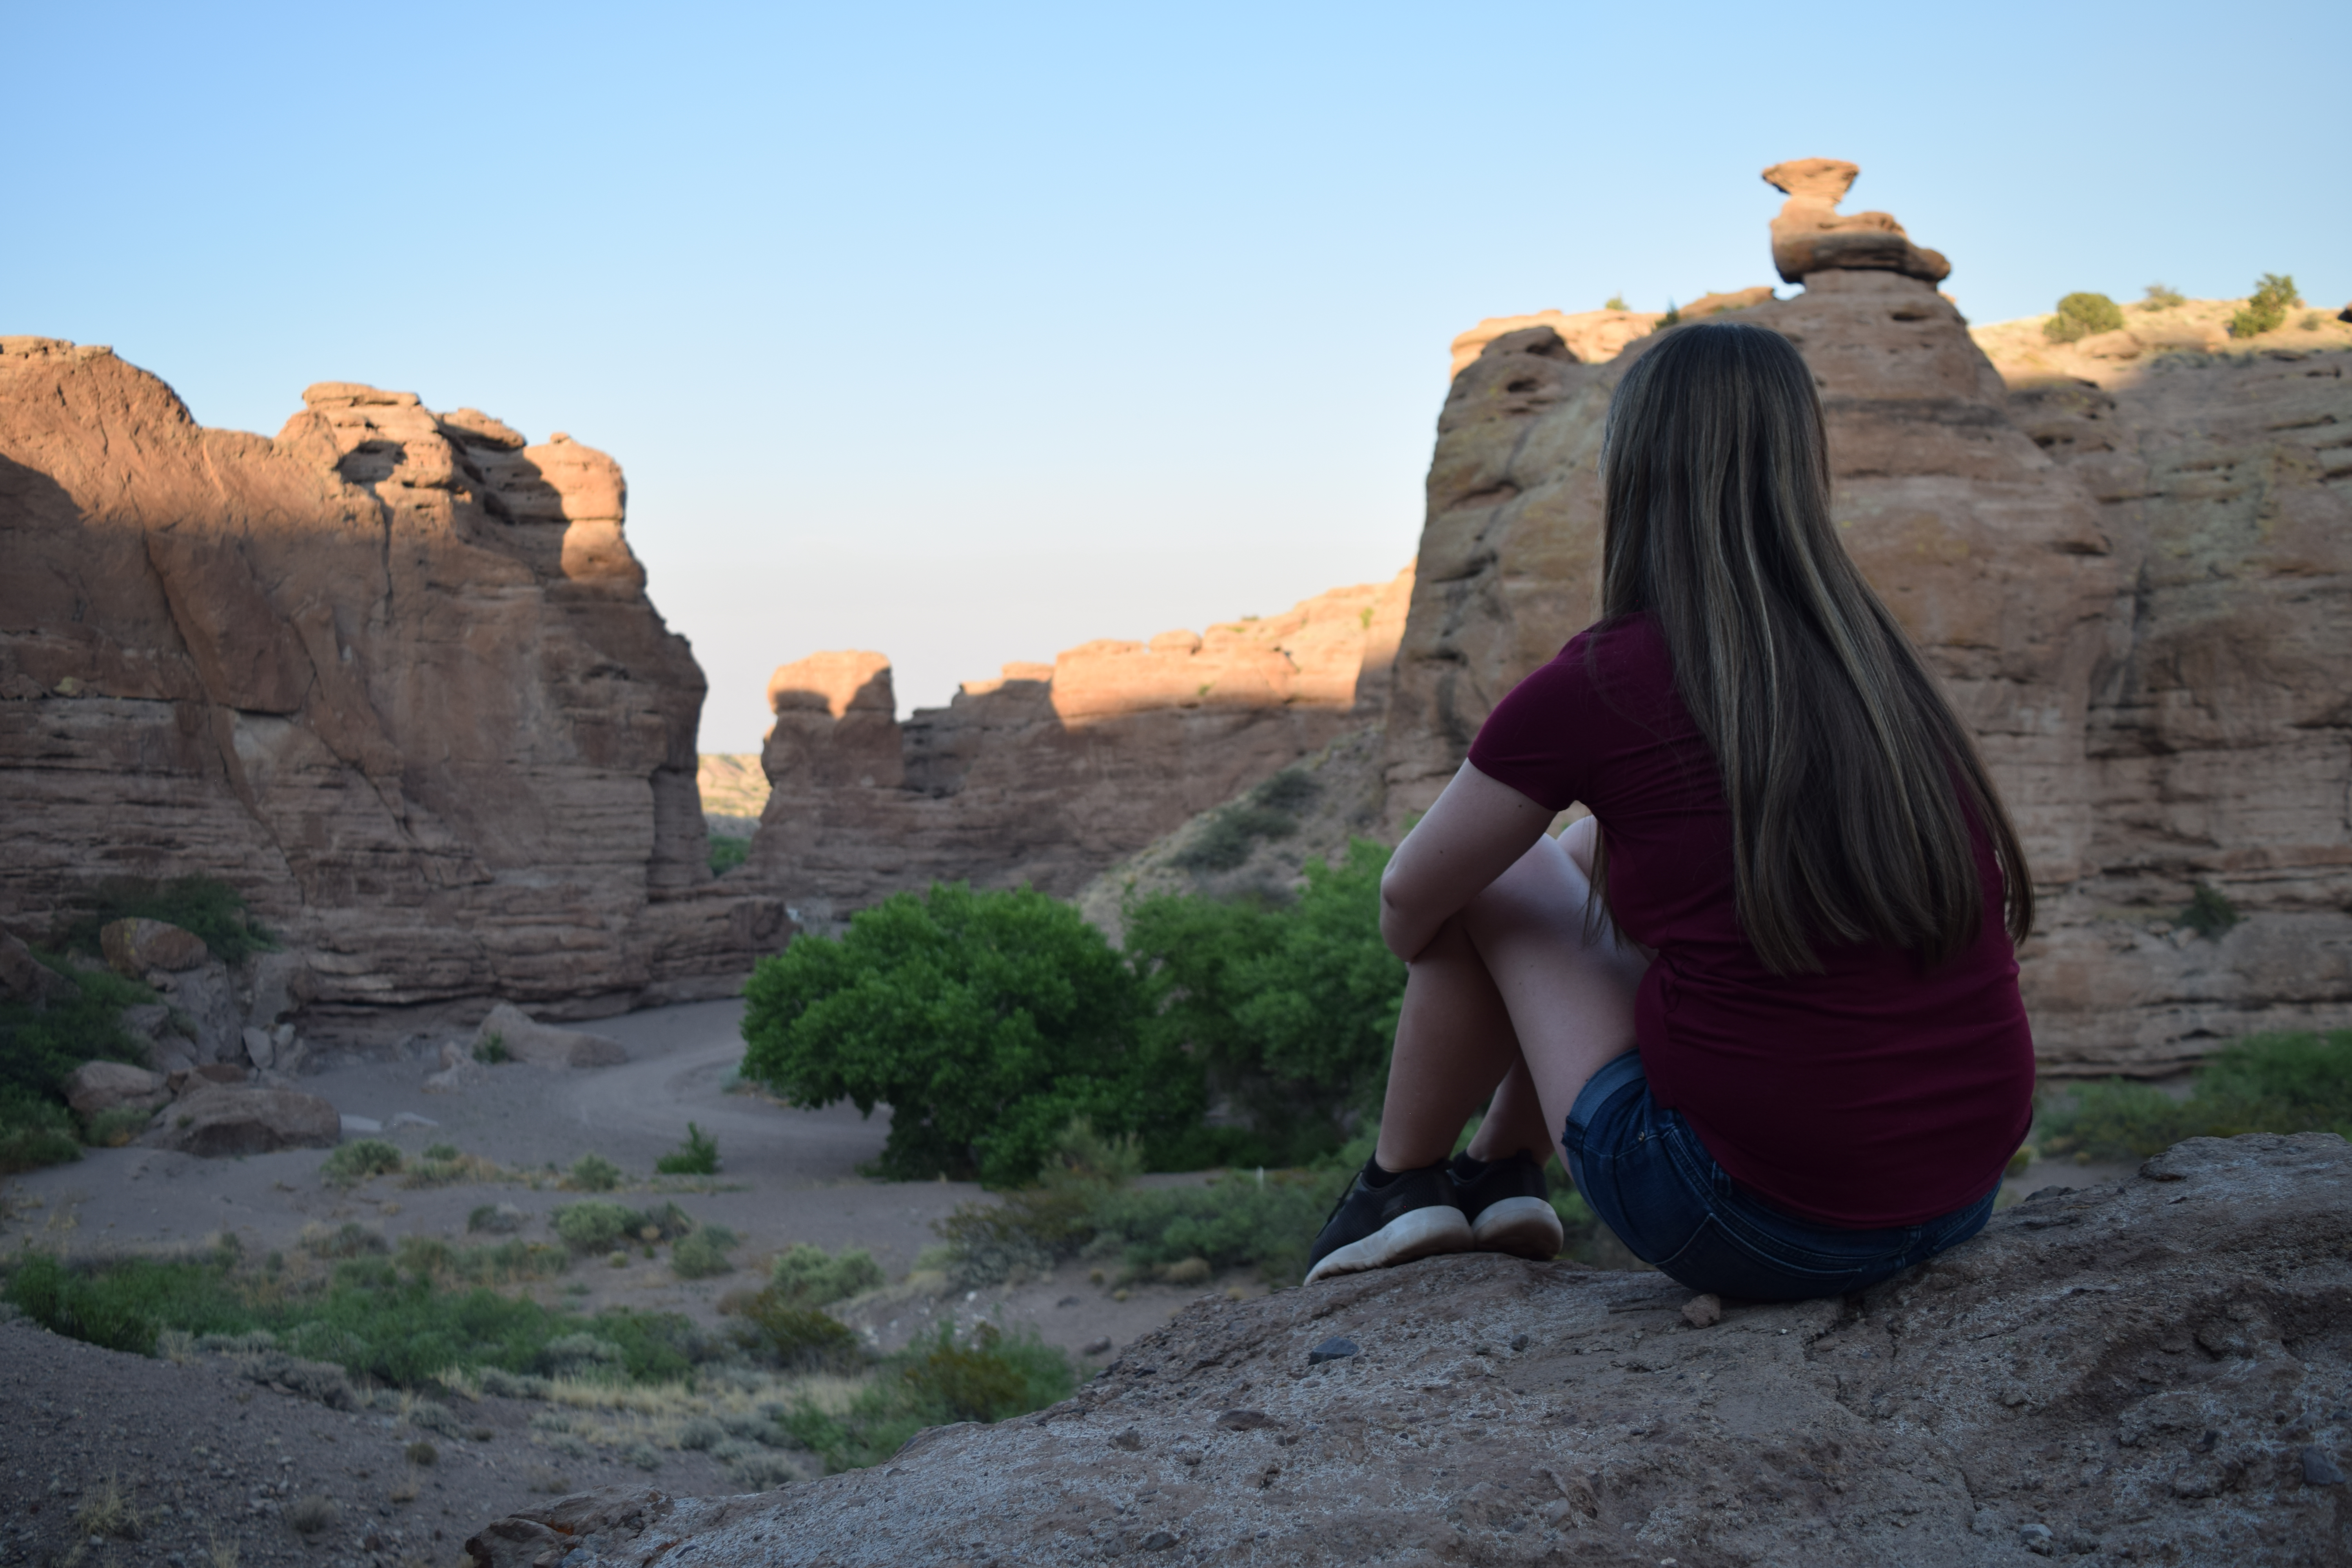
Then of course, the last night in San Lorenzo Canyon was the perfect way to end an amazing week. The best part was after it got dark and we were able to go out and stargaze. Even with all the haze and smoke we were still able to see Venus and so many stars. We also got some awesome pictures thanks to Sydney. It was bittersweet knowing that we would all soon have to leave but we ended the night with some Disney karaoke in the party van.
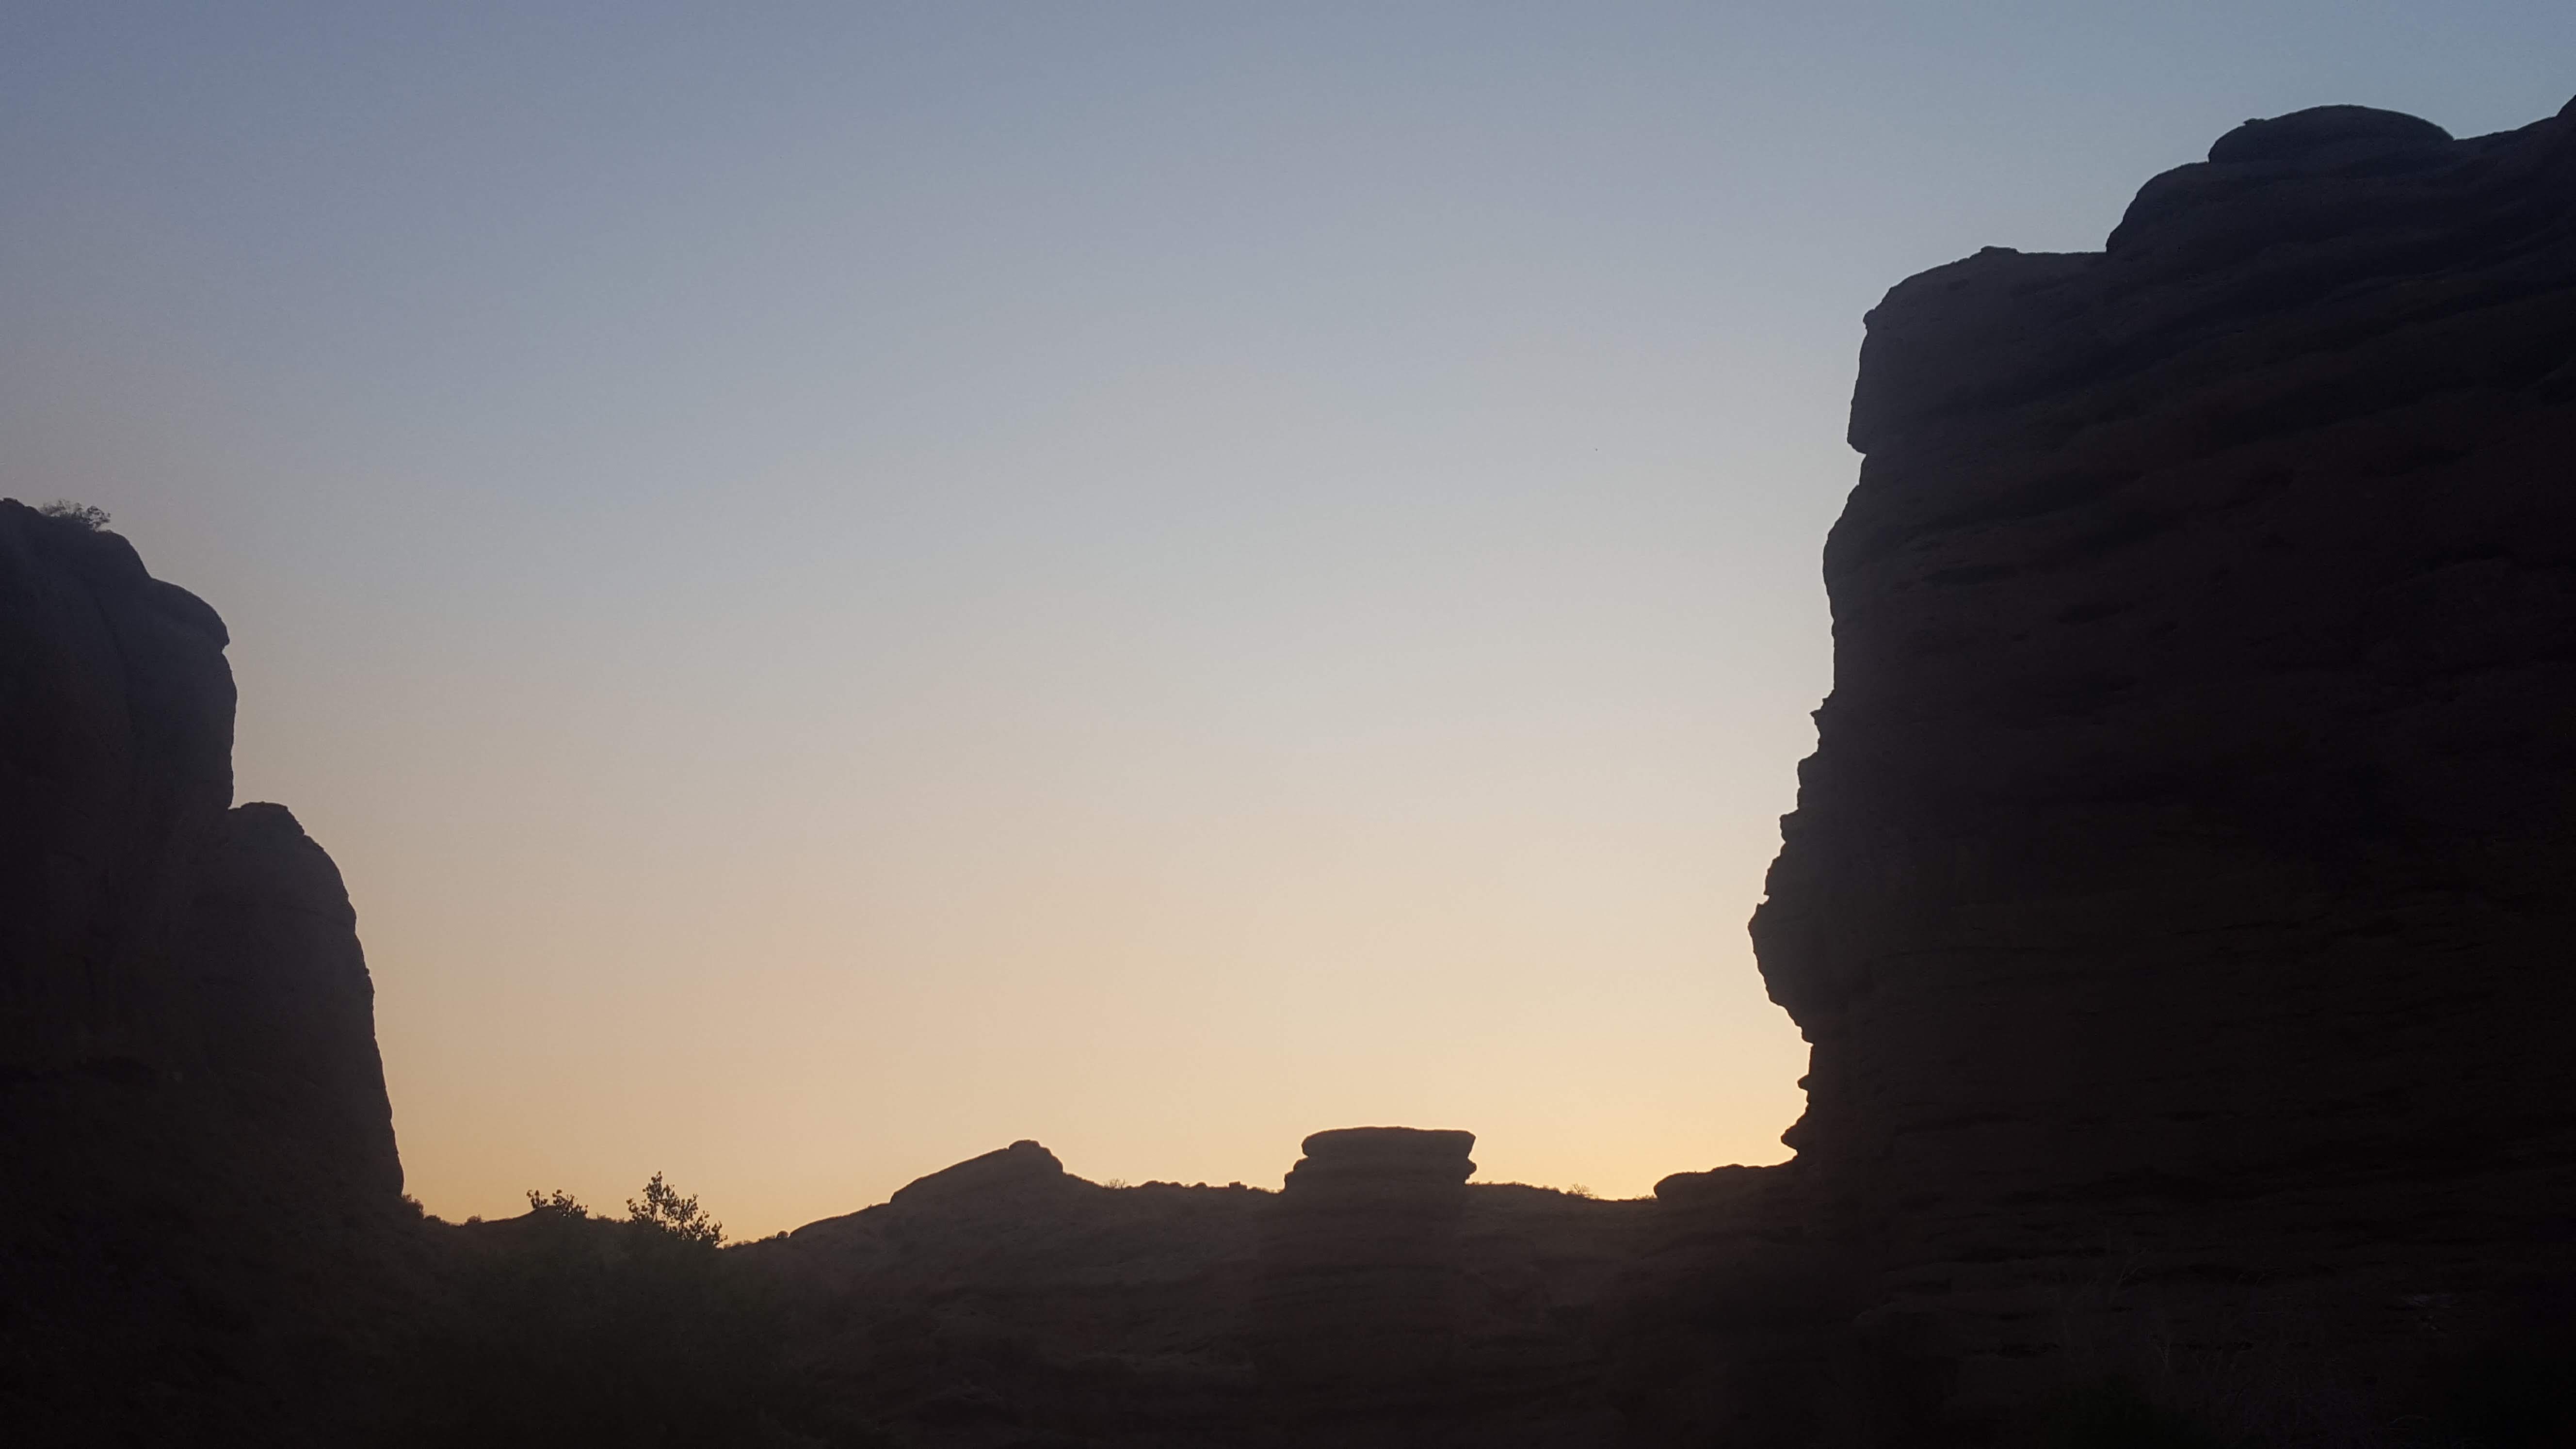
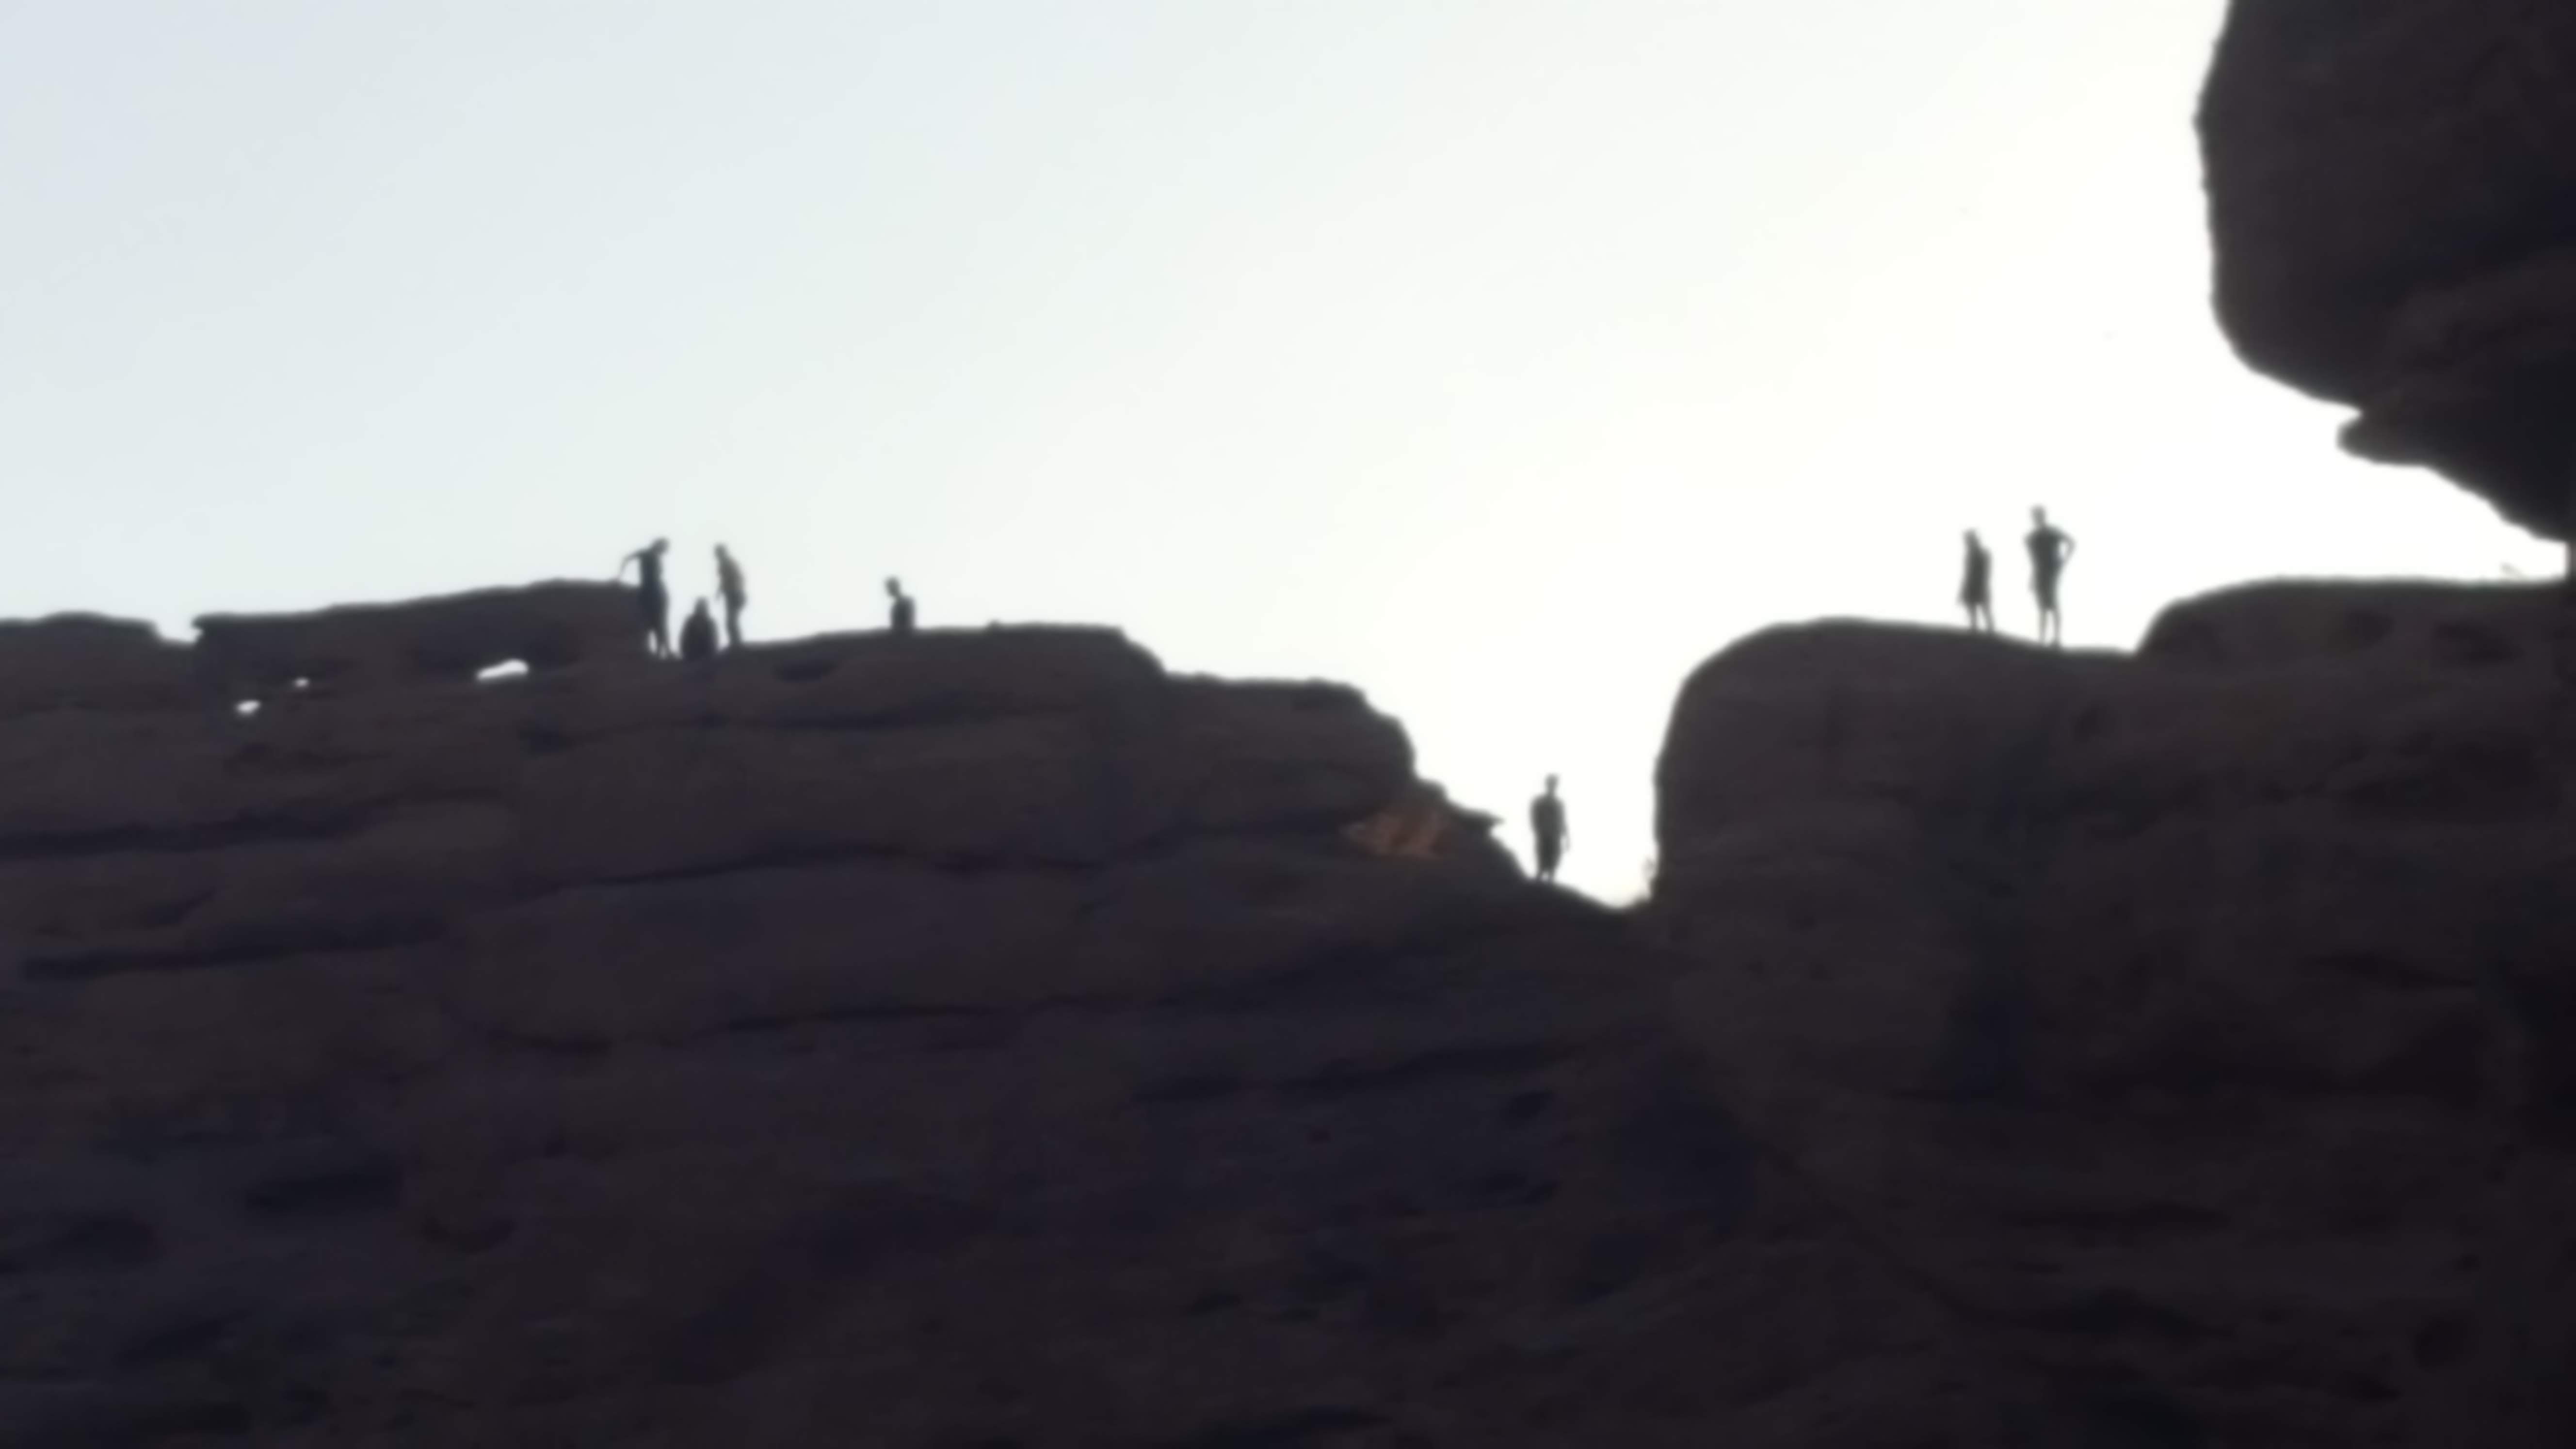
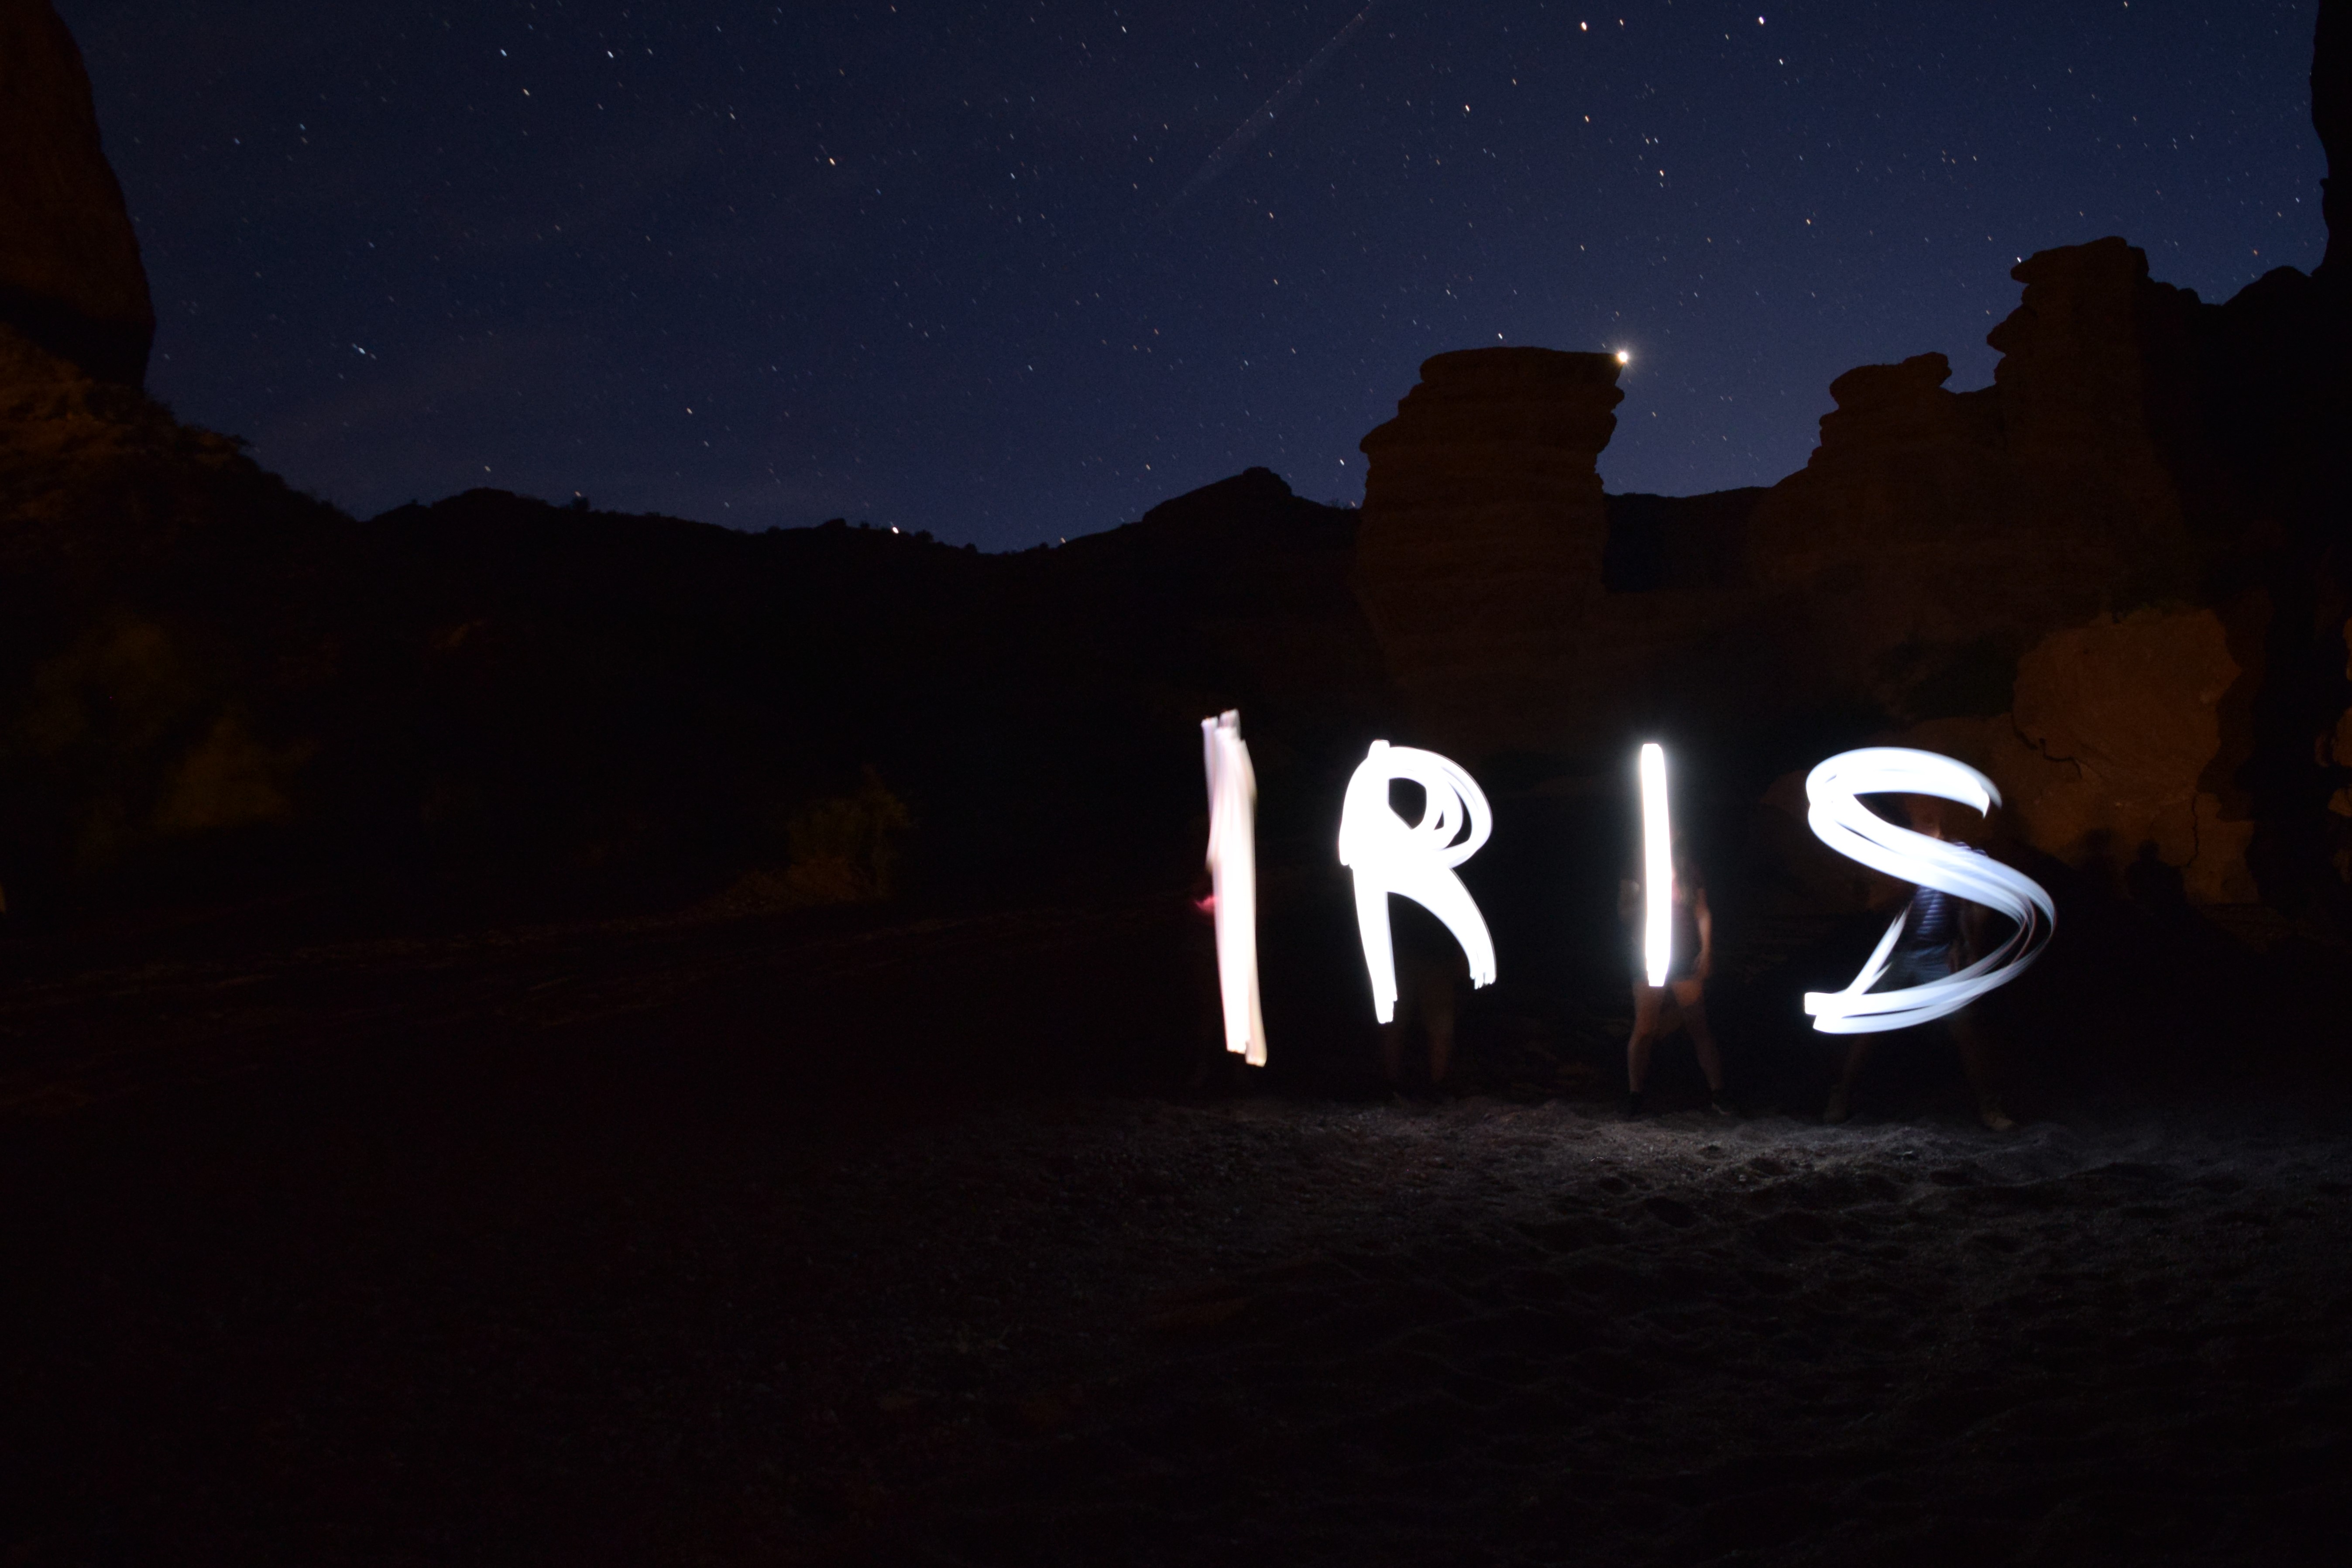

While sad to leave, it was an incredible experience that I won’t forget anytime soon. I’m excited to see what the rest of summer brings Brown.
(Pictures 1-4 thanks to Brady and and Pics 7&9 thanks to Sydney)


