James Pippin
James Pippin is a student at Fort Valley State University currently completing his research at University of Rochester under Dr. Tolulope Olugboji.
Based off previous research that has viewed the receiver functions to understand the Lithosphere and Asthenosphere Boundary (LAB), they come up with this discontinuity within the Lithosphere. This discontinuity is known as the Mid-Lithosphere Discontinuity. With the aid of HPC processes, we plan on developing a workflow that can use Earthscope data found across the United States from various array networks and automate a process to develop harmonic data sequences to understand the anisotropic properties in the lithosphere, primarily to understand and characterize the Mid-Lithosphere Discontinuity.
Week 3
June 25th, 2018
Week 3:
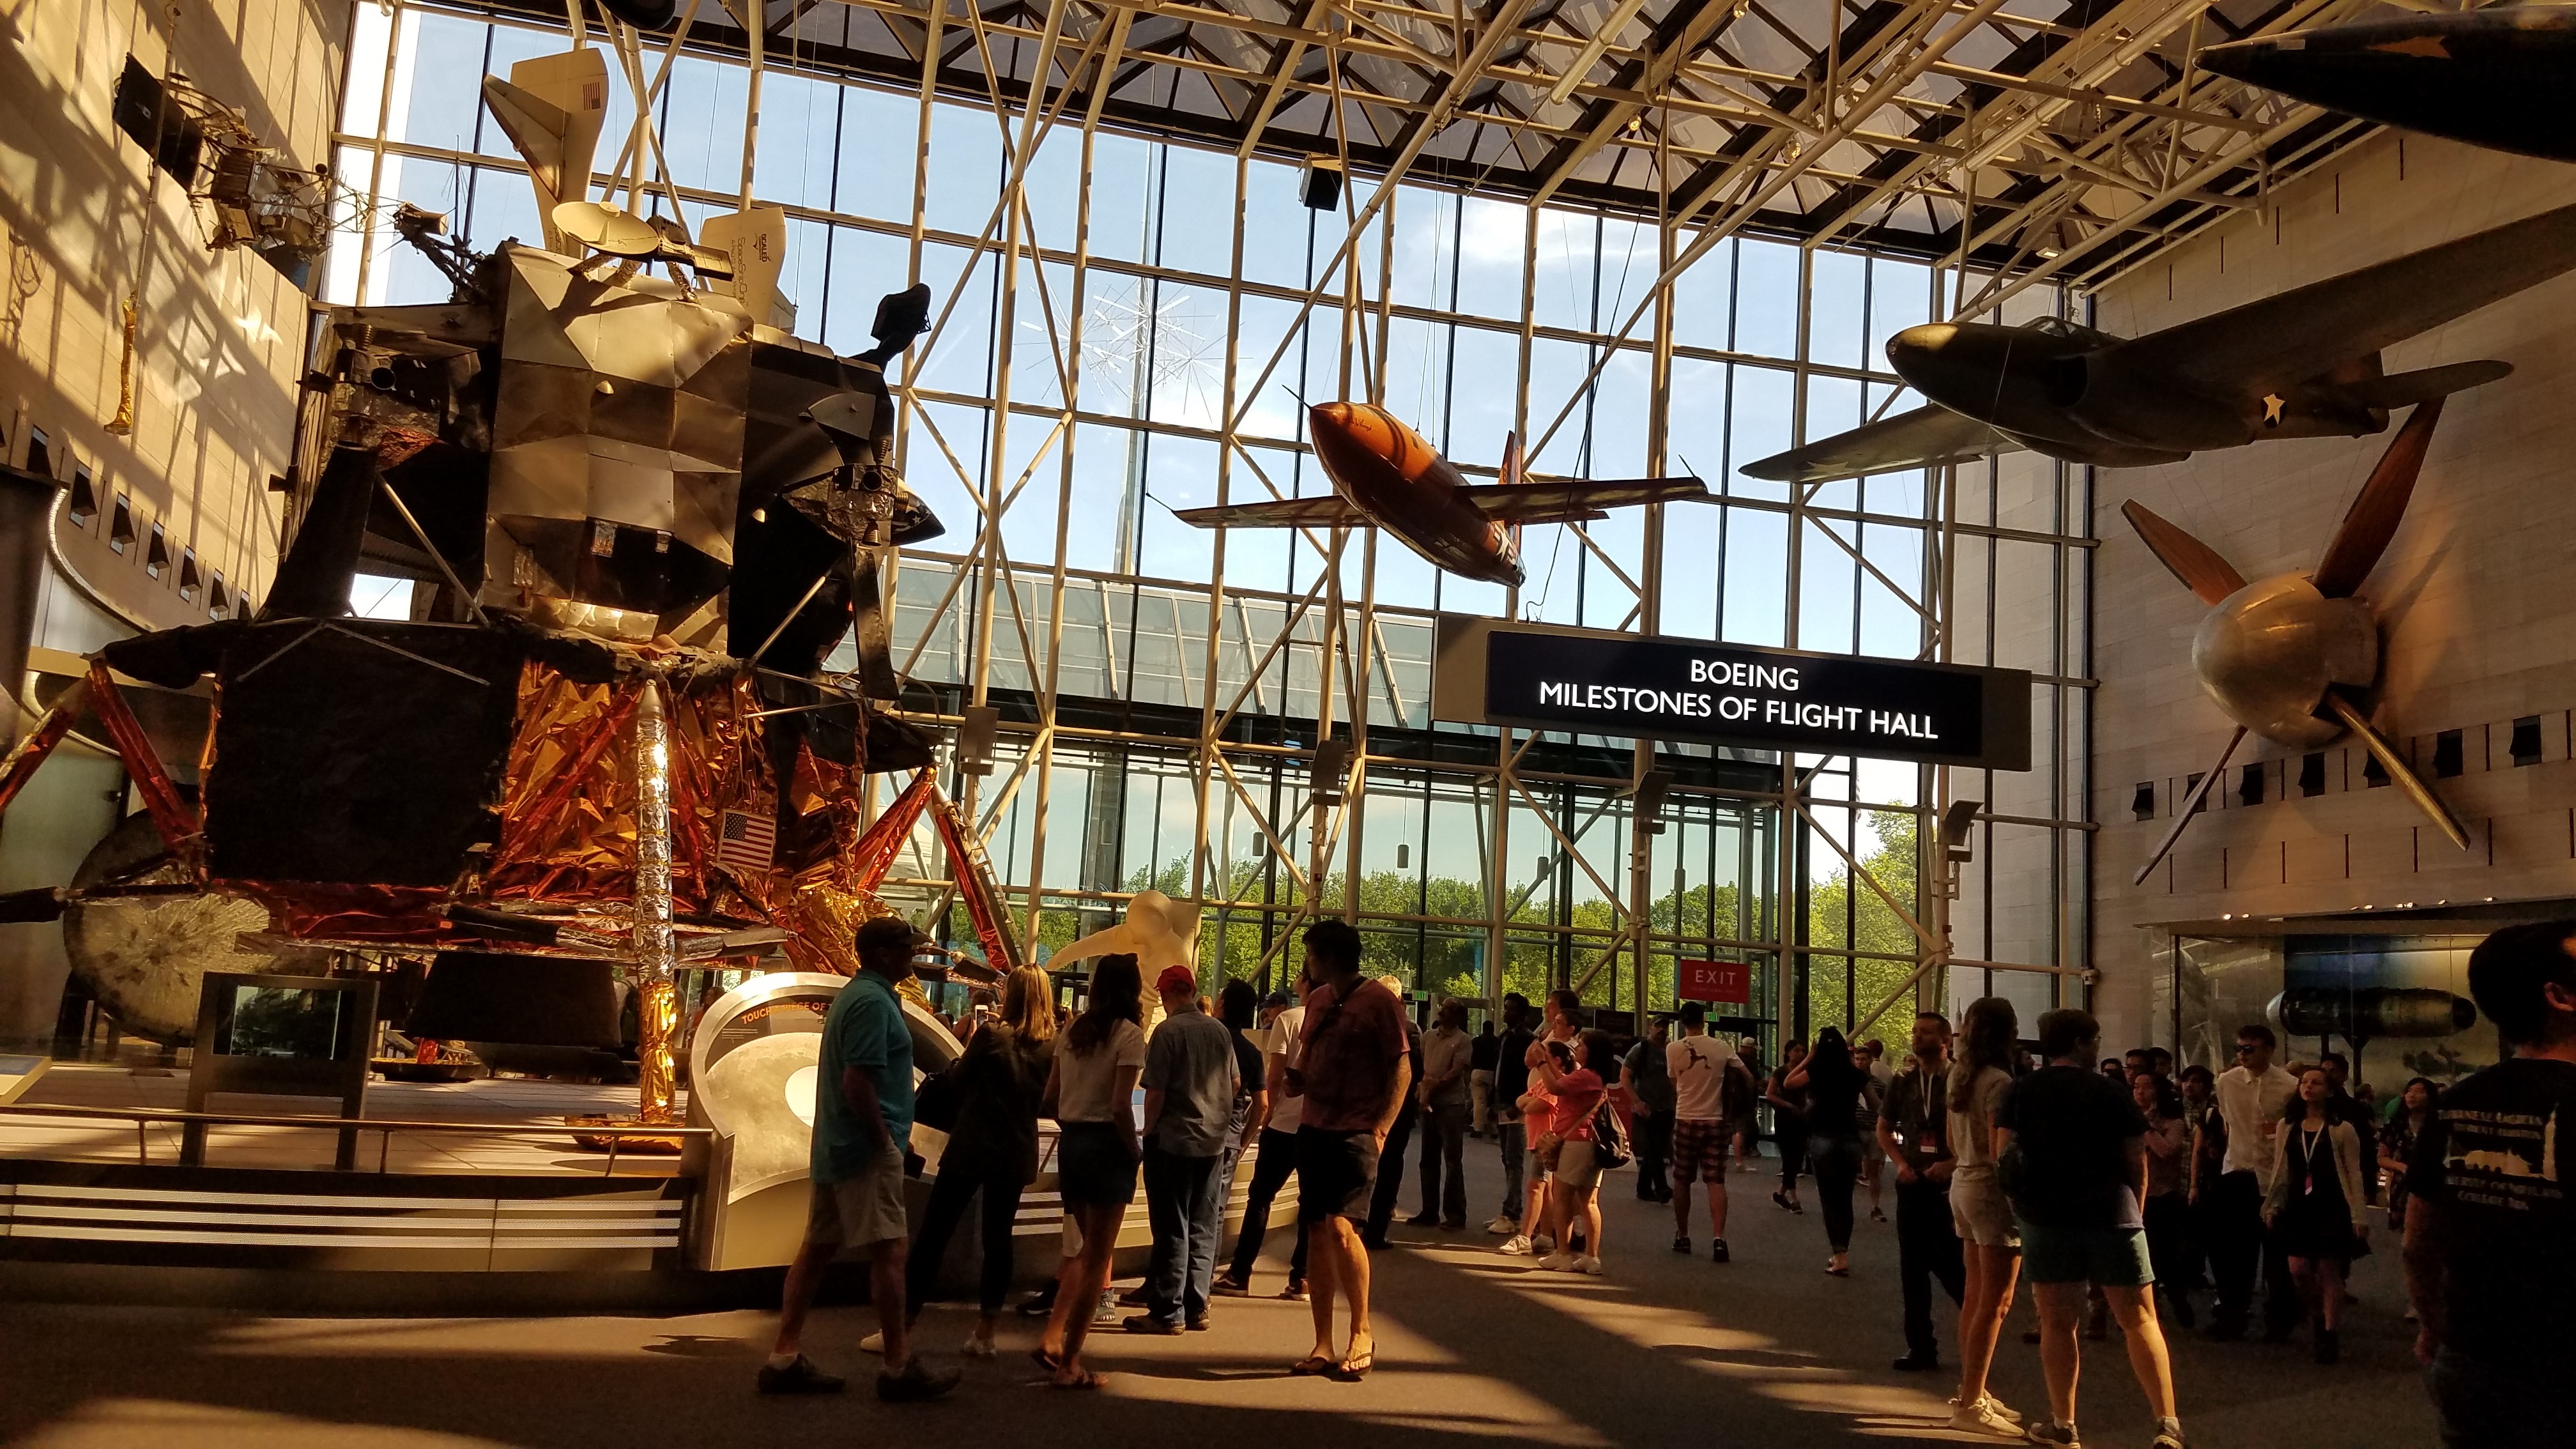
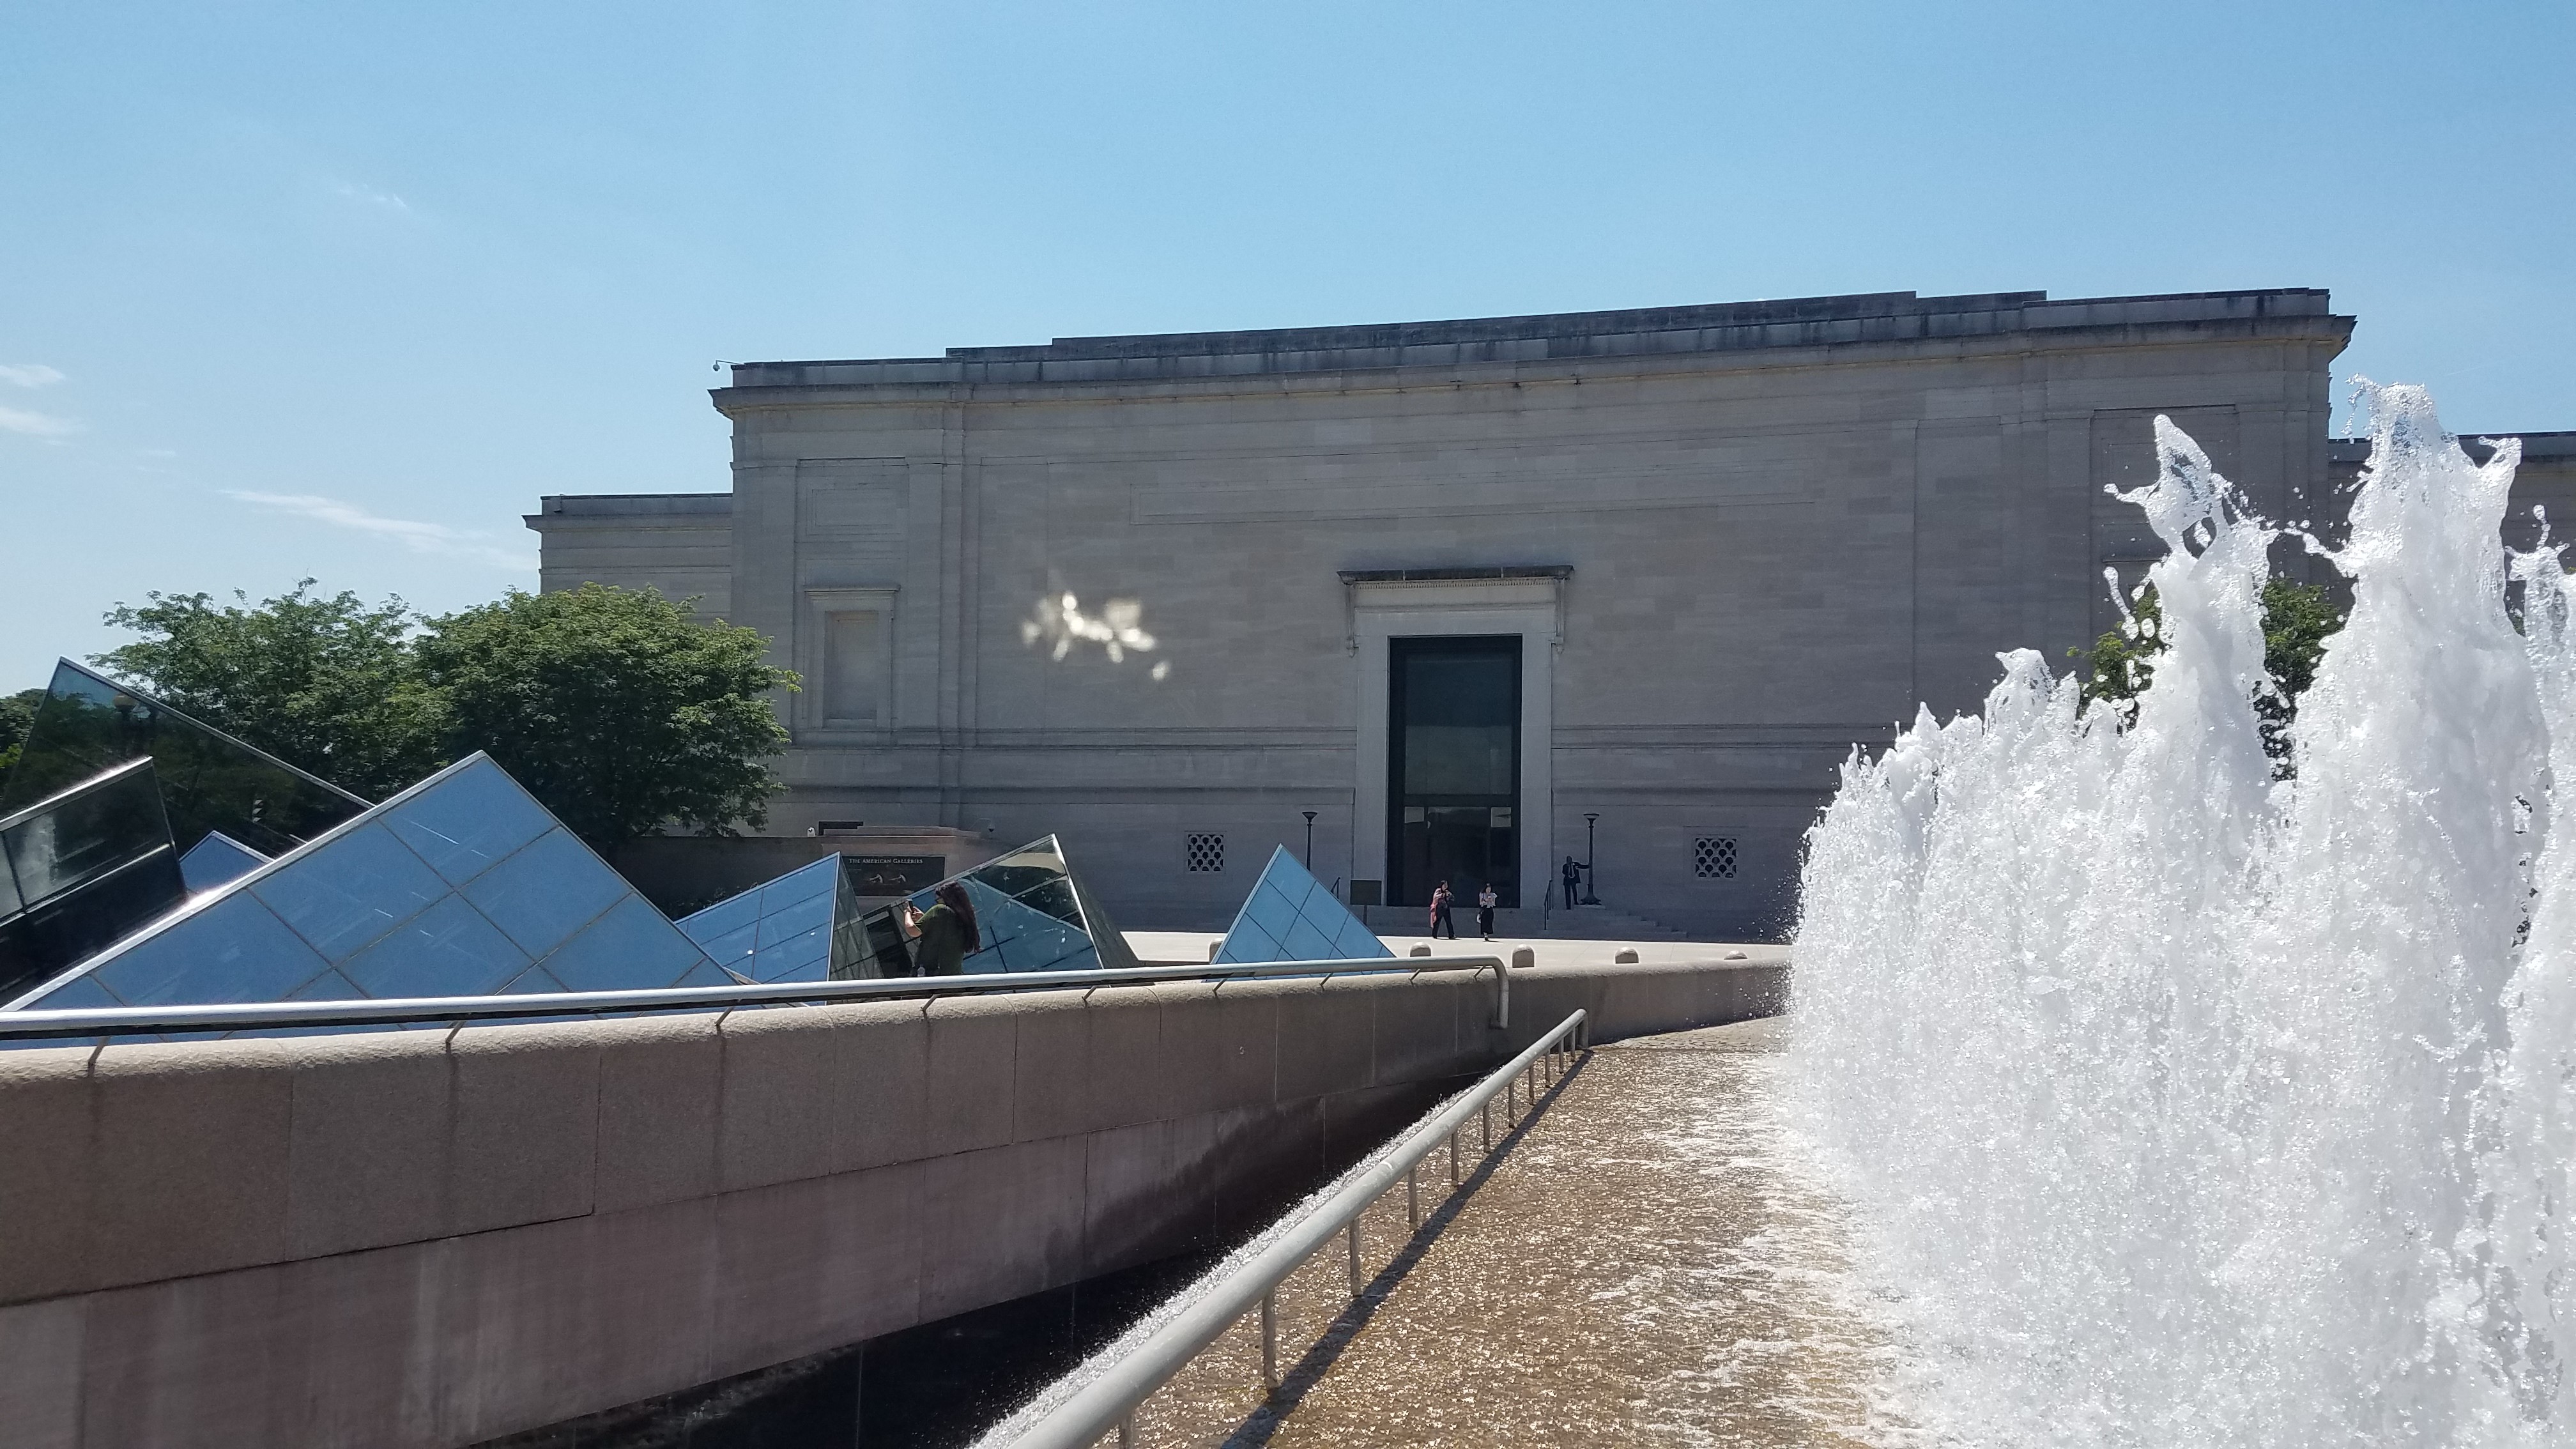
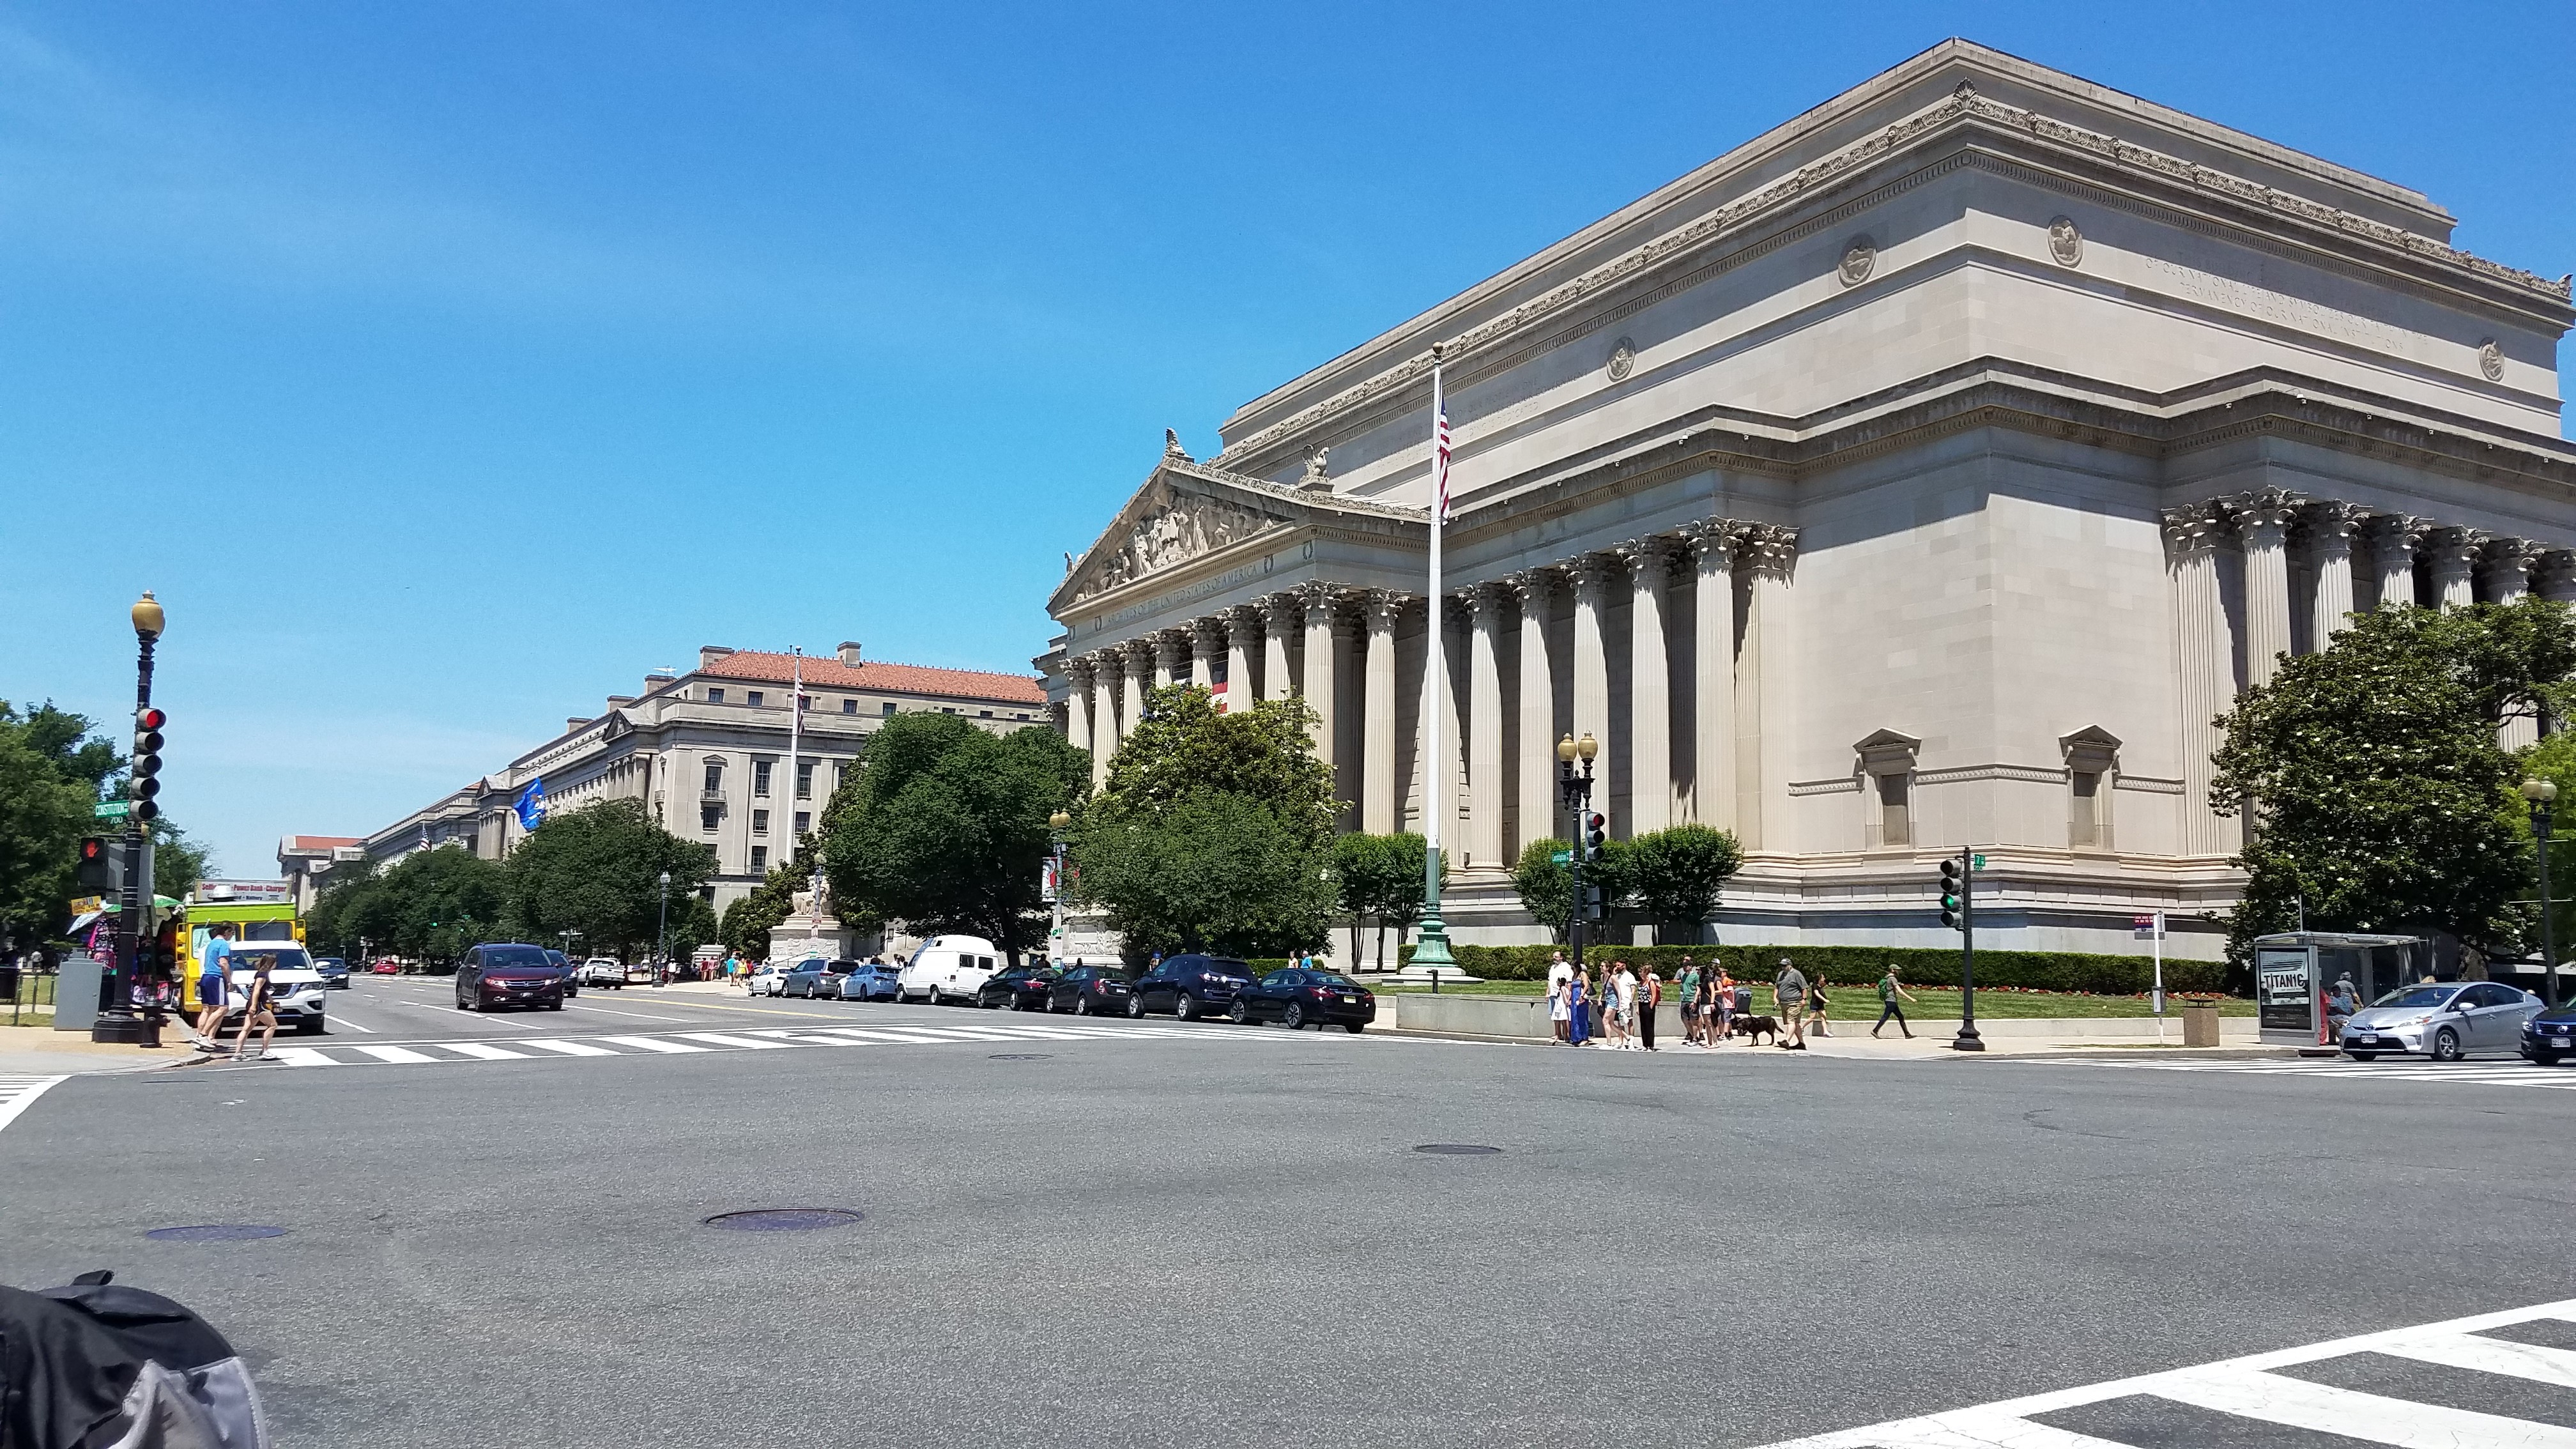
I am starting from the weekend from week 2 to week 3 here. Since I am super close to the capital, I took a trip down to visit. I first started with the Air and Space museum since I have always wanted to go. And then I ventured around the DC region in general. Here are some photos from my time there.

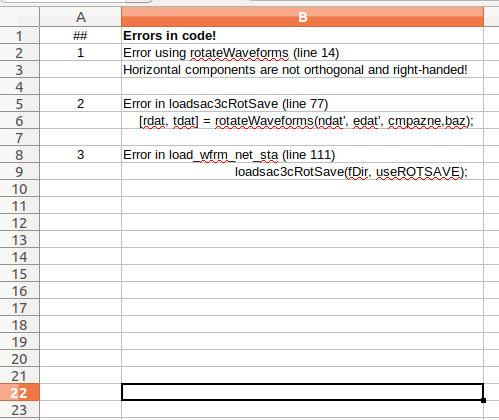
This week was full of accomplishments. To start off, Tolu and I had several Slack calls to discuss issues that I had been cataloging in a google spreadsheet. I would list the issue, and then follow it up with the fix. The biggest fix was to add some try-catch sections in the code to catch faulty data points. Along with commenting out regions in the code that were causing massive amounts of RAM usage, those usually pertained to the stations with over 4000 waveforms. Which is nearly all the 61 stations.
Here is a very early stage of the spreadsheet.
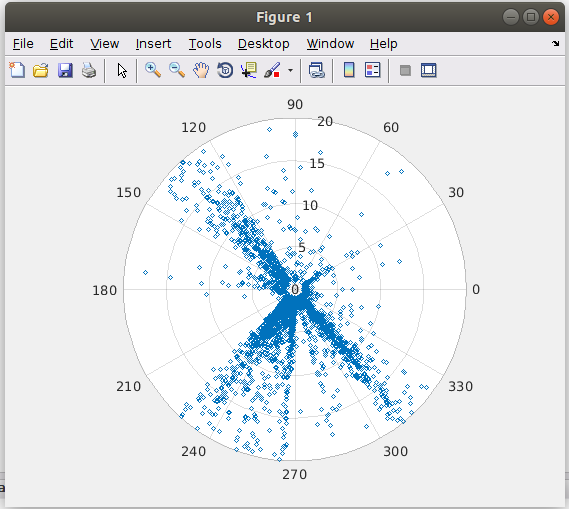
Though, in the event that the code would crash I was working on the side to make some nice graphics for future presentation. One that most have seen from my first post, but updated. The following picture shows off some of the data from the SNR code, I used the polar scatterplot in Matlab, You notice quickly that that are limbs of data points, those are associated with the tectonically active regions that most of the data is coming from. This will have an effect on our overall image on our results.
Again, this week was a bit tougher since I could not easily contact Tolu, though it went smoother than week 2 did by far. I feel my understanding of my research has grown. I feel if I am to give an “elevator speech” on what I have been doing. I could easily do it in the moment. I feel though most people wont understand the idea of anisotropic, but that is something I would have to explain if they ask, or I ask them if they understand it.
I cannot wait for my next week to start, Tolu has already asked me to look into what deconvolution is and I have working code running over the weekend. (Sneak peek…. I forgot to tell the code to run all the stations… bummer).
Week 2
June 25th, 2018
I fell behind on getting my blog out, so this is for week 2.
In my second week, my advisor had left to start moving his belongings and situating himself in the office at the University of Rochester in New York. In his time being away he had given me multiple task to complete. Like plotting the signal to noise ratios in a polar scatter plot, running the code to develop statistic data on the waveforms, figure out the number of waveforms per station, and the back azimuthal data associated with each station. I was able to figure out how the code, was lack of a better word, but the errors associated with it all. And just how easily I could make the computer I was working on crash in different ways. I mean hard freezes. System lock ups. Overworking the CPU. It was a mess. But towards the end of the first week, I was able to run a single station that had ~4500 waveforms accounted for. Not sure what the data was giving, because the code that saved the data in different forms was crashing. Hence more testing later.
But furthermore, my data set I am working with is containing 61 stations all within the Precambrian region of the United States. I am not the first looking at some of this data, however the previous research that has looked at this data, has not automated the processes, nor have they accounted for a different velocity model (they have mostly used the AK135 velocity model) that is getting outdated and is more central on an average instead of velocity per specific regions.
Again, since we are automating the processing in 9 networks, and containing approximately 196,000 waveforms. We are not picking these individually, we have an automated picking algorithm that is doing this for us.
I feel since the beginning of this week, it has taken a lot more responsibility to really approach the task I was given from Tolu. Such as really attempting to have stuff run, or simply just understand the task and goal that was to be obtained by the end of the week. I know that this first week that Tolu has been gone, was a tough one in the world of code, but my perspective for the goal that is to be the final one has grown.
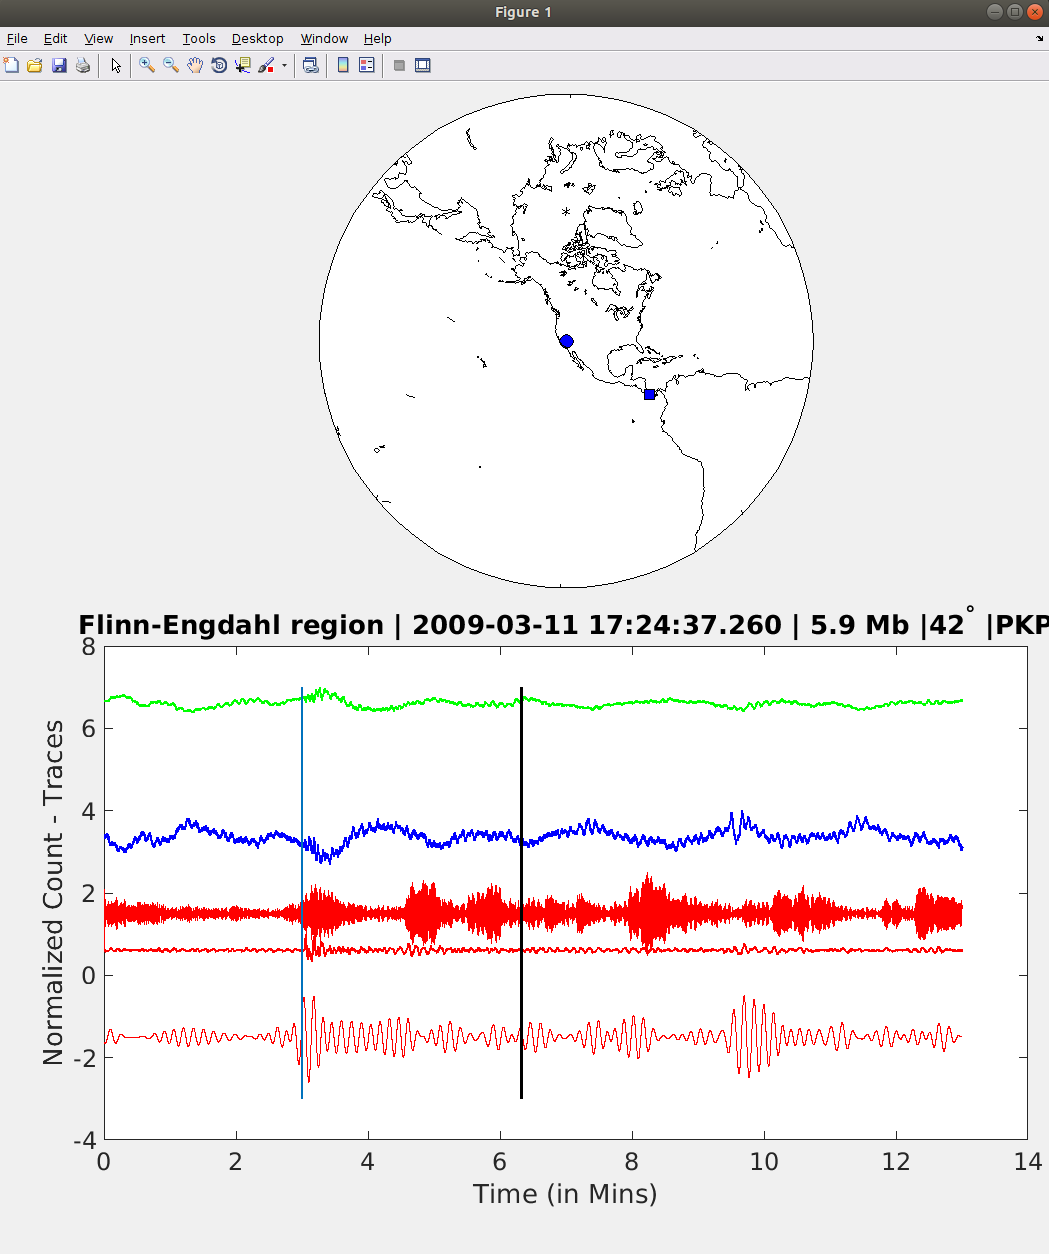
Here is an example of one of our waveforms, and this label for the waveform and station is wrong.... but it atleast shows the correct location and wave components. 😊
Week 1
June 8th, 2018
From the start of the previous week it has been a race course. Learning so many things in such a rapidly driven way, yet powerful. Meeting all the enthusiastic leaders and interns alike, all developing and understanding geophysic, even each other. It was such a great orientation to the prestigious and well-organized IRIS internship program, for which I developed memories that will not easily be replaced. But that week flew bye, even after having each day start at 7 am and end as late as midnight; usually began a process of ending around 10 pm, a "process" I repeat. But it was sad to see the week come to an end.
That was then, and now it is the end of week one of my research. Since I have a rare case of being appointed with a finishing PostDoc mentor, I will get to experience the move to Assistant Professor. I am currently at the University of Maryland, but in a months time I will be at the University of Rochester. I am privileged and extremely excited to be able to see the Geology departments in both worlds. So far, Maryland has been great, and I hope to experience more of what it has to offer.
My project that was assigned to me is titled “High-resolution Seismic Study of the Mid-Lithospheric discontinuity in the Precambrian Craton of North America using Harmonic Decomposition of Forward Scattered Body Waves” but what does this mean? Well, currently I understand this as the following. Based off previous research that has viewed the receiver functions to understand the Lithosphere and Asthenosphere Boundary (LAB), they come up with this discontinuity within the Lithosphere. This discontinuity is known as the Mid-Lithosphere Discontinuity. With the aid of HPC processes, we plan on developing a workflow that can use Earthscope data found across the United States from various array networks and automate a process to develop harmonic data sequences to understand the anisotropic properties in the lithosphere, primarily to understand and characterize the Mid-Lithosphere Discontinuity.
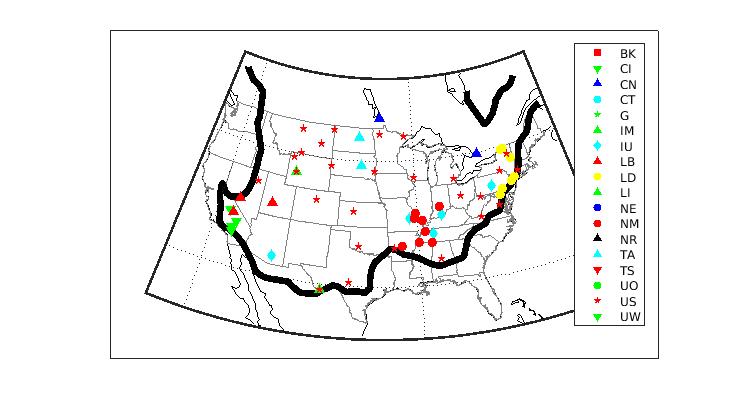
Anyways, back to the a narrative. Dr. Tolulope Olugboji (aka Tolu or DrOh) has started this week off extremely well. He gave me a list of papers to read, he has been teaching me and showing me the computing process and he thoroughly explains topics of concern and ideas pointed towards our project. I will not go lightly on this, it has been amazing how well he has been introducing me, and aiding me in understanding our project. Therefore, I feel my understanding of my project has grown significantly since orientation. Because of how well he introduced me to the topic and developed my mind, I have developed a map of Seismic Station Arrays across the United States and have plotted them on a map using MatLab; more on this later,, and outlined the Precambrian cratonic region with the specific stations we are gathering data for. Since there are 18 Arrays in this data and 101 stations, we have narrowed it to 61 stations for now. We have been gathering the data from these stations now for over a day. As realistic goals do exist, the biggest goal, one that has already been touched, definitely leans towards understanding and comfort of managing programs. This is probably one of the biggest goals I want to check off. At the current rate, I feel this goal will be mastered and I will be more than proficient by the end of my research.
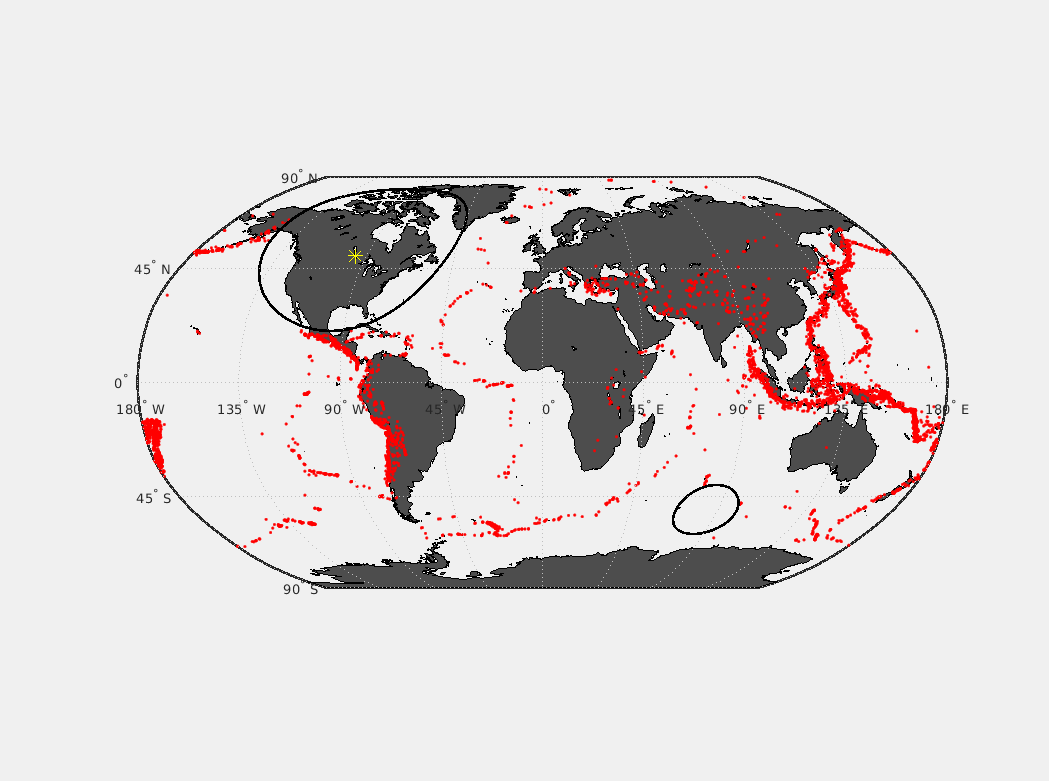
Now that map, it has been a mountain of a learning curve. I mean like Everest big, and I feel there are more to come in the next coming weeks. However, this specific challenge was to just use MatLab to plot all the arrays and stations on a map of the North America continent. It took me so long to understand what and how to do that. Approximately one day of my time was spent on how to make a legend…. Yet alone figure out how to take all the array network stations and plot only the ones within the Precambrian region. (image attached)
Some of the primary papers I will make references to for my research.
Abt, D. L., Fischer, K. M., French, S. W., Ford, H. A., Yuan, H., & Romanowicz, B. (2010). North American lithospheric discontinuity structure imaged by Ps and Sp receiver functions. Journal of Geophysical Research: Solid Earth, 115(9), B09301. [url=https://doi.org/10.1029/2009JB006914]https://doi.org/10.1029/2009JB006914[/url]
Ford, H. A., Long, M. D., & Wirth, E. A. (2016). Midlithospheric discontinuities and complex anisotropic layering in the mantle lithosphere beneath the Wyoming and Superior Provinces. Journal of Geophysical Research: Solid Earth, 121(9), 6675–6697. [url=https://doi.org/10.1002/2016JB012978]https://doi.org/10.1002/2016JB012978[/url]


