Eva Golos
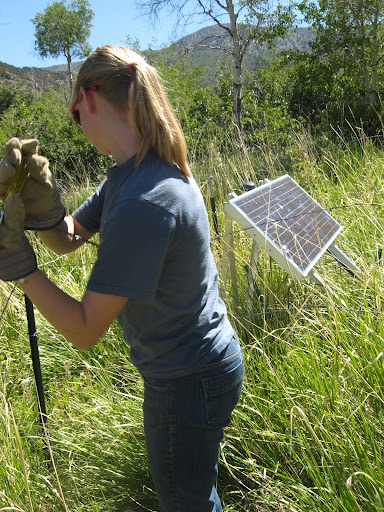
Eva Golos is a student at Cornell University currently completing her research at Stanford University under Dr. Simon Klemperer.
This summer I'm based at Stanford, studying shear wave anisotropy in the Ruby Mountains in northeastern Nevada. The area, part of the Basin and Range region, is a metamorpic core complex and the goal of my analysis is to determine the structure of the subsurface, in particular mapping the Moho and determining whether there are multiple layers of anisotropy. The main method I will be using is a Matlab software program called SplitLab to identify and interpret SKS splitting times from teleseismic earthquakes observed over the past two years.
California Dreamin’
August 10th, 2012
Wow, this is it! Today is my last day at my internship this summer! Please forgive me for what’s sure to be a painfully nostalgic and introspective final post. I’ve been keeping track of my time left in the back of my mind but it still seems pretty darn surreal that my time at Stanford is over. The last few weeks have sped by, but looking back to the beginning of the summer—in Socorro, first meeting all the interns, hiking around in the brilliant New Mexico sun; or my anomalously rainy first day at Stanford, when I rushed in 20 minutes late after becoming abysmally lost; or how I spent a month without sleeping in the same place for more than a week—that seems like a world away now.
I spent much of the first half of this week polishing up my abstract. My first draft that I sent to Simon was returned to me with as much red commented text as initial text. A few back-and-forths later, he pronounced my abstract “splendid,” and I submitted it to AGU with a day to spare! Since then, I’ve been working on my poster, exploring Adobe Illustrator (read: spending a comical 20 minutes trying to figure out how to insert images). I also tried to fit the stations I did to the West and Fouch "lithospheric drip" model. It's not a very close fit; even with moving the center around, the average error is about 22 degrees. However, even West and Fouch's results don't form a perfect circle, and as long as my data looks to be about in line with theirs, (which it does), I'm not too worried. Relatedly, I did manage to improve the image I showed last week. I added a few more stations and fixed the resolution problem:
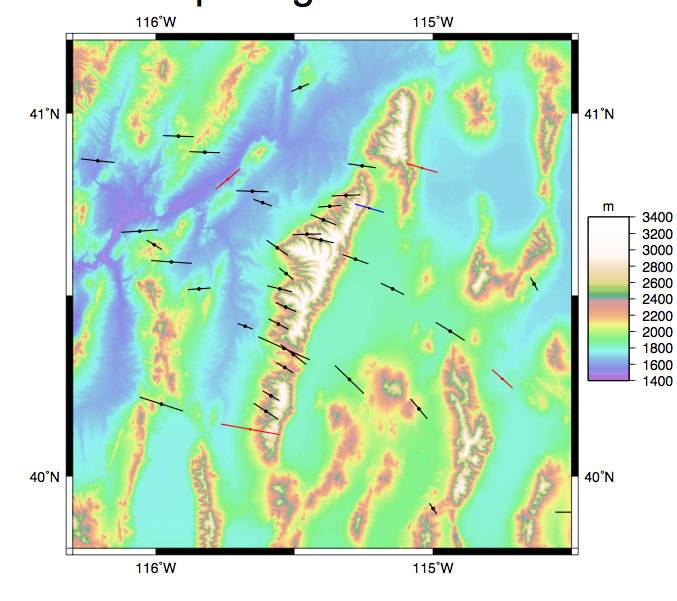
(The different colors correspond to different data: the black stations are from our YX array; the red are from the U.S. Transportable Array campaign, and the lone blue station is data from a USGS station, cited in West's.)
Ten weeks later, here’s my list of goals from the beginning of the summer. Let’s see how I did, shall we?
1. Improve knowledge of seismic methodry: how sensors work, how data is collected and interpreted.
I’ve gotten some sense of this from the orientation and from my fieldwork in Elko. I have enough knowledge about seismic data to take down a station, and download the data… Being not very electronically-inclined, this is sufficient for me.
2. Gain facility with seismic data interpretation and the necessary software (related: improve computing skills, especially in UNIX and programs like GMT)
My computer work mostly encompassed SplitLab, which I’m now a pro at. I’ve also used Matlab, UNIX, and GMT occasionally, and I feel more confident in each. I’m definitely not a coding whiz by any means, but I don’t feel like computers are impediments to my research!
3. Learn to connect seismic data to real features; in particular, to relate anisotropy to physical structures.
It’s just the nature of my project that my results will never be as physically intuitive as, say, a seismic reflection profile, but I’ve become more familiar with the link between anisotropy direction and mantle flow. It was disappointing that I couldn’t distinguish between a crustal and a mantle signal, but when the data don’t support a hypothesis, I just have to find meaning in other aspects of my results.
4. Talk with professors and grad students, and become more comfortable interacting with people in an academic, professional environment.
So. I’ve already identified this as my weak spot and, well, it’s not something that’ll magically resolve itself. This past week I’ve spoken (or, emailed and received no response from) Stanford professors whose work sounded interesting. Certainly I’m better at talking to grad students. I’ll keep working on this, and try not to get too upset with myself.
5. Construct a plan for after graduation next year. This part might involve researching grad schools and/or taking the GRE, even if it seems intimidating right now.
Basically, this is all I've been thinking about lately. I'm not going to lie and say that I've figured out my future over the summer, because I definitely haven't. I've looked at a few school websites, and I'm still *pretty* certain that I'm going to apply to a PhD program. If nothing else, this summer has reaffirmed that I do want to work in geophysics in some capacity, that I do enjoy research. I think I just have to find the right project--it'll come, as long as I keep thinking and keep searching; it's just stressful and maybe a little terrifying to think about all the big changes that are looming on the horizon.
6. Enjoy spending the summer at Stanford! I've never spent more than a week or two at a time on the West Coast and I want to get the full California experience. Some things I want to try: surfing, In-N-Out Burger, and buying/cooking lots of local products. This. I feel like at least in this regard my summer was successful. I’ve been to the beach. I’ve been to the city (several times!). I’ve been to see a musical, to an art museum, to a picnic among the redwood trees, to the farmer’s market on California Avenue, and most recently, to canoe amongst otters, seals, and a multitude of jellyfish. I don't know how much more I could have gotten out of California, and I had a lot of fun living here!
So that's where I am now. Overall my summer was amazing, and I like to think that through the weeks of moving from place to place early on, through sitting in traffic on Highway 101 and finding that I wasn't angry, through the innumerable daytime hours and occasional evenings with my eyes glued to my laptop screen, that I've learned and grown in ways other than the strictly academic. Certainly I've made some fantastic friends whom I'll miss very much and hope to keep in touch with them! If nothing else, the people I've met and the places I've been this summer have made everything worthwhile. I'm looking forward to going back home and being with my family, and, in less than a week, returning to Cornell and the family I've found there as well. But I'll never forget the ever-cloudless skies, the fog creeping over the hills in the evening, the comfortable minimally-furnished room I've lived in, the midafternoon trips to the coffee machine with my fellow interns, the occasional glimpse of the Bay from a hill. I'm excited already to return to the area for AGU, and to reunite with all the other IRIS interns! So this isn't a goodbye; it's a see-you-soon.
Circular anisotropy (or: I actually see some results!)
August 3rd, 2012
Only one more week left here at Stanford! It’s surreal how quickly time has gone. This past week my emotional investment in my research has increased dramatically, as I’ve graduated from the monotony of picking in SplitLab to the actual analysis of my results. I’ve been spending some time with GMT, my old frienemy, to plot the direction of anisotropy at the stations I’ve finished. I’ve tried two different methods of compiling the events per station—both a simple average and a stacking method that superimposes the energy maps produced in Splitlab. The second method seems more reliable, as it’s less susceptible to noise. Here is my most recent version of the graphic:
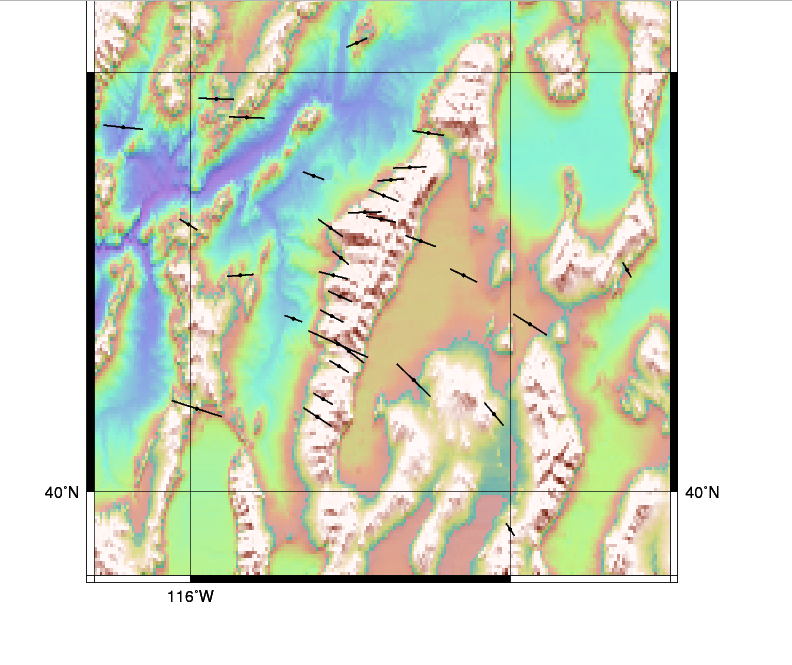
Obviously, there’s still some work to do. The topography looks pretty pixelated, and I need to add a scale bar and axis labels.
From the data I have, it doesn’t look like there’s any remarkable variation of fast-axis direction with backazimuth, which would indicate two-layer anisotropy. So, the hopes Simon and Mairi had had of being able to separate crustal and mantle signals probably won't come to fruition. What is interesting is how the direction seems to change spatially, rotating clockwise as you go west. This preliminarily supports a theory I’ve read about in a paper*, which proposed a “lithospheric drip” beneath the Great Basin of Nevada. One of the main lines of supporting evidence for this was a circular pattern of anisotropy formed as the lithosphere flowed inward. My map, the northeast segment of this circular region, certainly seems to agree with this geometry of anisotropy.
In any case, I'll have plenty to discuss in my AGU abstract. Next week, expect lots of emotions and reflecting and thoughts. (as well as potentially a short review of Les Mis, which I'll be seeing in San Francisco next Wednesday!)
* West, J. D., Fouch, M. J., Roth, J. R., Elkins-Tanton, L. T., Vertical mantle flow associated with a lithospheric drip beneath the Great Basin. Nature Geoscience. 2, 439-444 (2009).
Picking along
July 27th, 2012
Once again, another week has flown by in a blur of SplitLab picking. I’ve been skipping stations in order to finish the B and C lines, but they’re spaced closely enough that I should have still have good coverage (and if I get bored during the fall, I have something to do).
Last weekend my parents and my brother came to visit me, which was fun. It’s been horrendously hot in Wisconsin, so they enjoyed getting out to dry, moderate California. We passed the time in the traditional Golos Family Vacation Style, which is to say, spending every waking moment driving, eating, hiking, walking, or otherwise frantically trying to take in all the sights of the Bay Area. In three days, we managed to cover Berkeley, downtown San Francisco, Año Nuevo State Park (again for me, though we got to see elephant seals this time!), Butano State Park, Santa Cruz, Sonoma, as well as the Stanford campus. It was exhausting, but really fun to more parts of the region, and to hang out with my family, since I’ve only spent a week at home since January!
Because most of my week at work was spent picking, I don’t have many images that will look too different than what I’ve posted here already. Simon warned me earlier this week about “getting lost” in my event-picking and losing sight of the bigger picture of the project; I could definitely see that beginning to happen, so I’ve on and off been tinkering with a GMT script from a grad student that will plot the splitting parameters for each station on a map. It’s hard to change my focus, though, when I’ve been in the Picking Zone all day and I just want to get through as many stations as possible. My general approach to working has always been to just grit my teeth and slog through, even if—especially if—it’s a tedious task. So I guess this is another example of how doing research can be really challenging in subtler ways than the usual coding problem: I have to learn to be flexible in terms of how I prioritize my tasks, and learn to be able to switch mindsets quickly.
Fortunately, I should be wrapping up my picking today, and next week will begin the fun stuff—trying to actually connect my SplitLab results to the anisotropy structure beneath the Ruby Mountains. I’m excited and a little apprehensive for this part. I chose this project because I wanted to see how to make this connection between seismic data and actual geology. So in a way, these last few weeks are a test, to see if this is really the sort of work I want to do in grad school. And more immediately, it’s also a test of my SplitLab skills—I’ve spent nearly two months learning and using the program, so hopefully my data will yield some sort of meaningful result!
Baby got backazimuth
July 20th, 2012
This week I've been steadily chugging along, picking events in SplitLab. I've finally finished the A stations, which run down the central part of the Ruby Mountains. It's pretty mind-numbing work, to be honest, but I've been listening to lots of NPR podcasts and a Bill Bryson audiobook, which help. Now I'm working on the D stations, which are scattered around the periphery of the area and were operating for only a few months, so they should go quickly. I only set aside one more week for picking, so with only about one-third of the stations done, I'll have to chose a representative sample of the remaining stations in order to get good coverage.
So I'm noticing a problem in terms of the locations of useable events. In order to see the SKS phase, I can only use events with a magnitude of greater than 5.5, and a distance of 90-130˚ from my stations. Unfortunately, the vast majority of earthquakes fitting these criteria are located near Indonesia, and sometimes Papua New Guinea. So I've got really great coverage at a backazimuth of around 270˚, but virtually nothing between 0 and 180˚. In fact, only one station (A14) has a somewhat-relevant point from this direction.
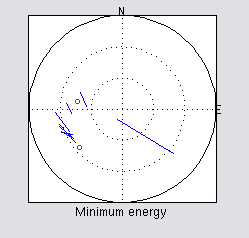
This image isn't the most intuitive, so I'll take a moment to explain it (it took me a while to fully understand all of it). It's centered at the station, with each small blue line representing one of the points I have picked. Each event is plotted according to its backazimuth and distance to the station, while the angle of each line from 0˚ represents the fast-axis splitting direction. The length of the line is proportional to ∂t, the time difference between fast and slow axes. Red circles represent null events, in which backazimuth is either parallel or perpendicular to the fast axis. This particular station was exciting, because it can be seen that there is a point with a backazimuth in this "shadow" area where I haven't gotten many points (139.54˚, to be exact). It's not necessarily a very good data point--notice how much larger the splitting time is than for the other points, which makes me suspicious--but it's reassuring that it appears to be yielding a splitting direction similar to the other points.
Last Saturday I went with some other interns from various Stanford programs to Hollister, California, which is about an hour or so south of Palo Alto. It's near the area where the San Andreas Fault splinters a bit, with the main portion of the SAF stepping to the West, and the Calaveras Fault (and later, the overdue-to-rupture Hayward Fault) splitting off to the East; it is between these 2 systems that the San Francisco Bay lies. Anyway, Hollister lies directly above the Calaveras, which is currently slowly and steadily creeping. This is in contrast to the stick-slip model of motion, which is associated with strain buildup and sudden earthquakes. So Hollister doesn't experience large earthquakes, but everywhere there is evidence of the fault slowly chugging along:
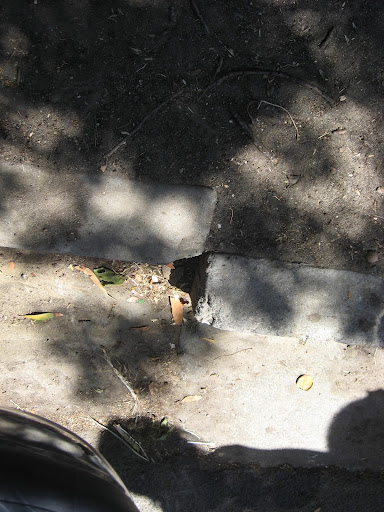 Here, a cracked curb clearly shows the right-lateral motion of the plate.
And here, a sidewalk and concrete fence are in constant need of repair. It's a small price to pay when you consider that Hollister residents don't live in fear of another large earthquake like many Californians.
And finally, we stopped at the mission at San Juan Bautista on our way back into town. I learned that El Camino Real, a major road that goes along the Peninsula, which I live a block away from, was originally the name of the road connecting the Spanish missions in California, spanning almost the entire state.
Halfway There
July 13th, 2012
So last weekend marked the official halfway point of my internship (!). I realized I never really acknowledged that in my blog post last week, though I did speak with Simon and Mairi to outline a more definite timeline for the rest of my time in Palo Alto. So in honor of this occasion, I’ll spend some time looking over the goals I set in the beginning of June:
1. Improve knowledge of seismic methodry: how sensors work, how data is collected and interpreted.
I got to work with the sensors and the data acquisition a little bit when we were out in Nevada. I can’t pretend that I understand all the electrical complexities of the equipment, but I know the basic components of the stations, and I can now download data from the SOD database.
2. Gain facility with seismic data interpretation and the necessary software (related: improve computing skills, especially in UNIX and programs like GMT)
I’m definitely waaayy better with SplitLab now. I’ve written a few scripts in UNIX, and though I don’t use Matlab too much outside of SplitLab, I’ve brushed up my skills just by helping some of the other interns with their codes.
3. Learn to connect seismic data to real features; in particular, to relate anisotropy to physical structures.
Haven’t done much with regards to this area, but I’m planning to spend a lot more time focusing on the geological interpretation during August.
4. Talk with professors and grad students, and become more comfortable interacting with people in an academic, professional environment.
I’ve gone to a few events, and I met a lot of people when I first arrived. However, I’ve noticed that once I settle into a new workplace and get to know the people immediately around me, I’m not that good at branching out and meeting other people. So I’m still going to work on this one.
5. Construct a plan for after graduation next year. This part might involve researching grad schools and/or taking the GRE, even if it seems intimidating right now.
Well, I signed up for the GRE and spent a little time last weekend looking at some potential schools/advisors. This is something I can continue to chip away at over the next month.
6. Enjoy spending the summer at Stanford! I've never spent more than a week or two at a time on the West Coast and I want to get the full California experience. Some things I want to try: surfing, In-N-Out Burger, and buying/cooking lots of local products. From biking around, I’ve gotten pretty familiar with Palo Alto and with Stanford (a nontrivial task, considering how huge the campus is). I haven’t been surfing, but I did go boogie-boarding, and I did have In-N-Out Burger (I approve!). There’s a nice farmer’s market on California Avenue, very close to my apartment, that I checked out last weekend. I’m planning on getting produce from there more, since Trader Joe’s though overall a wonderful place, has less of a fresh produce selection than I’d expected.
So that’s a pretty good summary of both how my summer has gone, and what I can expect for the next month.
This week, my work has gone slower than I’d hoped. The UNIX code that I’ve been using to rename and sort my data files—to make them more SplitLab-friendly—was giving me a lot of problems on Monday. Alex, the other intern in my lab who is using SplitLab, showed me how to re-order the data so that I didn’t have to do any re-formatting. He also showed me how to make sure the components were all of the same time span, which solved another problem I’d been having. So I ended up just re-ordering all of my data. When I finally started to go through the stations, I realized I have way more events than anticipated—sometimes over 300 per station! I mentioned earlier that I’d constructed a rough timeline? Well in that I had assumed I could finish 2 stations per day; it doesn’t look like that’s going to be possible, unless I can improve my speed considerably.
Mairi told me not to worry, that I could finish the work even after I return to New York in the fall (thank goodness for ssh –Y!)
In addition, one of the grad students tinkered with the SplitLab code to produce a nice colorful map of the anisotropy parameters. This is so that we can stack all the results for a single station and hopefully reduce the error due to noise. It was cool to see the process first-hand of a student reading about a technique in a paper and deciding to implement it. Plus, it produces really cool-looking images:
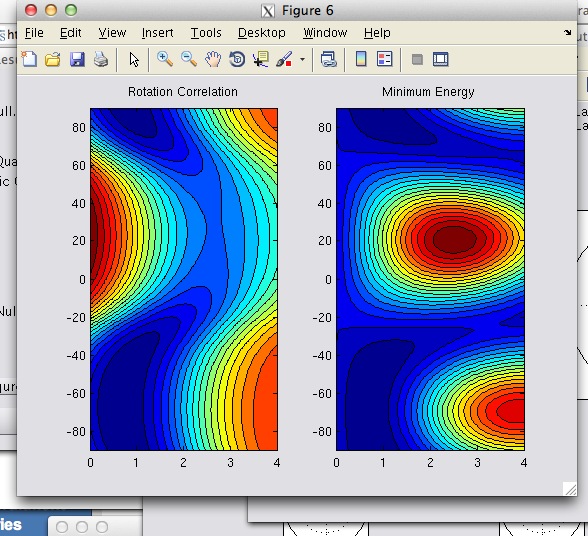
This weekend I’m going on a field trip sponsored by the School of Earth Sciences to Hollister to see the San Andreas Fault. There’s a lot of slow-slip faulting there, and it should be interesting to see firsthand. I’ll post pictures next week!
Holiday weeks and fake earthquakes
July 6th, 2012
This week has gone past so quickly, mostly because it’s been so fragmented due to the 4th of July. It was pretty nice having a mid-week break, especially one so filled with sun and good food, and it’s like there have been two two-day weeks. It also means that I didn’t get quite as much done this week as I normally would.
Some friends of mine from school came out to visit me last weekend, and it was really fun to catch up with them and show them around the area. This story isn’t completely unrelated to seismology, because we visited San Francisco, where we saw a really good exhibit on earthquakes at the Academy of Sciences in Golden Gate Park. There was a simulation house that imitated the Loma Prieta 1989 quake, as well as the San Francisco earthquake in 1906. Never having experienced a real earthquake, I can’t really comment on how accurate the simulation was—they did tell us that there wasn’t any vertical motion—but I’m pretty sure that I felt some Love waves! Later we saw a planetarium show that we’d thought would be about the sun, but it turned out that it was also about earthquakes! Not much information was new to me, but it was entertaining, and they had some very good digital models of fault planes and seismic energy radiating outward.
In terms of my research, I’ve been picking events from the four Transportable Array (TA) stations located nearby our own network. It took me a full day to finish the first one (about 180 events); however, I got faster as I went on, and finished the later ones more quickly. Mairi has finally deemed me ready to begin processing our Ruby data in earnest, so I’ve been downloading two years of data for 50 stations. It’s a huge amount of data—the code has been running for almost two full workdays! Currently it’s giving me some trouble, so hopefully I won’t have to restart it completely. When that finishes I’ll finally be able to really dive into the bulk of my analysis.
Hope everyone had a good holiday week! For those of you affected by all the crazy weather in the Eastern States, hope that you're coping and doing all right.
Mystery Pulses
June 29th, 2012
One of the most frustrating things I've had to accept has been that not all of my data will be useable. In fact, well over half of my data are most likely not going to yield useful results--either SplitLab produces an error, or the SKS wave signal isn't distinct enough, or the phase has traveled from a null direction (perpendicular or parallel to the fast axis of propagation), or the seismogram is obscured by noise, or... Basically, there can be any number of reasons that a seismogram is bad. And as someone who as a matter of principle doesn't like to waste (evidence: earlier this week I accidentally left a jar of marinara sauce out all day and it went bad, but I waited several more days before actually throwing it out because I felt bad about not finishing it) it can be difficult to just skip over a seismogram. However, I've had to learn to recognize when one isn't going to give me a good measurement right away, because otherwise I'm just going to spend a long time trying various time frames and filters and never going to gain anything meaningful.
Example: Alex (another undergrad intern, who is using the same methodry I am but for a different area) and I have both noticed that seismograms sometimes show what I like to call Mystery Pulses--wave packets that occur periodically but at different times on each component, such that they block out any other sort of signal.

(also guys, I'm really proud of my arrows and text box on this picture)
Whenever I see these pulses, I know that there's no way I'm going to get a useable result. Sometimes I don't even realize that they're present until I change the filter, zoom out, and recognize, with a small quiver of horror, the unpleasantly familiar oscillations of these infernal Mystery Pulses of Doom. Not wholly unrelated, anyone else realize that they've become far too emotionally invested in some squiggles on a computer screen?
Field work, a photodump, and some SplitLab. And more field work.
June 22nd, 2012
Another week done! I can't believe that it's been almost a month since the orientation--constantly moving around and going out to the field have really messed up my perception of time. This coming Monday I'll finally be able to move into the room that I'm renting, and I'm not going to lie: I'm super excited to spend more than a week at a time in one location. This nomadic lifestyle I've been leading is exhausting!
Last weekend we finished up taking down all the seismic stations in Nevada. We got to do a little bit of additional hiking around in the Rubies, and it was nice to get a chance to climb around on some rocks. As promised, here are some pictures from the trip:
(One of the seismic stations)
Struggling with a barbed wire fence. I'm not going to be disappointed if many years pass between now and the next time I encounter barbed wire! And the middle seat of a pickup truck cab.
This is Angel Lake, in the (highly metamorphosed) northern side of the Ruby Mountains. For my fellow rock nerds out there, this is the section below a mylonite shear zone; saw some nice boudinage right above the snow packs at the bottom of the image.
On Monday we had to pack up all the stations and wait for them to be shipped off, which ended up taking almost all day. By the time we got back to Stanford, it was one in the morning (and we found out the hard way that Panama Mall in front of the building we work in is blocked off). On Tuesday I had a chance to settle back into the routine of being in the office, before heading out Wednesday to do field work again. This time, it was only for a day, as we were assisting the USGS (including Leah, another Bay-Area IRIS intern!) with an active-source seismic array. It was similar to the experiment we did out in the desert in Socorro, except that instead of a plate, we were hitting a huge metal block that another person had to stand on to get shear waves to propagate well. Definitely a little bit unnerving to watch someone swing a sledgehammer at your feet! The line we used was 600 m long, so it took the better part of a day. In addition, I realized just how addicted to caffeine I've become, as I didn't get a chance to drink coffee in the morning and subsequently grappled with a caffeine-withdrawal headache for the better part of the day. Luckily, we were in a relatively shady path, in a beautiful state park with a view of the ocean! And they gave us free pizza at the end.
All this field work left me only a few days in the office looking at my data. Fortunately, SplitLab has been cooperative lately, and I've finished going through the first two months of data for all my stations. It took a while to get used to how I evaluate the data because it's not very physically intuitive--basically, SplitLab gives me a seismogram reading, and I can tell it to identify the SKS wave phase (a wave that passes through the mantle as a shear wave, through the outer core as a P-wave, then again as an S-wave as it propagates once more through the mantle; the anisotropy of this phase is what I'm primarily interested in). Once I isolate the SKS wave, SplitLab produces a bunch of graphs, which I use to determine the quality of the measurement. The following picture is from an example data set that comes with SplitLab, and is indicative of good-quality:

The two rows of graphs use two different methods of calculation; I'm most interested in the second, third, and fourth graphs in the second row. The second one should ideally have peaks and troughs in blue, and a flat line in red; the third graph displays particle motion and should have a blue spiral and a flat red; the fourth graph identifies the parameters I use to characterize anisotropy (fast axis direction, and time delay) and ideally shows contours enclosing a single point. So the image above is "good" quality.
However, a lot of my data has been looking more like this:
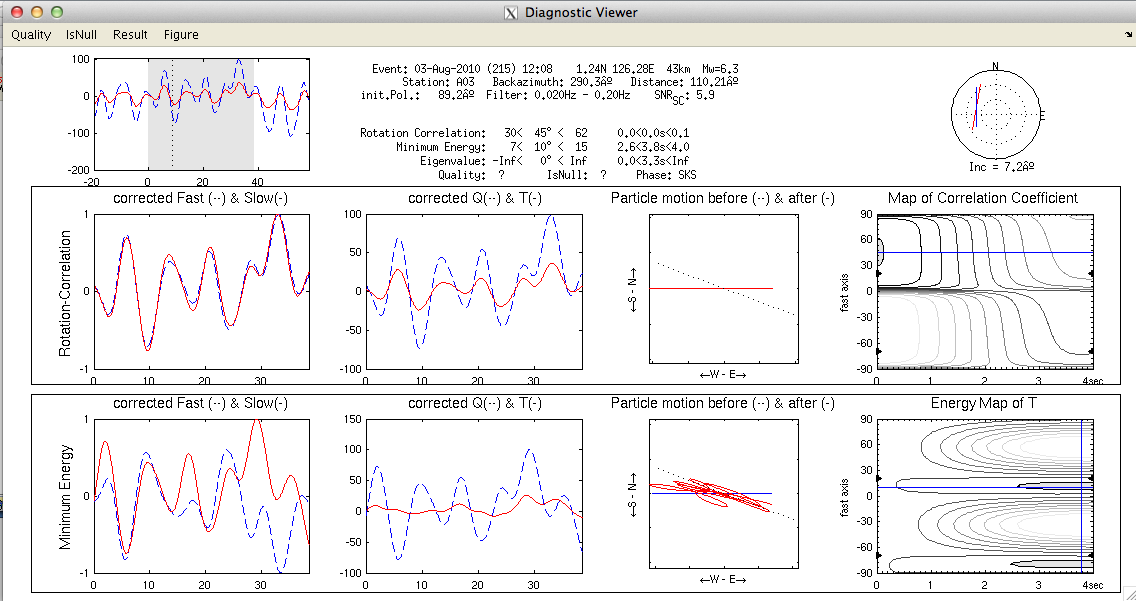
This isn't even actually a terrible image once you disregard the last energy map; I just didn't feel like digging around too much to find a worse one. It's worth noting that probably 60-70% of the seismograms don't even display. Gradually the data has been improving as I work, or maybe I'm just getting better at applying filters and picking time windows. Either way, today I'm planning on discussing my results with Mairi and then hopefully I'll be able to start downloading and processing all two years' worth of data!
Until next week!
Mountains Beyond Mountains
June 15th, 2012
I'm writing this post from Elko, Nevada. This little town is home of the National Cowboy Poetry Gathering and a plethora of casinos, but more importantly, offers convenient access to the Ruby Mountains. I've been here for the past two days, along with grad student Mairi and another intern in my lab this summer, Caroline. We're removing the last of the stations from a two-year seismic campaign in the Rubies, which is the source of the data I'll be working with.
We only have to take down eight stations (we've done five in the last two), but we've had to drive to some pretty remote locations--through pastures and campsites, over streams and past several bewildered cow herds. Being only twenty, I'm not technically supposed to drive the rental truck we're using, but I've had plenty of experience leaping out to open gates as we rumble down a dubious boulder-strewn path. The work is fairly strenuous--lots of digging carrying heavy stakes and batteries, and carefully trying to roll up barbed wire without significant blood loss. The first station we visited yesterday was especially stubborn--we spent about an hour alone pulling up/bending stakes. We've allowed ourselves a little bit of extra time, just because some of the sites are so difficult to access, but hopefully this will give us a chance to see more of the mountains, which are beautiful! I've been using my camera, but of course I forgot my connection cable, so I'll post some pictures next week.
In other non-field news, I did manage to get SplitLab to cooperate properly last Friday! There are five or six undergrad interns working under my professor this summer, and at least one other one will be using SplitLab as well, so it'll be really great to have other people to sound off on and help troubleshoot.
Finally, some updates on my goals this summer: being in the field, I haven't had much of a chance to make progress on my technical goals, but I did get a chance to hit the beach at Santa Cruz last weekend with a friend from Cornell who lives in the area. I tried boogie-boarding (not the same as surfing, but cheaper and less dangerous) and got pushed around quite a bit by the Pacific Ocean. While there, I saw a sea otter swimming, less than five feet from me! Then we dropped by In-N-Out Burger on the way back to the Bay Area, so that's at least one legitimate goal accomplished. Until next week!
Getting Started
June 7th, 2012
Hello from sunny California! Today is my fourth day of working at Stanford and I feel like I'm settling in nicely. Things were a little hectic at first--my flight from the intern orientation session in New Mexico was delayed (first due to weather and then due to mechanical problems) so I ended up having to stay overnight in Denver last Saturday. Luckily for me, fellow intern Ayla was on the same flight so I had a travel buddy. Then I was rerouted to San Francisco--originally I was supposed to fly to San Jose--so I spent much of Sunday trying to track down my luggage.
Stanford is a beautiful campus and I'm really enjoying working here so far. All the faculty and grad students I've spoken to have been really friendly and accomodating. In addition to Dr. Klemperer, a grad student named Mairi is overseeing my research, so I've got a number of people to go to for help. Plus, Lily--another IRIS intern!--is also working in my lab, so I have someone to commiserate with and to remind me to update my blog! I've actually run into quite a few Cornell alumni (including Dr. Klemperer), which is always exciting.
I spent the beginning of the week meeting new people, figuring out how to get my laptop into the Stanford wi-fi network (which turned out to be a very non-trivial task), and reading about my project. In the days since, I've become familiarized with SplitLab, a software that analyzes shear wave splitting, which will be my main tool for this project. It's a helpful program when it works properly; unfortunately, I've only gotten it to cooperate for one afternoon so far. I can already tell that SplitLab is going to cause me a lot of frustration in the next few months. I will be using it to analyze SKS shear wave splitting beneath the Ruby Mountain Metamorphic Core Complex in Nevada, trying to map anisotropy in the subsurface and eventually linking this to actual geologic structures.
I guess now would be a good time to discuss a few goals that I've set for myself this summer:
1. Improve knowledge of seismic methodry: how sensors work, how data is collected and interpreted.
2. Gain facility with seismic data interpretation and the necessary software (related: improve computing skills, especially in UNIX and programs like GMT)
3. Learn to connect seismic data to real features; in particular, to relate anisotropy to physical structures.
4. Talk with professors and grad students, and become more comfortable interacting with people in an academic, professional environment.
5. Construct a plan for after graduation next year. This part might involve researching grad schools and/or taking the GRE, even if it seems intimidating right now.
6. Enjoy spending the summer at Stanford! I've never spent more than a week or two at a time on the West Coast and I want to get the full California experience. Some things I want to try: surfing, In-N-Out Burger, and buying/cooking lots of local products.
Another update coming next week!


