David Small
David Small is a student at UC Santa Cruz currently completing his research at University of California Riverside under Dr. Heather Ford.
Th focus of this project is to better understand the complicated nature of the Australian Crust. Composed of several different cratons, Australia is home to very rich and complicated geology. Through analyzing data from 6 different seismic stations throughout the continent, I will attempt to model the layers of anisotropy in the continental crust. This will be done through analysis using Ps receiver functions for the different seismic stations. Then through modeling, I will be able to determine the rich tectonic history and the paleo-deformation direction of the region.
Week 8-9: Nearing the End
August 30th, 2018
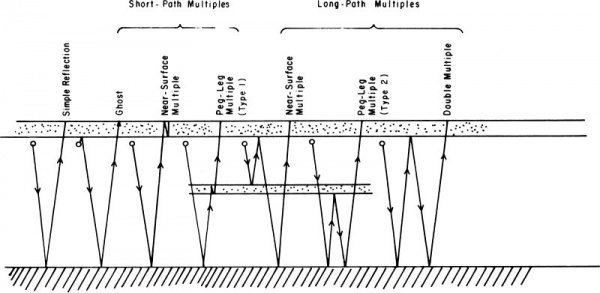
These past two weeks has been predominantly focused on furthering my interpretations of the receiver functions. One thing that must be taken into account when making interpretations of receiver functions is the arrivals of seismic wave multiples. Multiples are created from the reflection of a seismic wave from either the surface (near surface multiple) or other deeper layers. These waves bounce of the layers and arrive later than they would have if they did not travel in an inhibited path. The problem that they pose when trying to understand what the receiver functions show, they can be interpreted as a structure rather than a multiples.
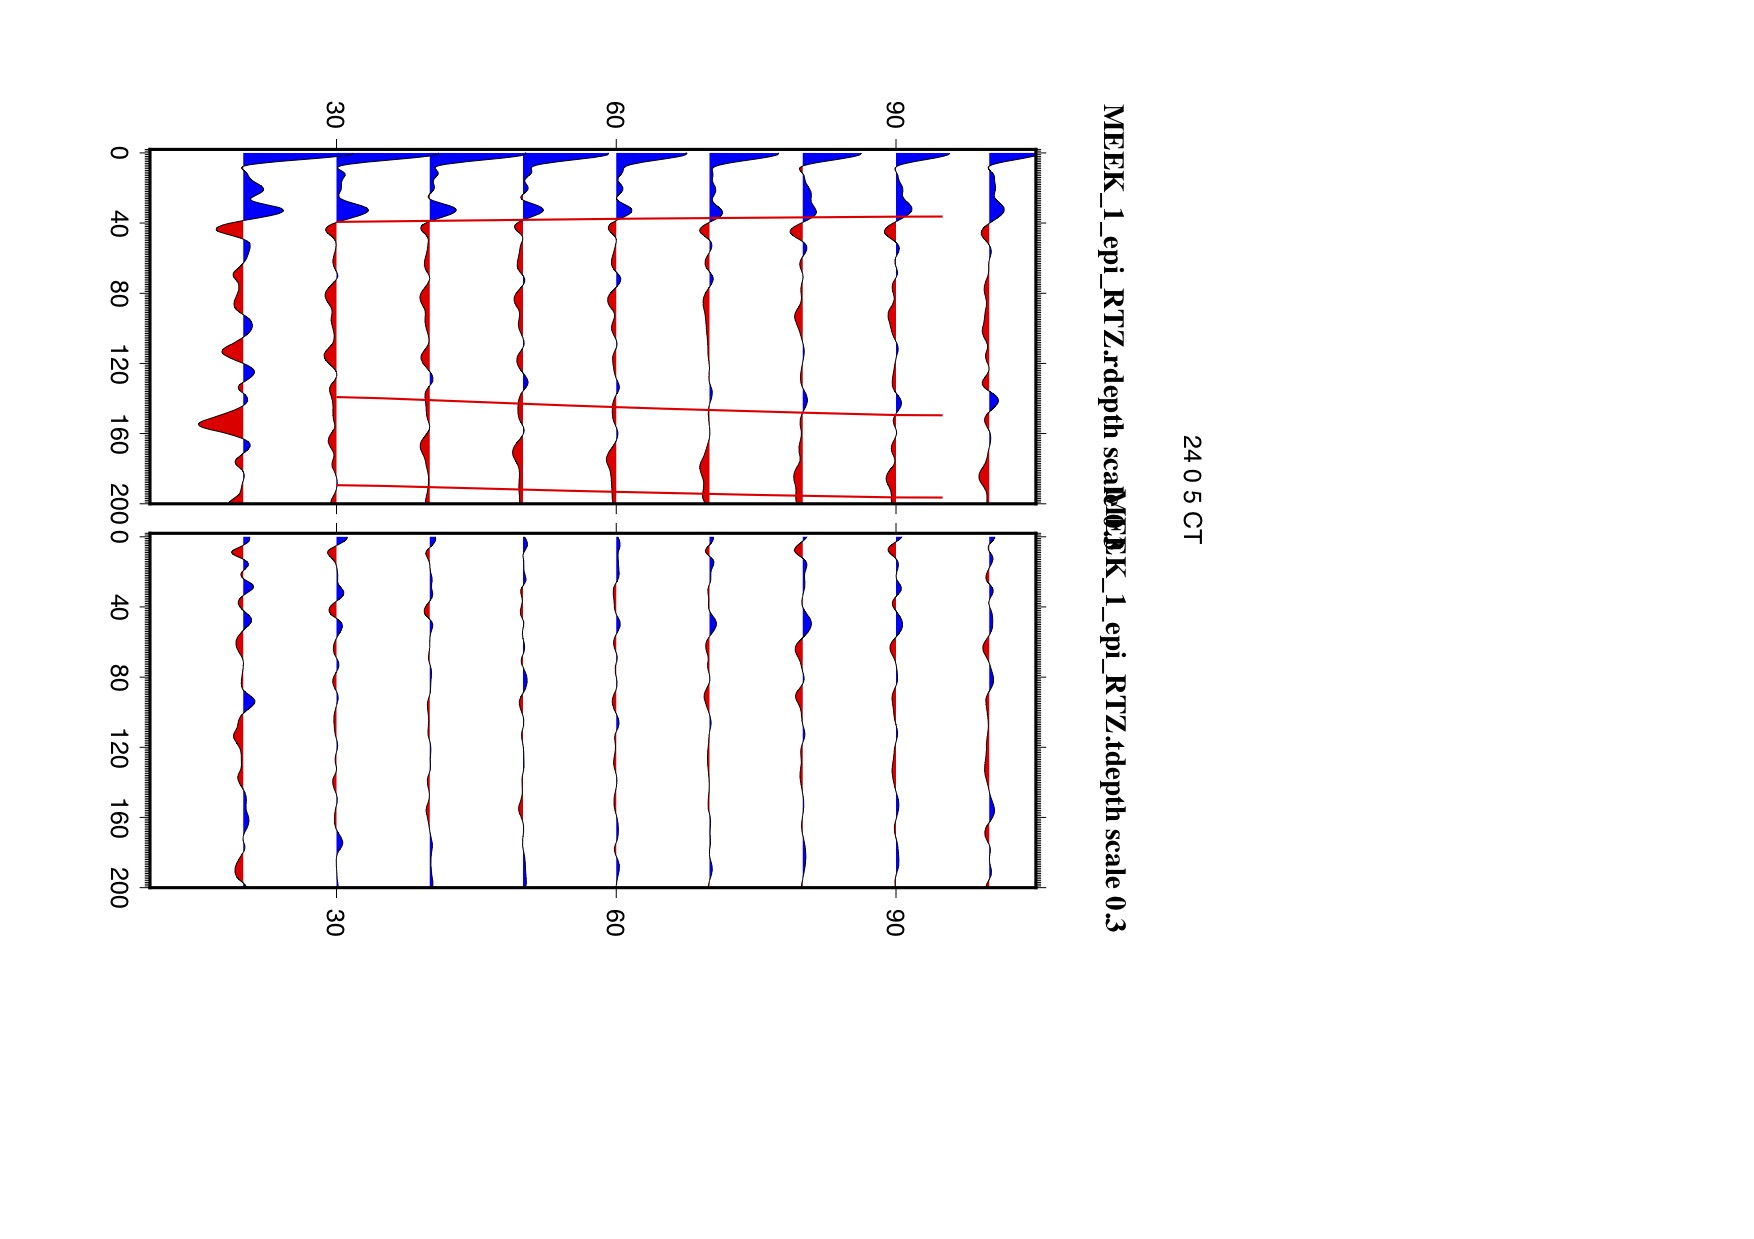
To image the multiples in the receiver functions I created a code that given a velocity ratio, moho depth, and the TauP toolkit would output the specific Tpsps and Tppps multiples. These are different p to s converted wave multiples. I then superimposed these multiple arrivals on the epicentral receiver functions in order to see if the multiples are present for the different stations. For example, EIDS has a clear Tppps multiple present around 140 km in depth, so when any information from these general area of the receiver function should not be used for interpretation. Luckily, none of the multiples seemed to provide an issue for interpretation.
 order to better tell if areas of interest are either dipping structure or layers of anisotropy, I have created roseplots to visualize these areas. These rose plots simply create a point that is color coded for velocity phases for each back azimuth. These not only isolate the information of interest, but their shape and orientation really make it clear whether or not this depth contains a four lobed polarity reversal (layer of anisotropy), two lobed polarity reversal (dipping structure) or neither. Attached is a really clear example of a two lobed polarity flip for the station KMBL. This can be interpreted most likely as a dipping structure at that specific depth.
My project initially was centered around the interpretation of the lithosphere as a whole, however, it seems as though the most information are clearest structure present is in the crust. As the internship has continued it has become more and more apparent that Australia has a very complex crust that is semi specific to each station. It does not seem like most of what is present at one station continues throughout other stations. With this in mind, I have started compiling things together and preparing to start working on my poster for AGU.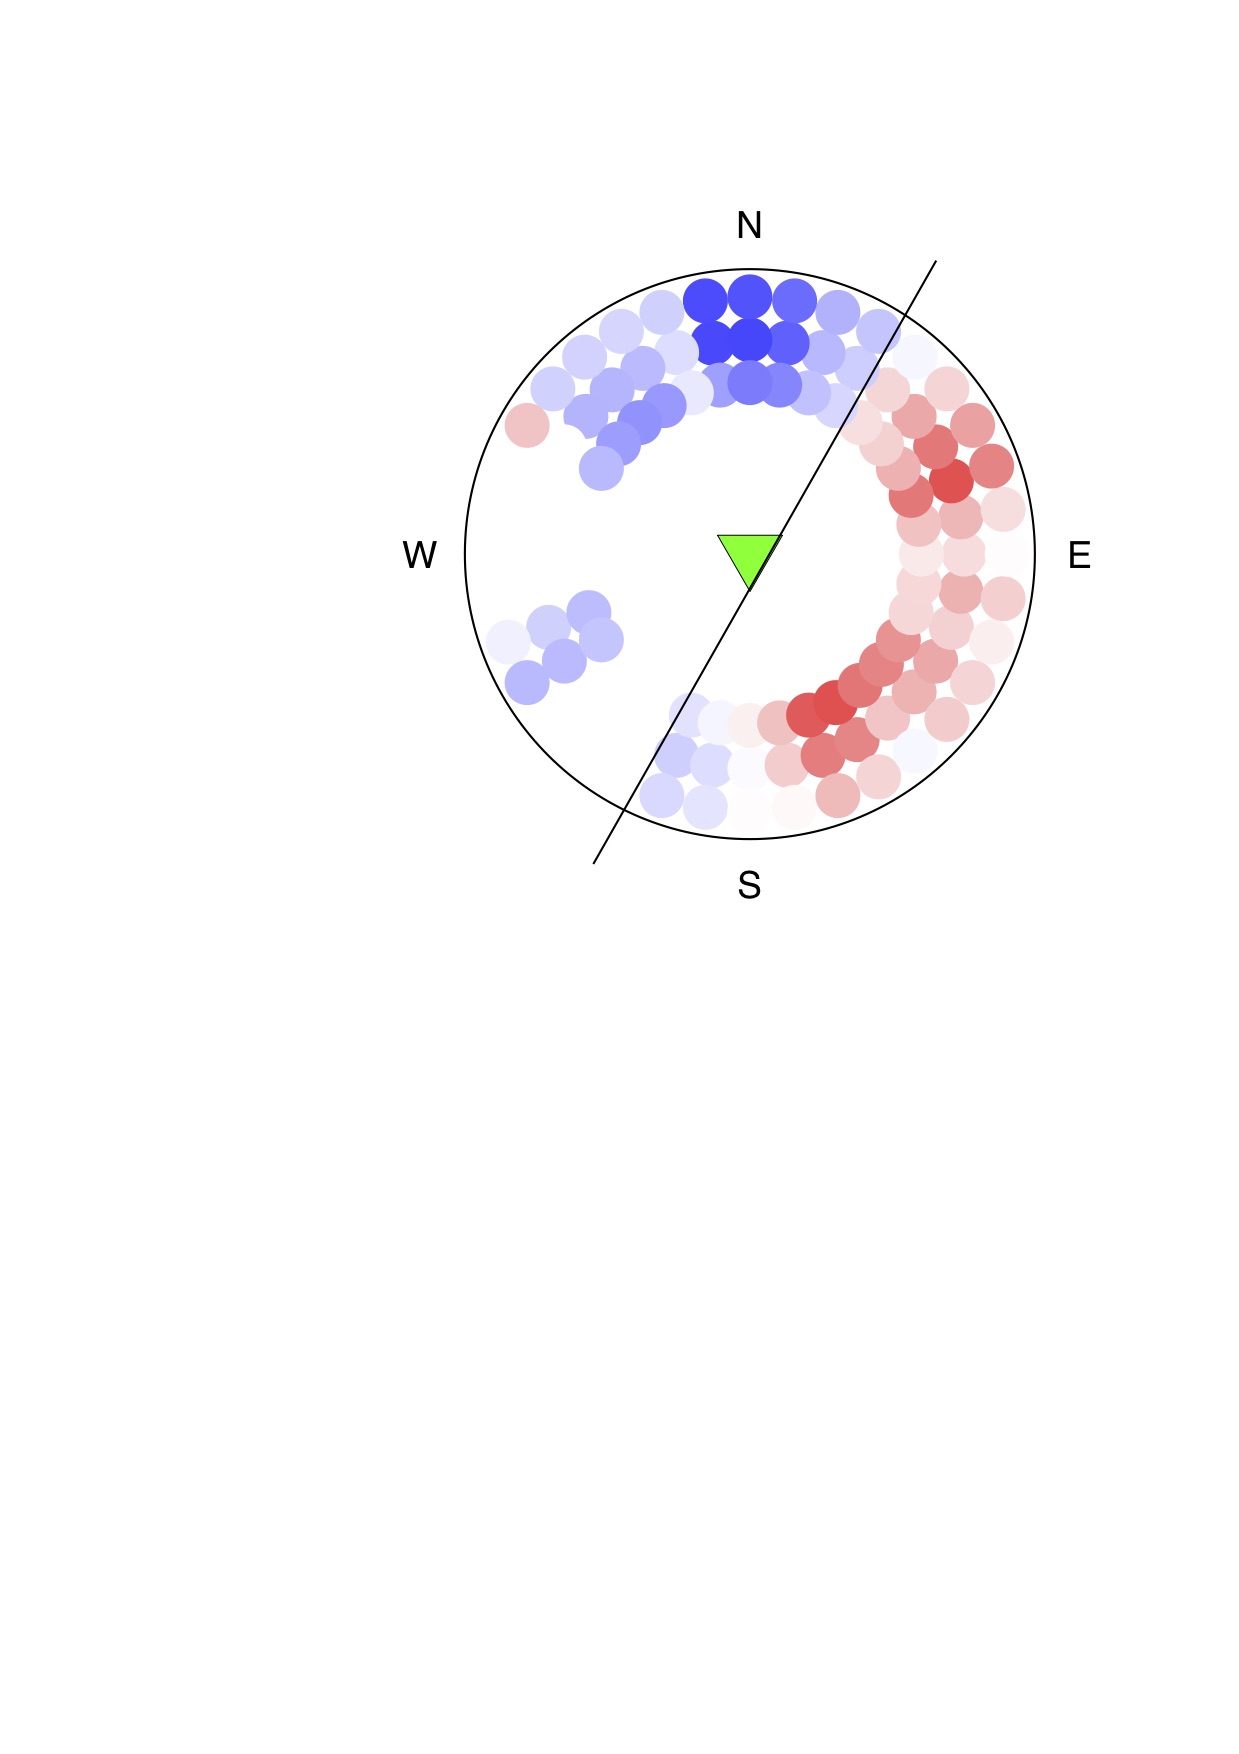
Outside of the specific research project, my mentor and others in the department have been having a weekly book club for Assembling California by John McPhee. I would definitely recommend this book to most people. It’s not only very informative about the tectonic history and the geology of California, but also very easy to understand even for those not super up to par on their geology terms.
Week 6-7 :
August 24th, 2018
Well a little late but here it is! These two weeks were filled with preparing my results in a more usable fashion and prepping more data in order to make a more comprehensive interpretation. When I first created the receiver functions for the stations

, they were in seconds of arrival time. This means that the waves at certain times either came in sooner (positive) or later (negative) than what the velocity model would have projected. Because most people cannot simply relate ti
me to depth, the receiver functions must be migrated so that they can be displayed in depth. In order to do this I spent many days fixing and altering a code that when given the specific data, velocity model, and vpvs ratio, the data could be converted to depth.
I also spent some time looking at previous studi
es’ data and using their data to make velocity profiles for each station. We had previously thought (and had been warned) that many parts of Australia are covered in deep sedimentary basins that would skew the receiver function results. Althoug
h many portions of Australia contain basins, the stations I am using were not affected by them. I determined this by looking at the created velocity models. If the basins would be an issue, the profiles would show at shallow depths a large velocity jump. Seismic velocities are much slower in sedimentary basins than in basement rock. This was not observed enough to raise caution for the receiver funcion results.
Thebiggest challenge this summer was learning new skills and also learning how to problem solve on my own. For most of college, especially in classes, you have the luxury of getting help from the professor and classmates. However, throughout the project there are less people that are able to help. Although my mentor is amazing and will help graciously, I have found it more and more rewarding and enriching to figure thing out as best as I can on my own. At first it was scary attempting portions of the project with almost no prior knowledge. But as time progressed and I became more comfortable on my own, this challenge became less of an obstacle.
Week 4-5 Red and Blue has me feeling some type of way :)
July 26th, 2018
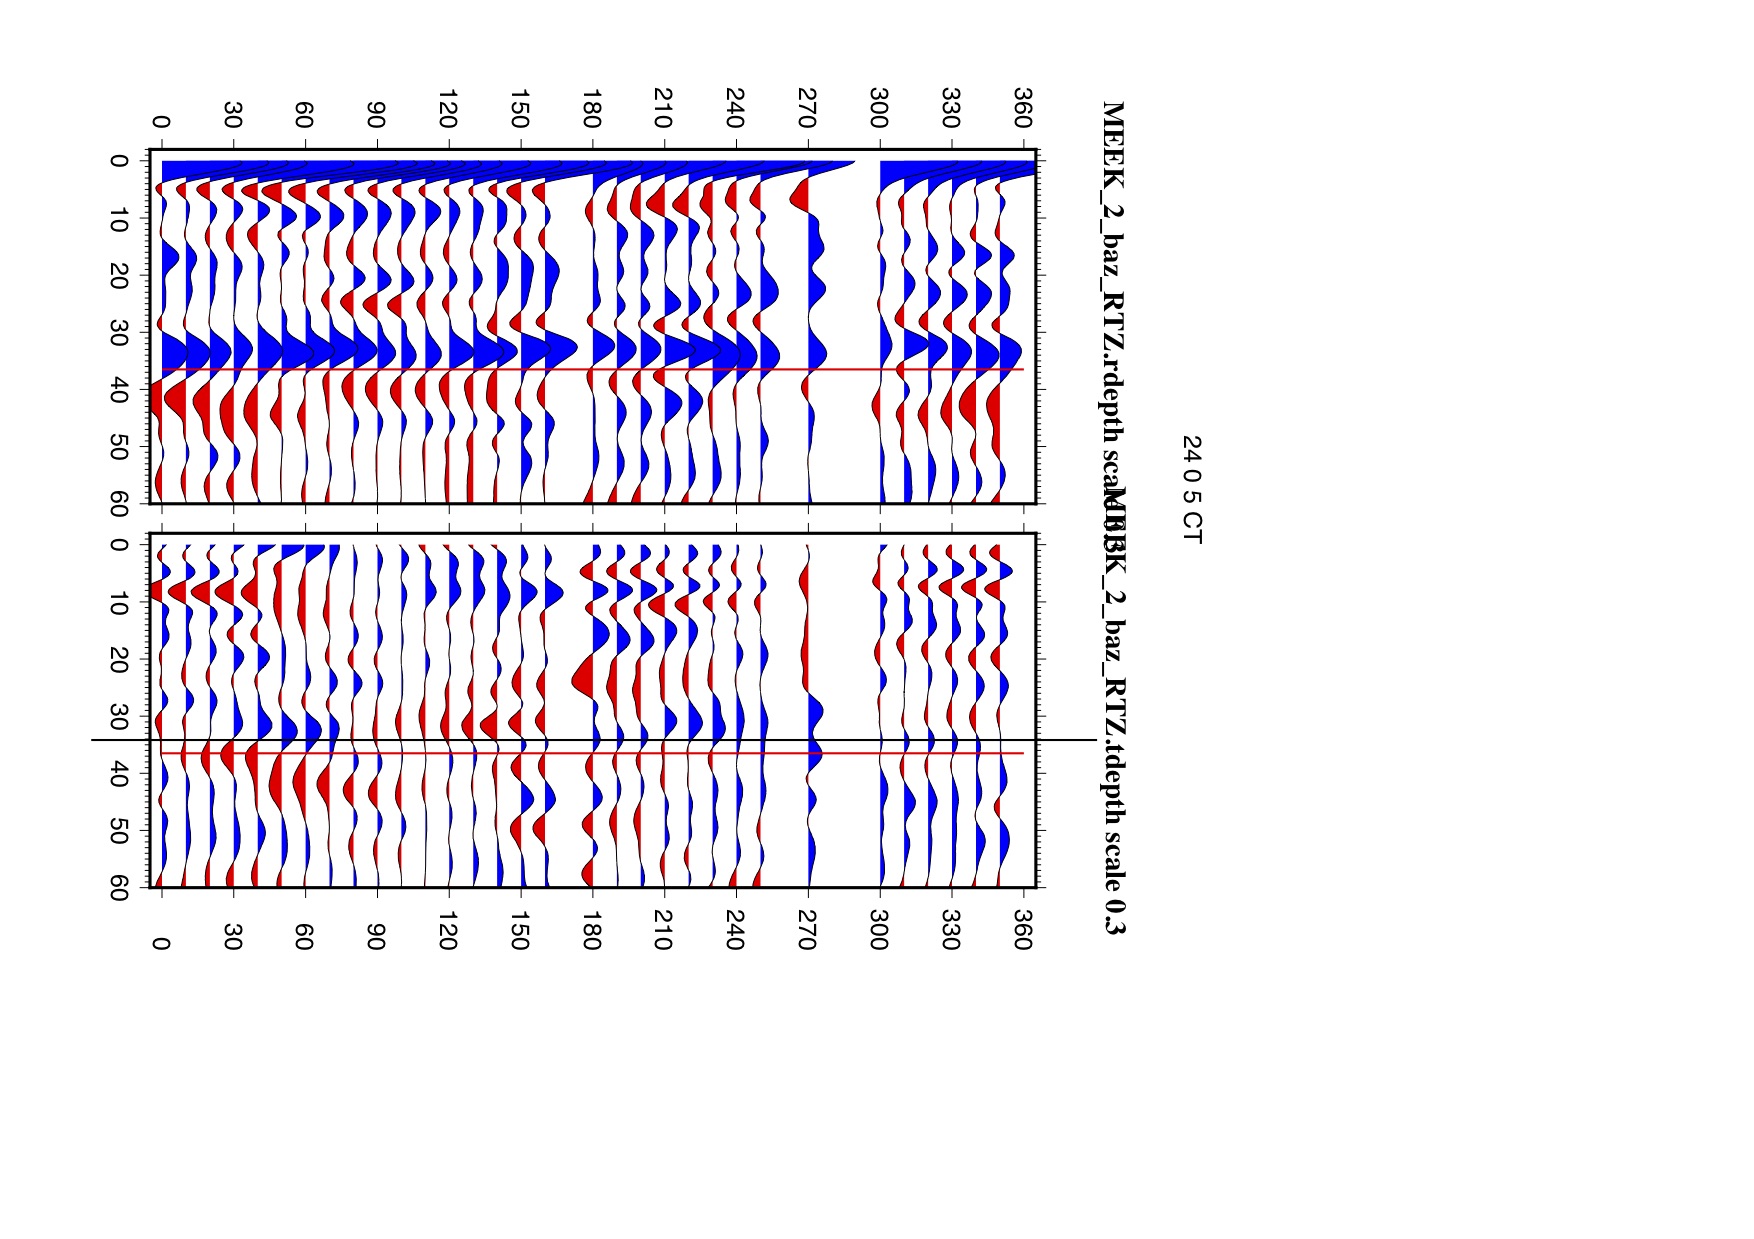
These past two weeks I got to actually start looking at my data. For each of the stations I started making receiver functions for varying frequencies using backazimuths and epicentral distance. Blues and reds is all I see now. At first I looked at them and thought "what the heck does any of this mean?" But after walking through one or two with my professor and reading a few papers, I finally started to see some of the patterns in the RFs and have been able to start making some kind of interprettations of them. This all could not have happened at a better time because I can actually give some form of interpretation for my AGU abstract!
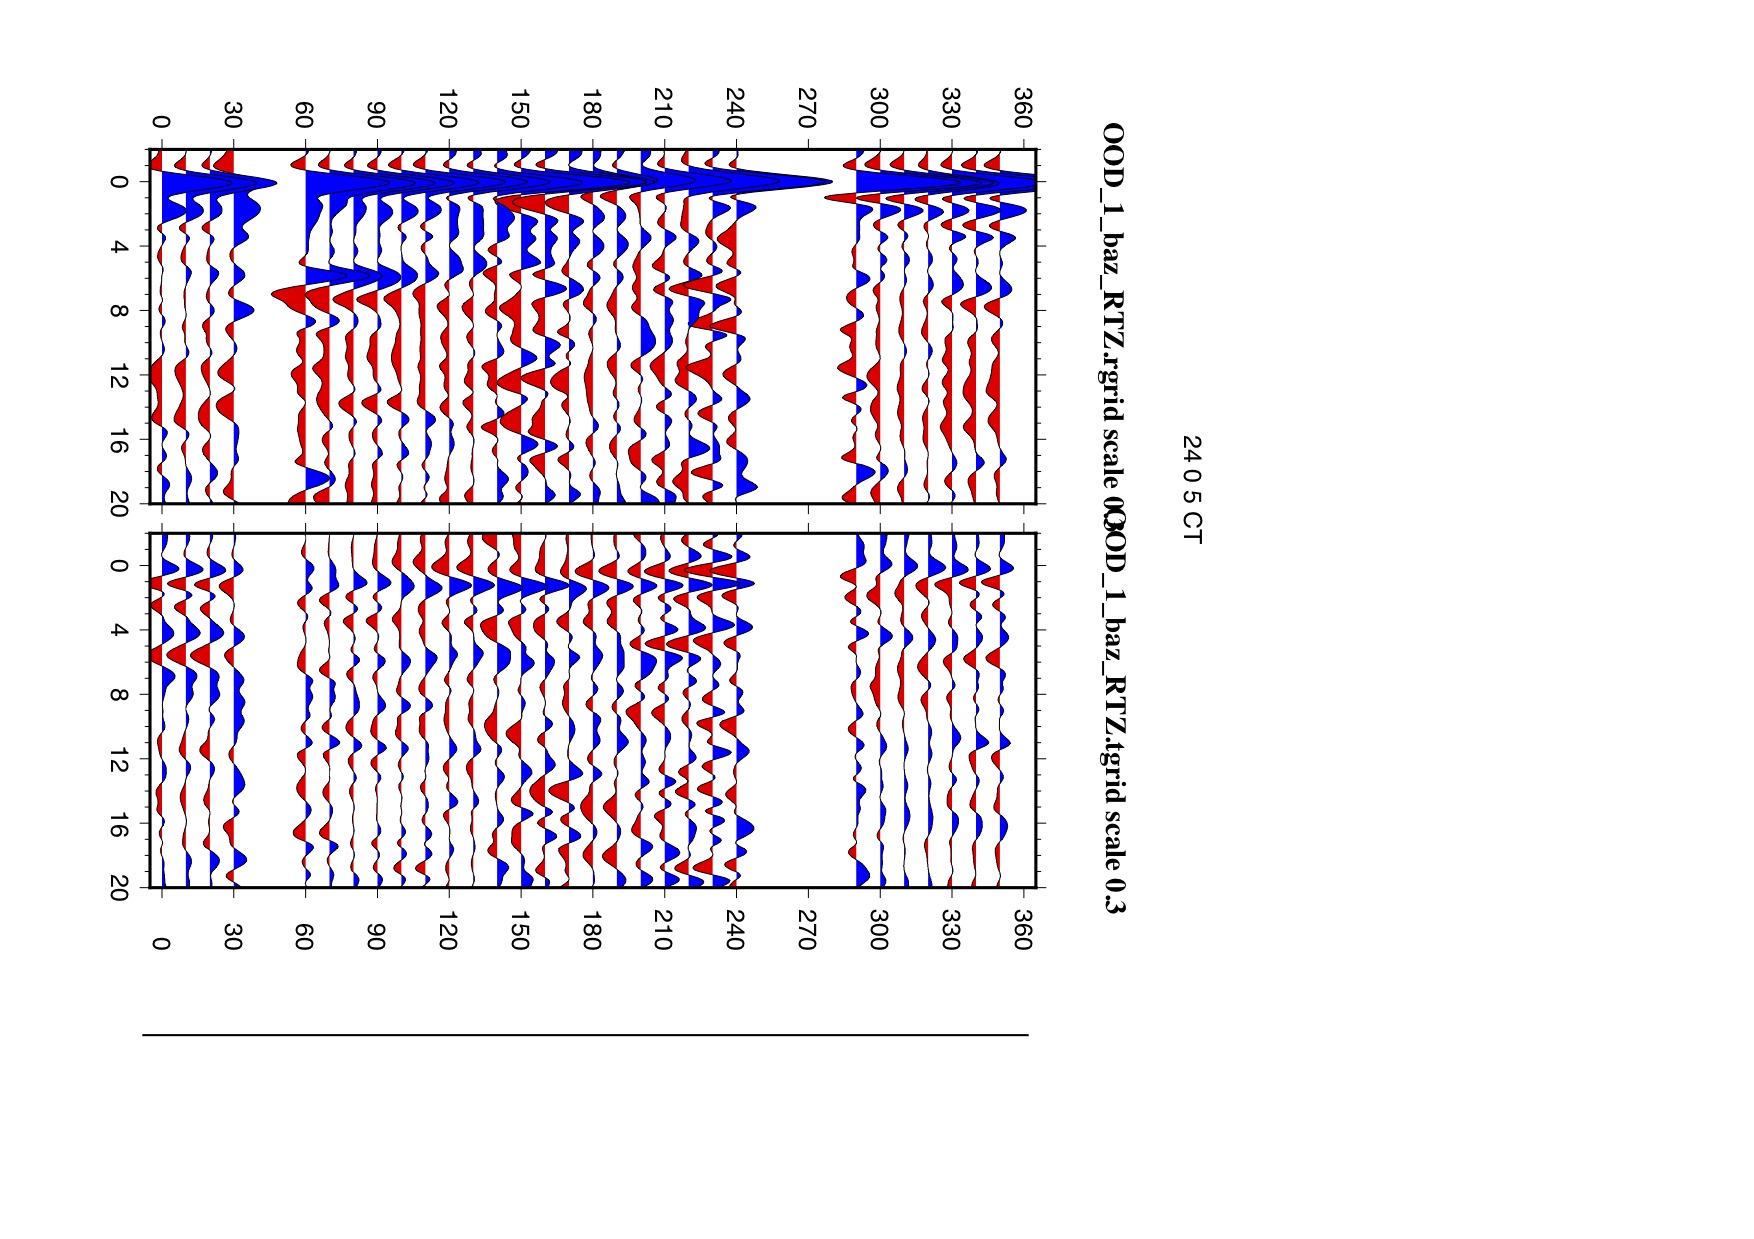
 Attached is one of the receiver functions from station OOD in South central Australia. Here you can see the Moho around 5 or 6 seconds, shown as a positive Ps phase. It becomes more difficult to see the larger the backazimuthal angle gets most likely due to a possible crustal structure. In the transverse component is where you can more clearly observe either dipping structures or layers of anisotropy from polarity reversals. This station has two really clear dipping structures. This receiver function is imaged at a frequency of 1, however, I still plan on making them for lower frequencies in order to better enhance some features and clean up some of the noise. It has been really awesome seeing some possible similarities in structures beneath the various stations and I am really excited to look at them even more. My life has really just become a bunch of red and blue!
A paper that I have now read a couple times that is incredibly important to my work is by my mentor, Heather Ford. The paper is "The lithosphere–asthenosphere boundary and cratonic lithospheric layering beneath Australia from Sp wave imaging" written in 2010. Here she did similar work with less robust event catalogs and stations and used Sp receiver functions. I can already see a lot of her interpretations in her paper in my work. For instance, she interprets these larger areas of negative phase arrivals as a gradient of the LAB underneath the old and thick craton areas of Australia. The LAB beneath these cratons is rather ambigious in comparison to a lot of other areas where it is more defined. This same interpretation can be made from my results as well. Along with this, Mid-Lithospheric Discontinuities are noticed in the cratonic lithosphere in similar depths to the LAB in surrounding areas. The cause of these MLDs are still unknown but it is thought that layers of hydrous
minerals (predominantly from amphiboles) could be the cause of them along with the velocity decrease at LAB depths (Selway et al. 2015). Through RF analysis and comparisons to surface wave tomographic studies, the LAB beneath cratons and MLD show a complexity in cratonic lithosphere. This is all incredibly relevant to my work because I am essentially attempting to better visualize and support these claims made in this paper, along with determine anymore structuring not determined prior.
Week 3 - Pre-Processing Done :)
July 15th, 2018
This week I finally finished the work processing the seismograms to be used to in the reciever function code. Starting this coming week I will finally be able to start making interp
 retations and imaging of the Australian lithosphere for possible layers of anisotropy. Luckily I had finished the pre processing early so I will ACTUALLY be able to write about some results for my AGU abstract which is really exciting! Im hoping in the next post I will be able to say more about possible results in my work.
Working in Riverside has been an incredible experience not only in the research. This past week my mentor Heather Ford brought me out to the Eastern Sierras in order to help her lead a Geophysics exercise with the UCR Summer Field students. I had never been out in this area of California. The landscape was truly epic. Waking up to the huge Eastern Sierras to the West, Owen's Valley to the South, and the Inyo National Forest to the North was magical. It was also such a great experience for me to get a better look at what its like to lead other students. In the field we attempted two different experiments: one was a magnets experiment using a magnetometer and the other was a seismic refraction experiment. Most of the students had never done any work with Geophysics so it was a really awesome experience helping out with that.
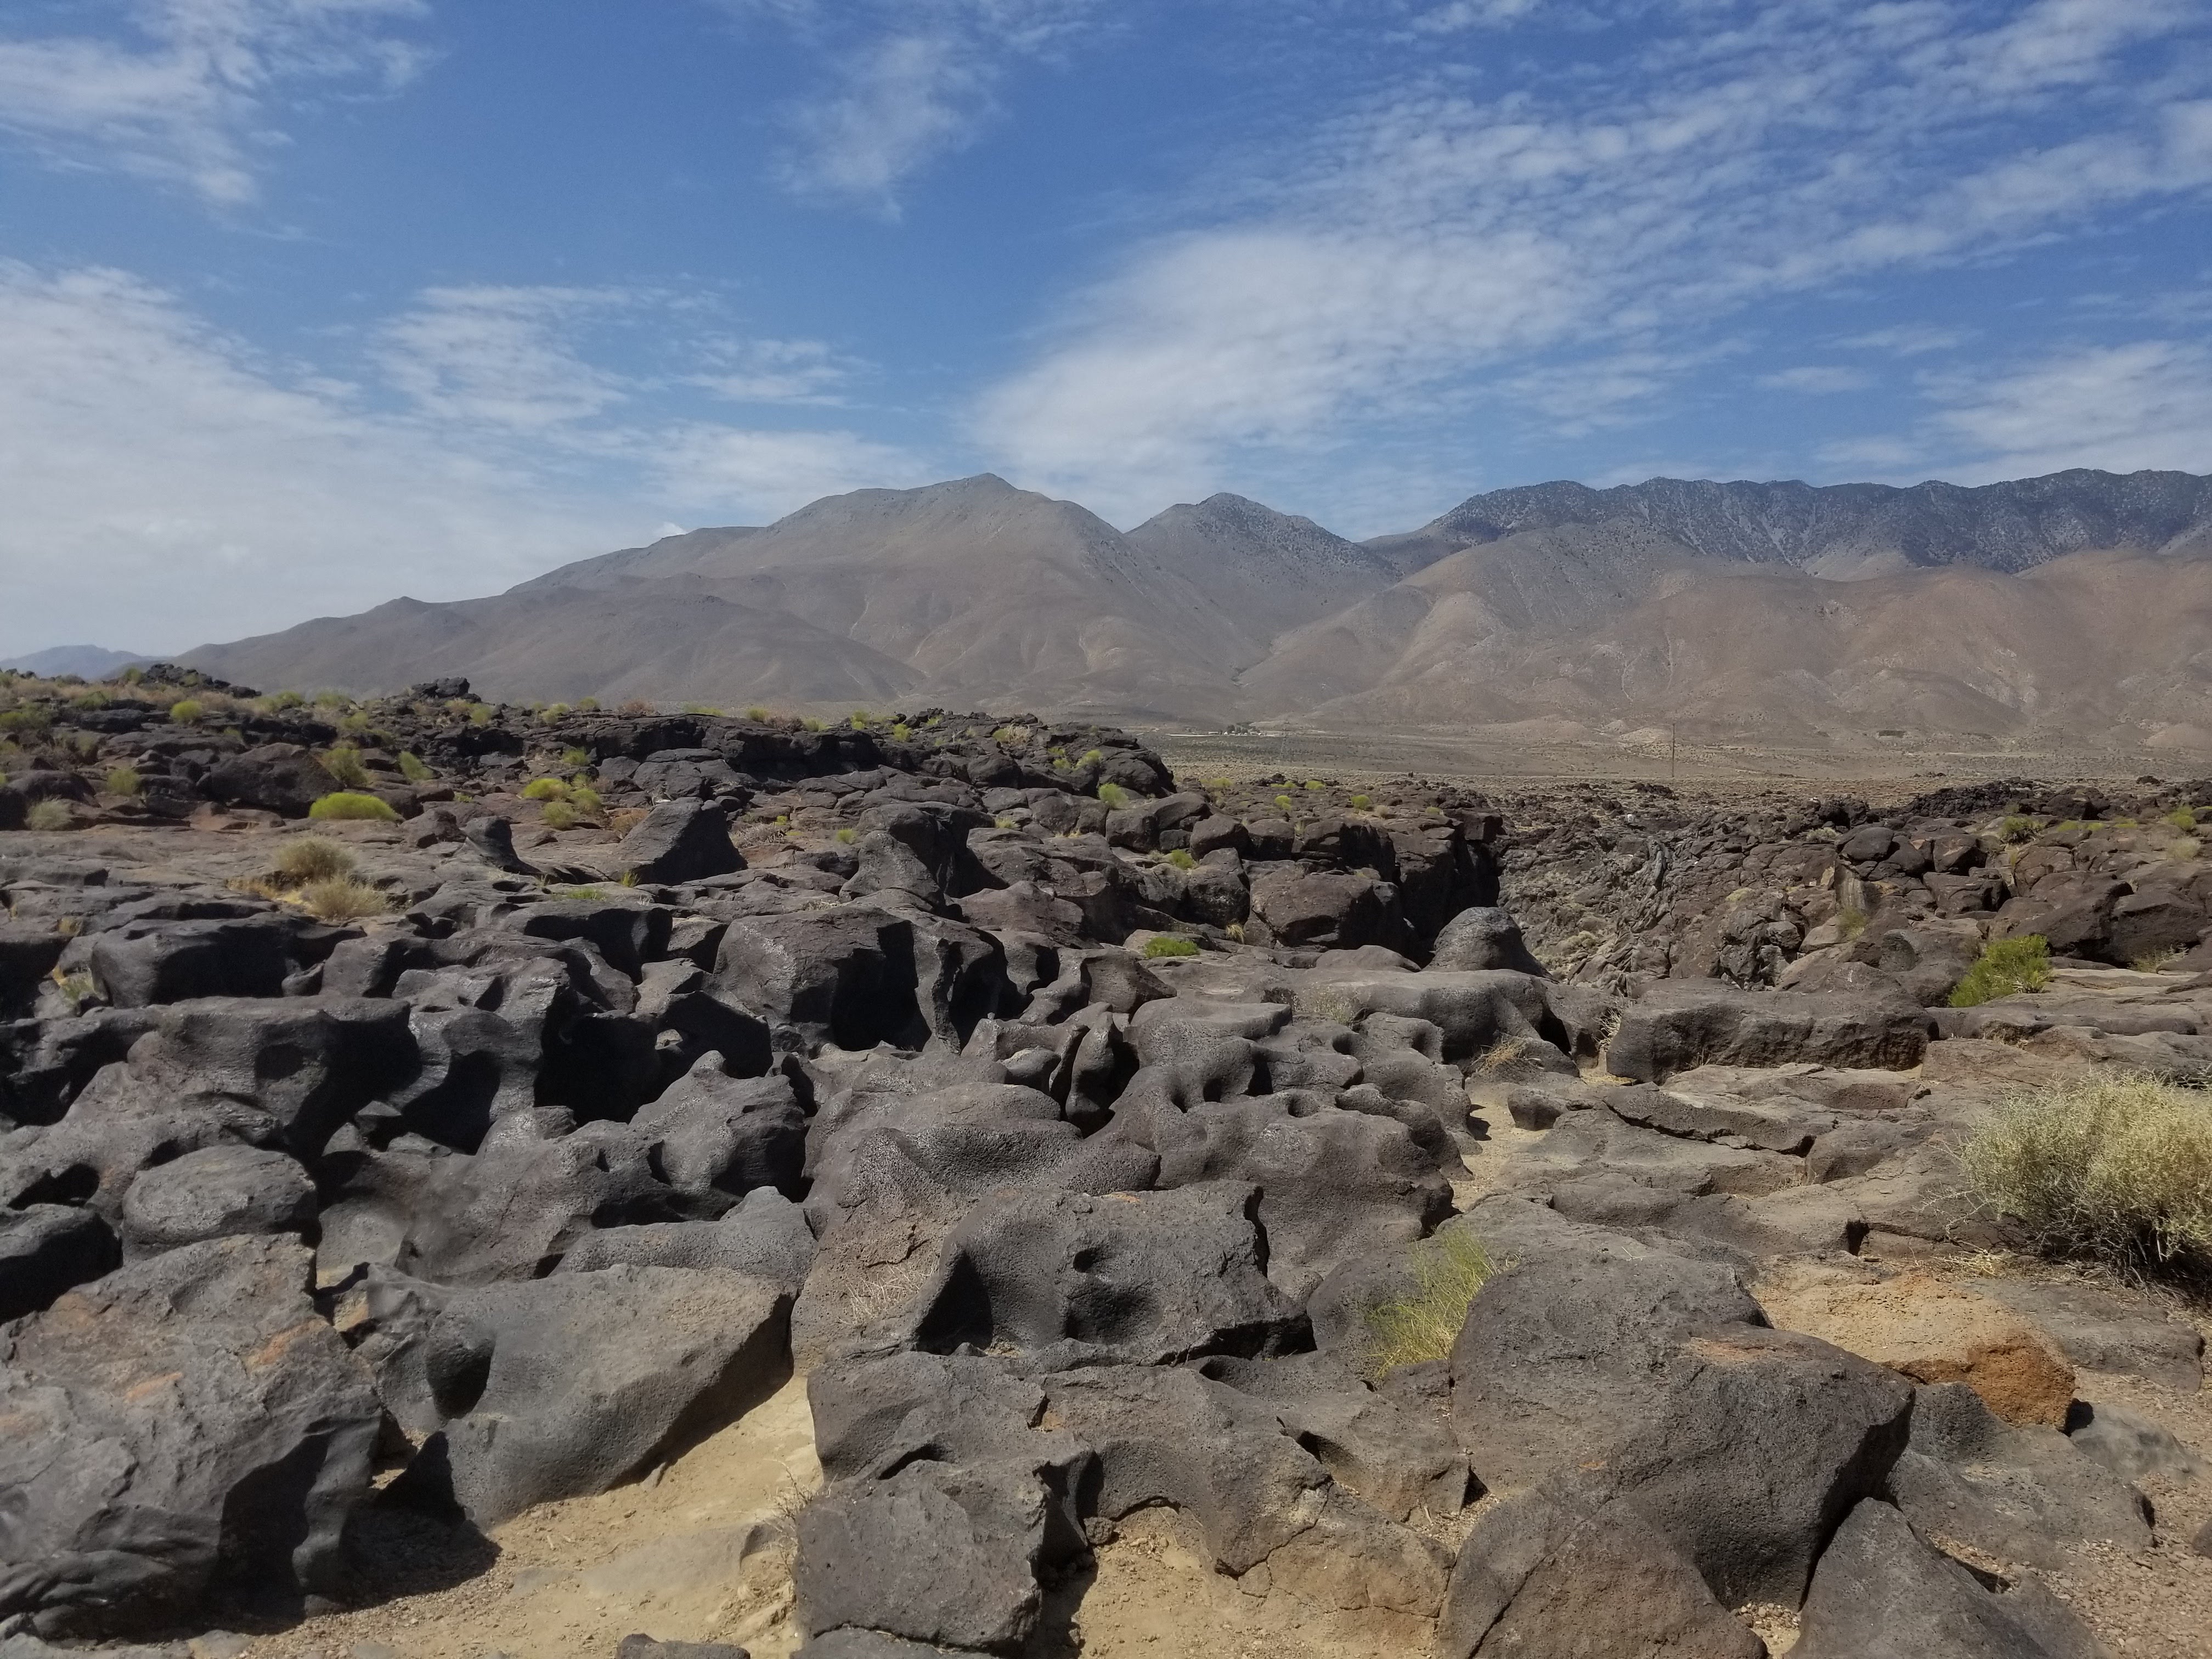
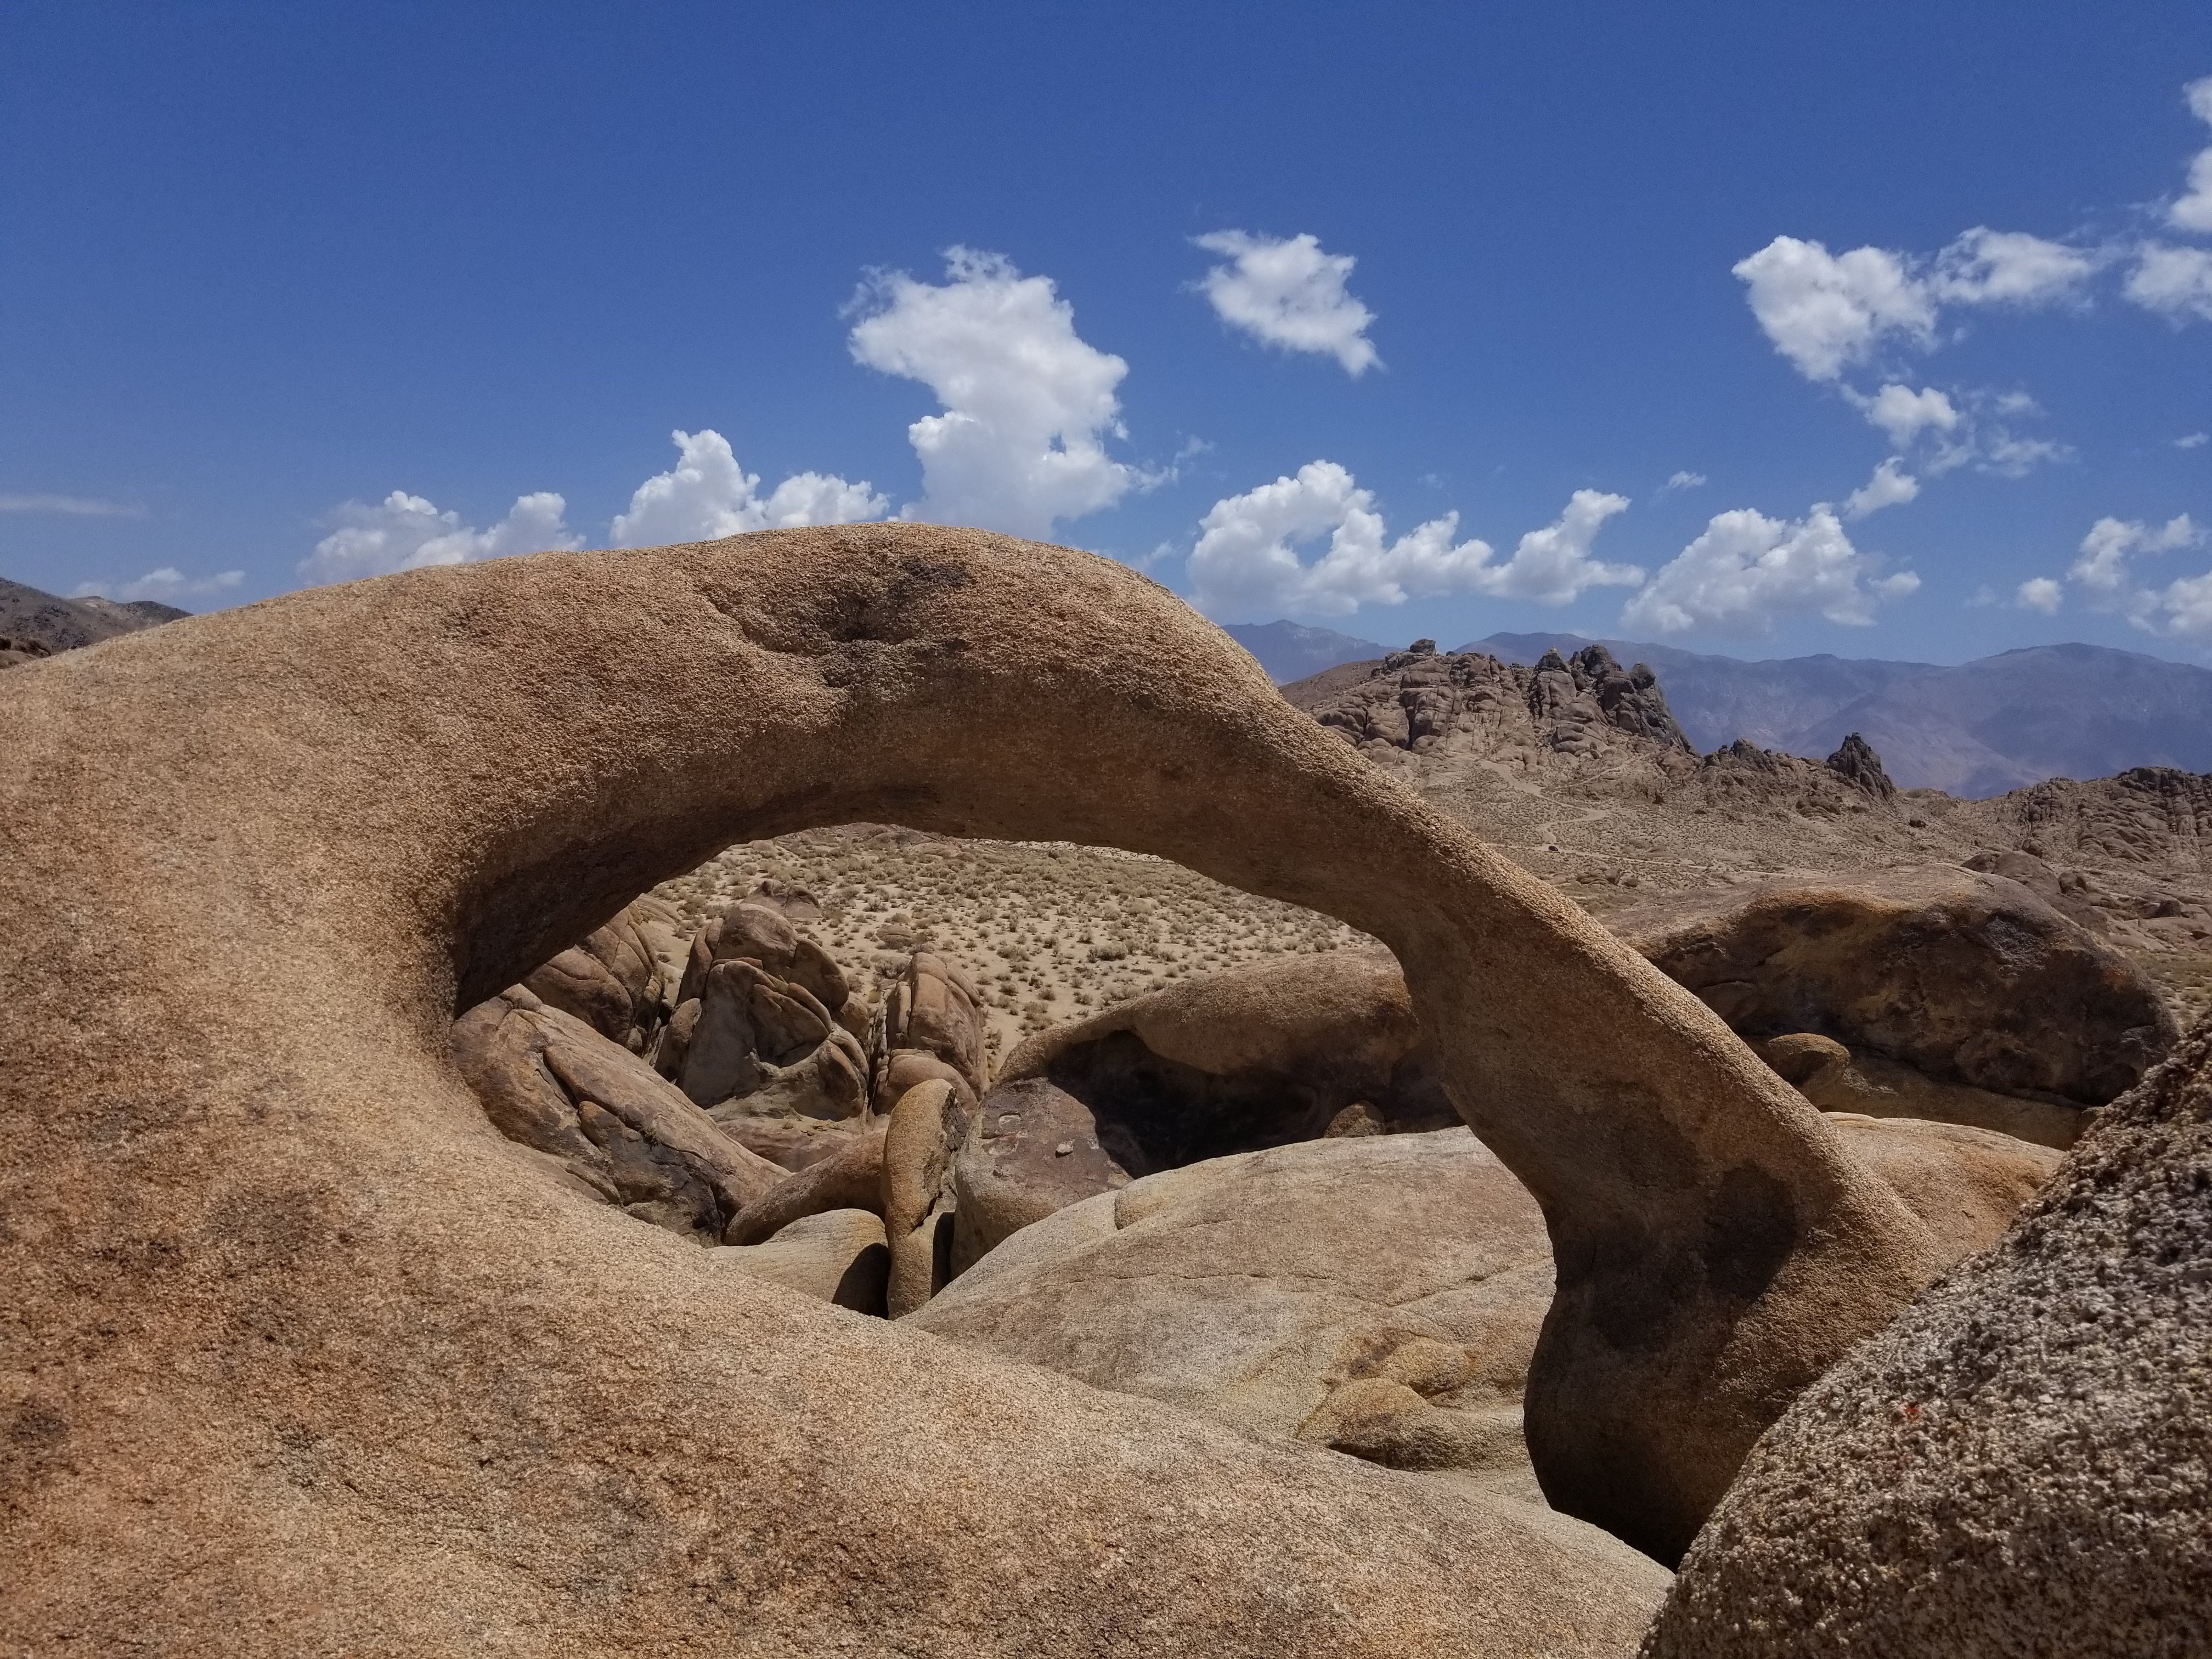
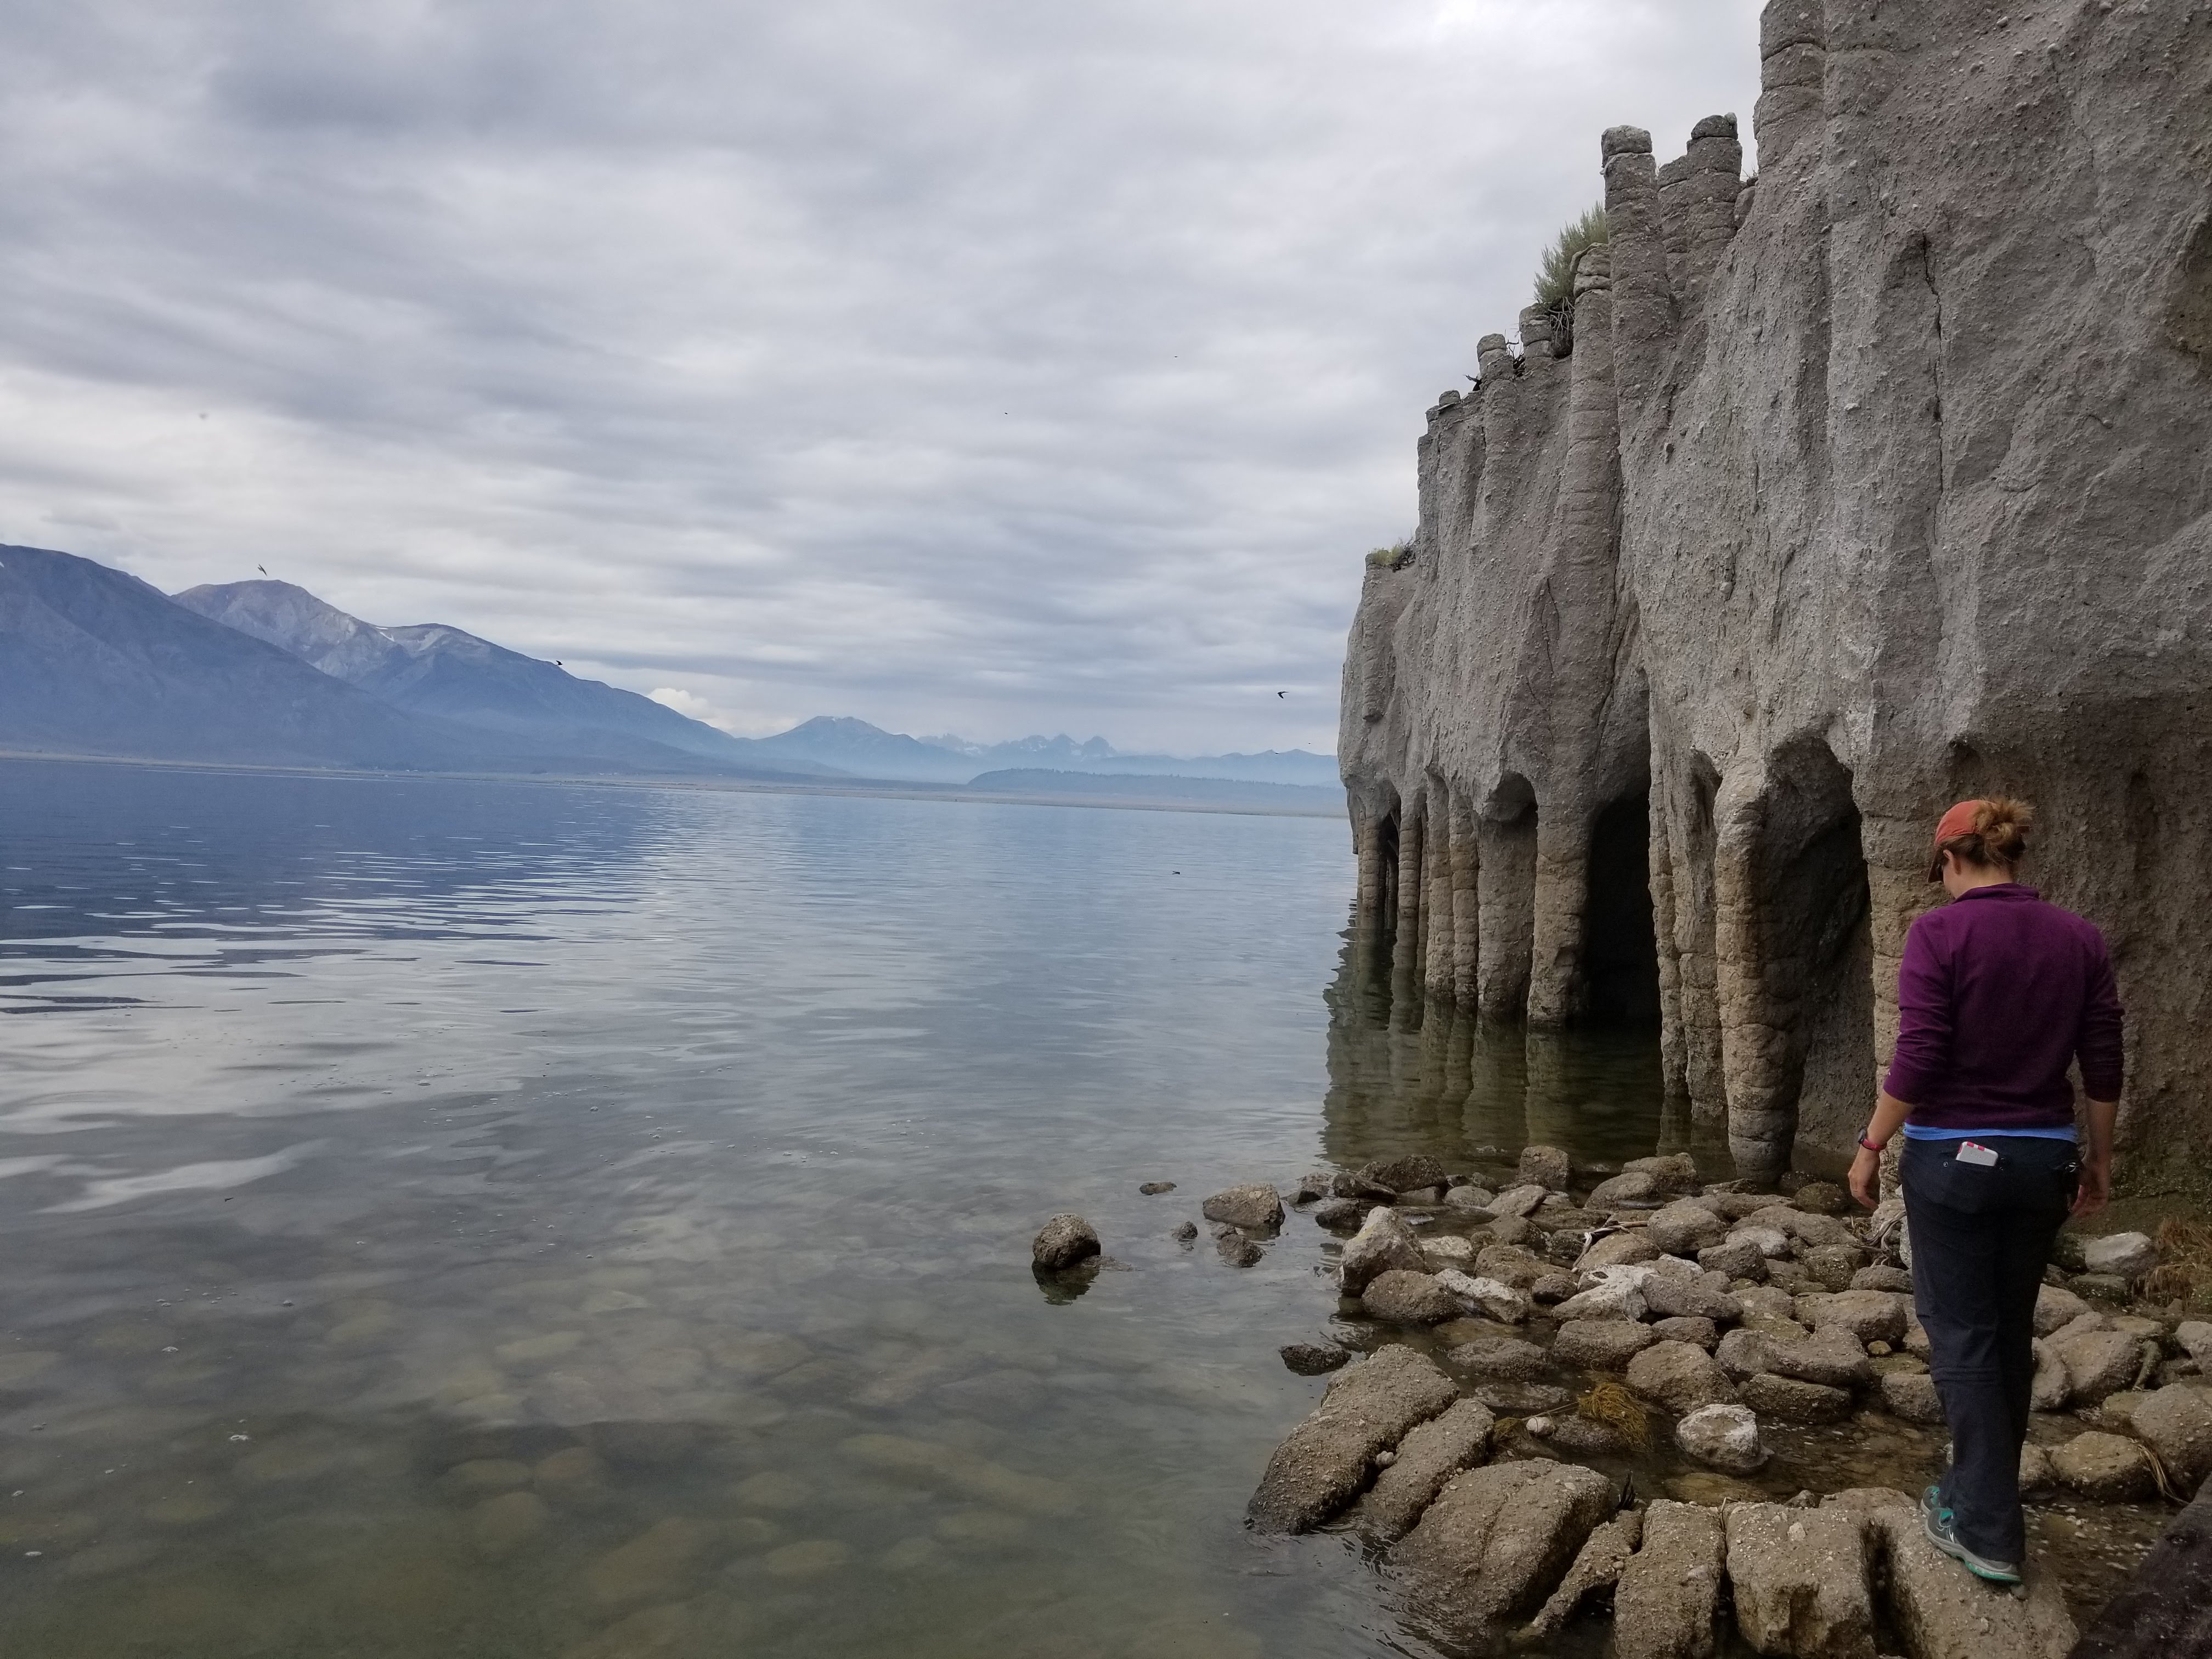
It was not all work though! We got to do a bit of sight seeing too. Along the way we stopped at Fossil Falls, Alabama Hills, and even saw the columns at Crowley Falls! As much as I love being in the office, its great to get out every once in a while and rest the eyes from the computer screen.
After writing my elevator speech, it soon became apparent that explaining the complexities of my work in such a way that most people could understand is much more difficult than I previous thought. It also requires a knowledge of your own project that is much deeper than just regurgitating your project summary! Because of the simplicity that the elevator speech must be, it requires a lot more back tracking in order to explain what you are actually doing. What is anisotropy? What is a receiver function? What is a craton? There are so many little aspects that must be explained in order for someone else to understand what it is you are doing. However, this speech is very useful for so many situations: talking to family (of all ages even!), other students, possible jobs, etc.
Week 2 - P Wave Picking Palooza
July 1st, 2018
This last week was my first full week at Riverside. I truly started to dwelve into my project and made some solid advance in my project. The initial steps of my project have been too download waveforms of 5.7 Mw or greater events recorded by 6 Australian permanant broadband seismometers. These events recorded from the seismometers are from all around the world. It it really interesting noticing in the data some of the historic large earthquakes like the 2004 Sumatra and the 2011 Tohoku earthquakes and the many aftershocks from each event. These large events shook the entire world, actually! I encountered a few issues with the data from the different seismometers including the data was not in the right format and the datasets were not always recorded using the same rate. It's funny how often little differences can really delay progress. One station in perticular I had to request and process the data three different times in order for it to finally work!
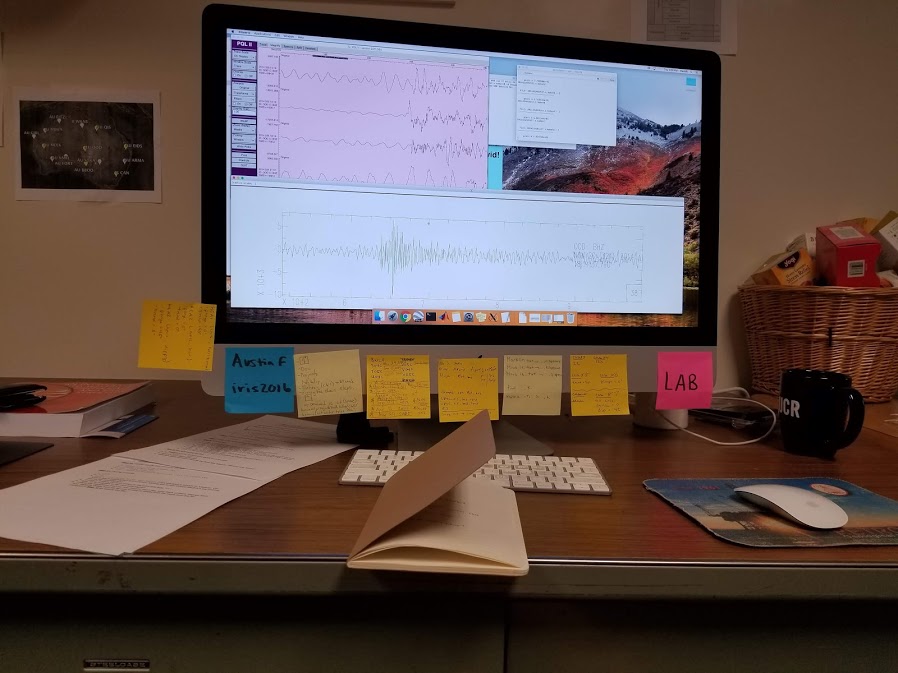
From here I have been sorting through the waveforms and compiling a list of the ones that are good enough to use for the reciever function code. Then, from the list I have begun to pick the p wave arrivals for each event using what seems like the most inefficient programs I have ever encountered. But good news is it is a great bonding exercise for me and the grad students I am working with! Im hoping by the end of next week to be done with these tasks and really get into the meat of the project!
On another note, I have been enjoying my time down in Southern California (once again except for the sun). Ive joined the local rock climbing gym and really enjoy the community there. It is also nice being near so many great areas so I spent this last weekend in Long Beach roller blading on the beach and lounging by the water 😊
**Below is a pic of my work station and the two programs I use to both determine the quality of the waveforms and then to pick the p arrivals**
Week 1 - The Week That Started It All
June 24th, 2018
My first "week" at my project has been new and exciting. It has been such a hectic week with finishing up school the week before (UC Santa Cruz is on the quarter system and therefore runs late), moving out of my apartment and packing everything I own into either my car or a storage unit, moving down to Riverside to begin my project, and finally starting work with the amazing mentor that is Heather Ford at UC Riverside. I am beyond estactic that my travels are over and that I will finally be able to get cracking on my project. Going into Riverside I mentally prepared myself for the heat I would be forced to endure; I was not prepared, however. Coming from Santa Cruz, California, I have not dealt with heat past the mid 80s for a while. Riverside, however, is HOT. But that just means I must relax by the pool much more often 😊.
Onto the research portion... It has been great starting my project. The initial steps will be both ardeous and monotonous, however, they must be done in order to get into the meat of the project. I plan on spending the next couple weeks going through over 10 years of waveforms for 6 stations in Australia and determining p-wave arrivals for the prerecorded large (mag 5.8 and above) earthquakes around the world. These initial steps are long but are also very relaxing and satisfying. I will hopefully be able to get through a good audiobook or two during this time!
Although I have only been here a few days, I know it will be a great experience. In order to guide me on getting the most out of my time here I have a few goals. The biggest goal is to complete and be proud of the work that I will do for this internship. I want to be able to leave Riverside by the end of the Summer with knowledge, experience, and contribution into the realm of Geophysics. Whether or not my research project creates mind-boggling new scientific discoveries or not, I want to leave here with a clearer sense of how research is acheived, how to take part in the scientific method, how to work with others, how to ask questions and when to ask them, and how to be confused, lost, or completely stuck and what to do to get out of it.
Narrator : "What will come of the boy? Will he survive the heat? What will come of his work in the coming weeks? Stay tuned for this story might just get interesting..."


