Trey
Trey is a student at Universtiy of Minnesota currently completing his research at Universtiy of Rochester under Dr. Tolulope Olugboji.
I’m going to be examining the mid-Lithosphere discontinuity (MLD) in the south-eastern US by using a new receiver function stacking technique. This will provide estimates of the depth of the MLD, how sharp the MLD is, and the Phi-Power. In combination with magnetotelluric data and mineral physics, this will help determine the mechanism by which, at least in the south-eastern US, the MLD is produced by and hopefully narrow the proposed mechanisms.
Week 9 - The end that is also the beginning
July 31st, 2019
This summer probably has been my most memorable summer ever, and also probably my most productive summer as well! Productive in terms of what I’ve accomplished and personal growth. Back at the start of this internship, I made a list of goals that I would try and passively accomplish while doing my research here. Overall, I accomplished almost all of them (I did slack a little bit on the GRE prep class a bit near the end…)! In terms of the goals, I am most proud of presenting my research at the Kearn’s Center. A whole bunch of other people were there and it was definitely the largest audience that has subjected to my somewhat coherent ramblings! Joking aside, I think it really helped me with my public speaking ability, as now it doesn’t feel so insurmountable to give that sort of presentation. Also, while I wasn’t able to complete everything in my project, I got it to a decent stopping point.

Here is photo of me presenting!
My goals of the summer have evolved a little bit as the summer has progressed. Notably, near the end I started really wanting to explore the nature around Rochester. There are several very nice state parks that are within an hour and a half drive! Liam, Yingping, and I went to Stony Brook state park last weekend, where they had these big waterfalls that you were able to swim under!
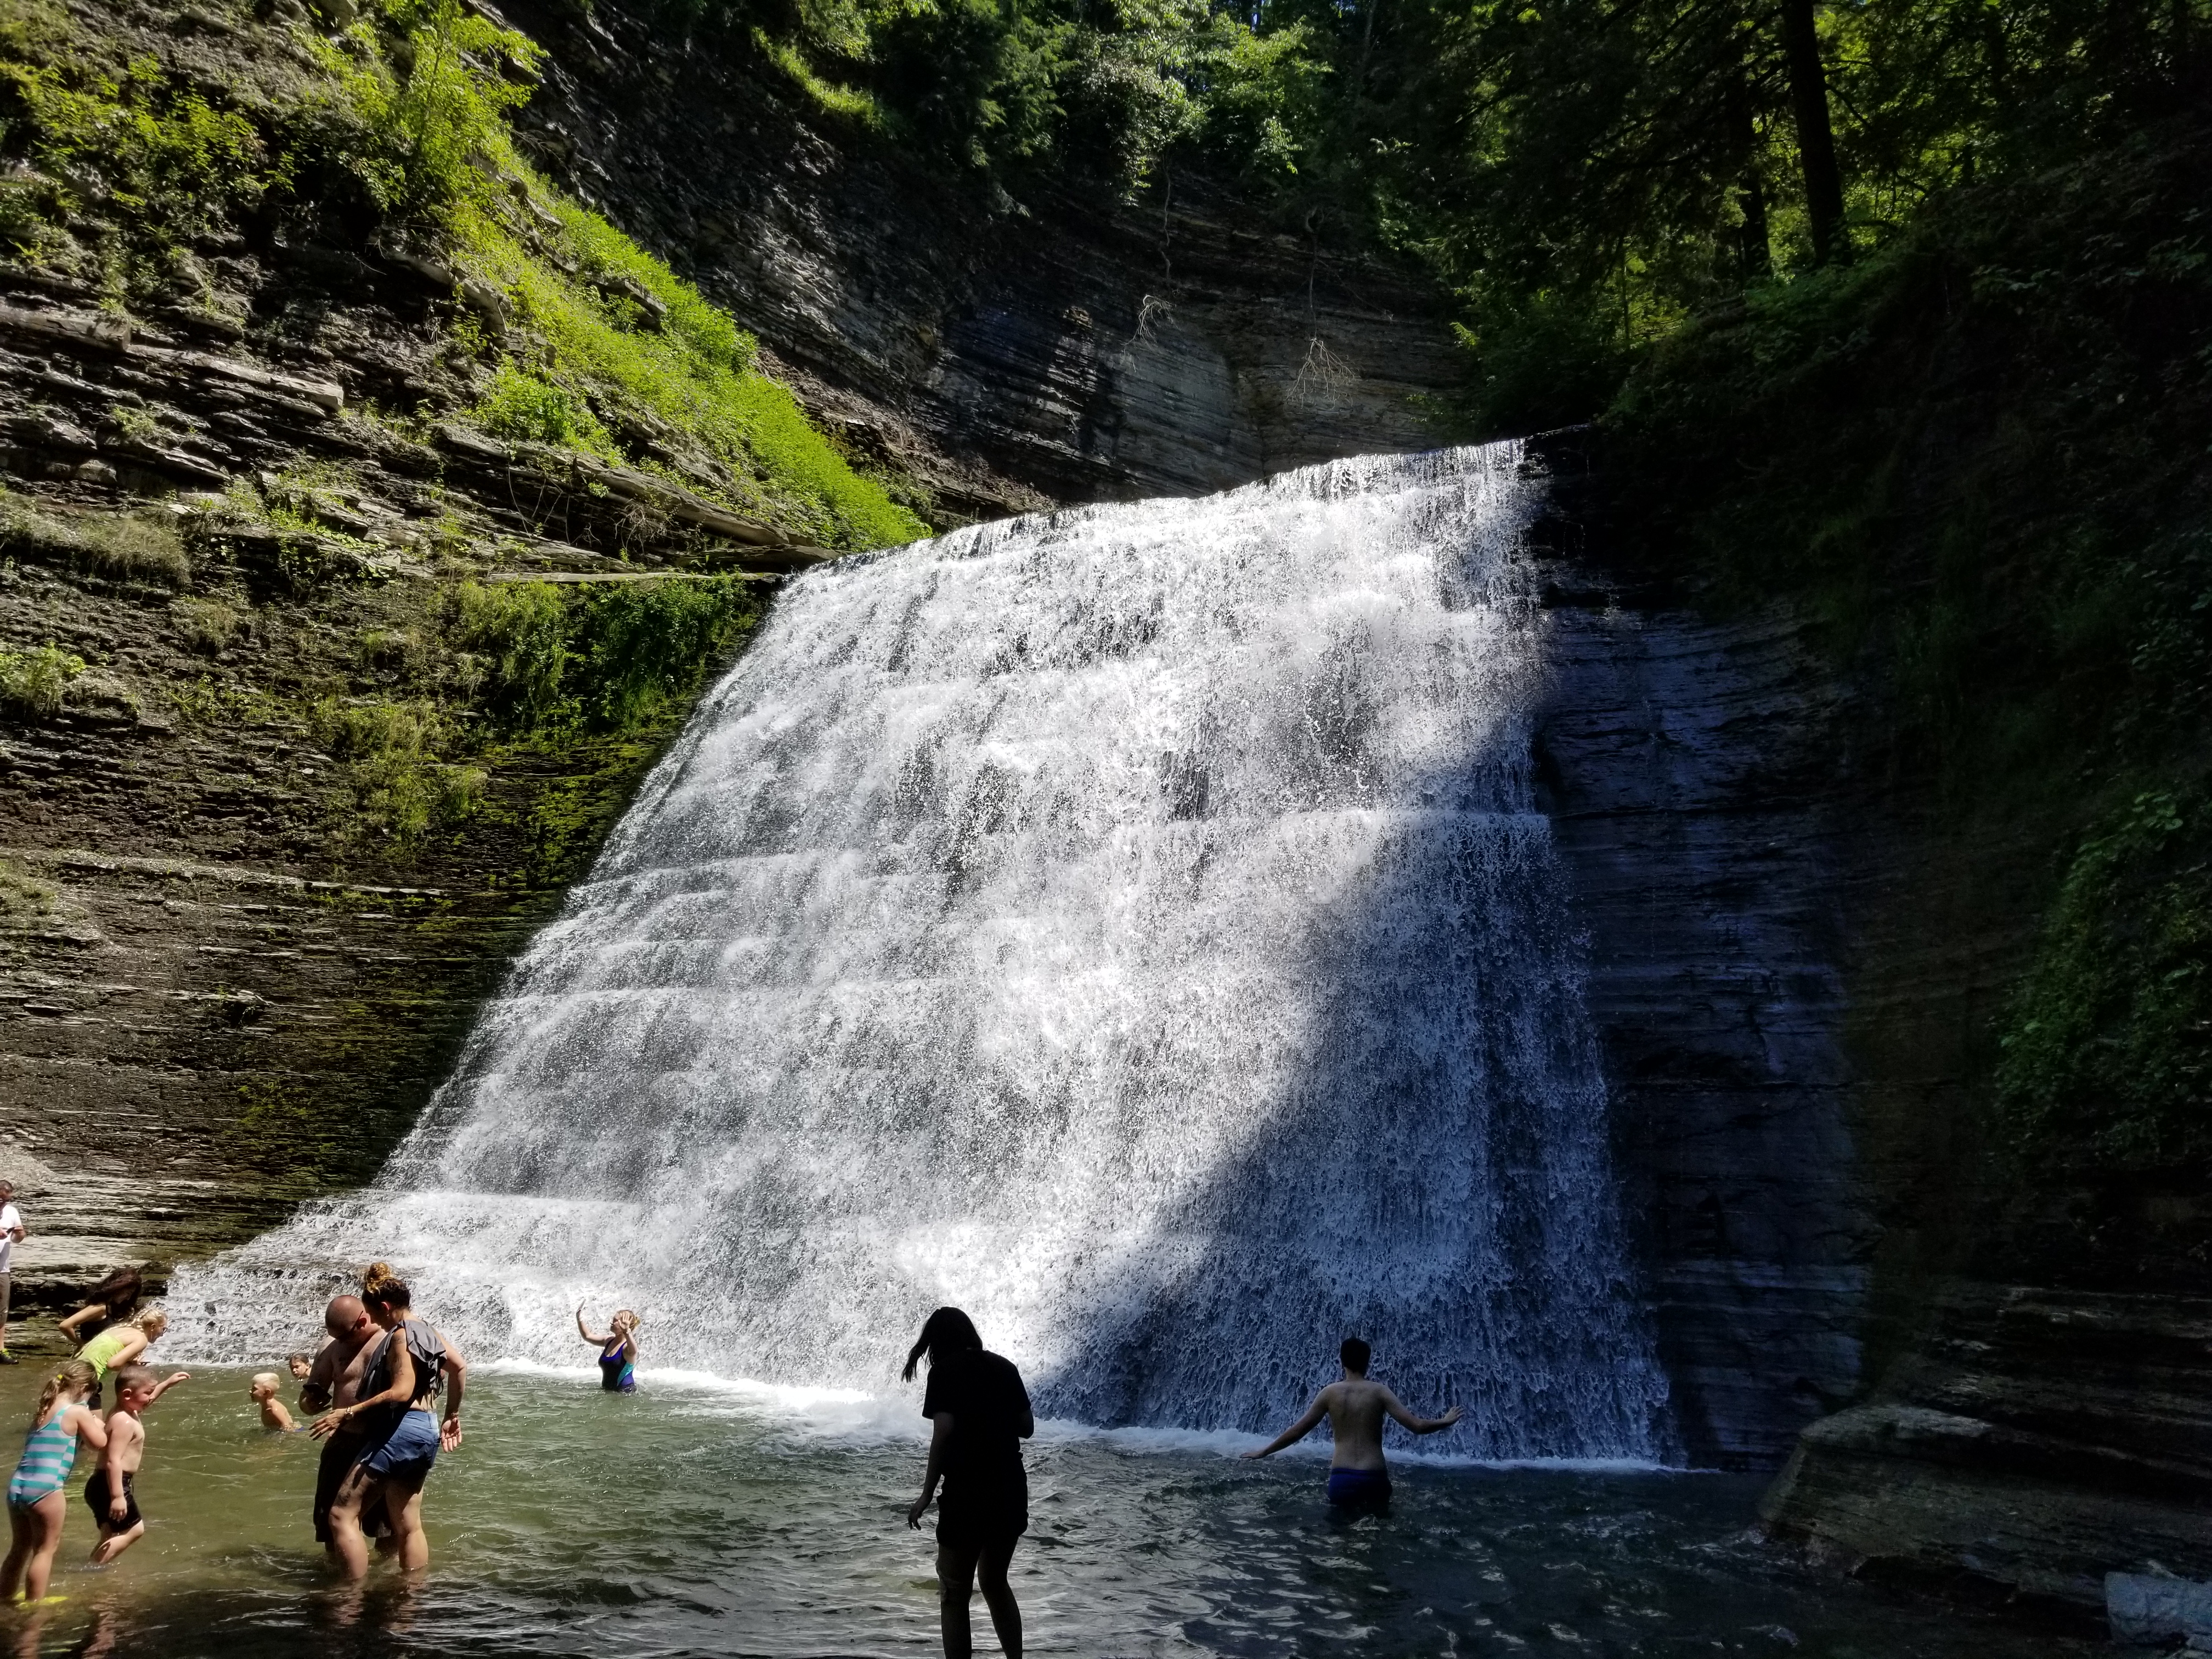
Here is a pictograph of some water falling at Stony Brook!
It’s very hard to believe this is my last week here. The summer went by speedy quick! I made some great friends here in my lab (and outside the lab too!) and I learned so much. I really am thankful for this opportunity made possible by IRIS. I feel ready for anything now!
And for maybe the last time…
Trey out!
Week 7 - Time Crunch!
July 21st, 2019
Out of all of the challenges I’ve faced this summer none has been greater than that broad, general feeling of not having enough time. When I started this internship, I wasn’t exactly sure what to expect in terms of workload. I’ve always read that in academics, it’s not uncommon to do 50+ hour weeks. The amount of time I’ve spent in lab has slowly increased from week 1, where I basically just did a 40 hour work week, to now, where I probably spend around 50 hours per week in lab, and maybe a few hours at my dorm reading papers and such (albeit when I come in on the weekends, I’m less efficient). Right now it’s a time crunch! I have to finish up the last part of my project. We have almost gotten Moho depths, p-wave velocities, and Vp/Vs ratios at the stations within my region. However, we need to crank our procedure now to deeper depths, to the mid-Lithosphere discontinuity. And adding to that, I have to finish a presentation for an on-campus summer research group and finish my AGU abstract all within these last 12 days… oof. I know I will get through this just fine, and an attitude that has really helped me so far is to just take it one day at a time. That really helps me from feeling overwhelmed and tends to make me work more efficiently. It lets me focus on things that are important right now, as opposed to things that aren’t currently a good use of my very limited time.
In terms of more technical challenges, with our stacking code (what we use to figure out depth to Moho, Vp, and Vp/Vs) for most of our stations, we don’t have enough events to get a very good receiver function, so the values at those stations are pretty funky. We spent awhile sort of constraining the search window of our stack, which bounds these values within a reasonable window based on rock/mineral experiments. The main challenge of this was dealing with what to do with this majority of stations that were giving poor results. It was very demotivating, but I just kept on working on it despite that, and with some advice and help from Tolu, he helped rekindle our confidence (oh, when I say we or our, I mean Liam and I!). Basically, there were a lot of roller coaster days, where we would get something to work, realize it works poorly, fix it, realize it works poorly again, and so on and so forth! Realizing this pattern really lets you take a step back and stop worrying about something so much in the moment.

Also, here is a picture of Liam and Yingping playing Joust at the Strong Museum of Play!
-Trey out!
Week 5 - The trio tries traveling to Toronto and also receiver functions
July 8th, 2019
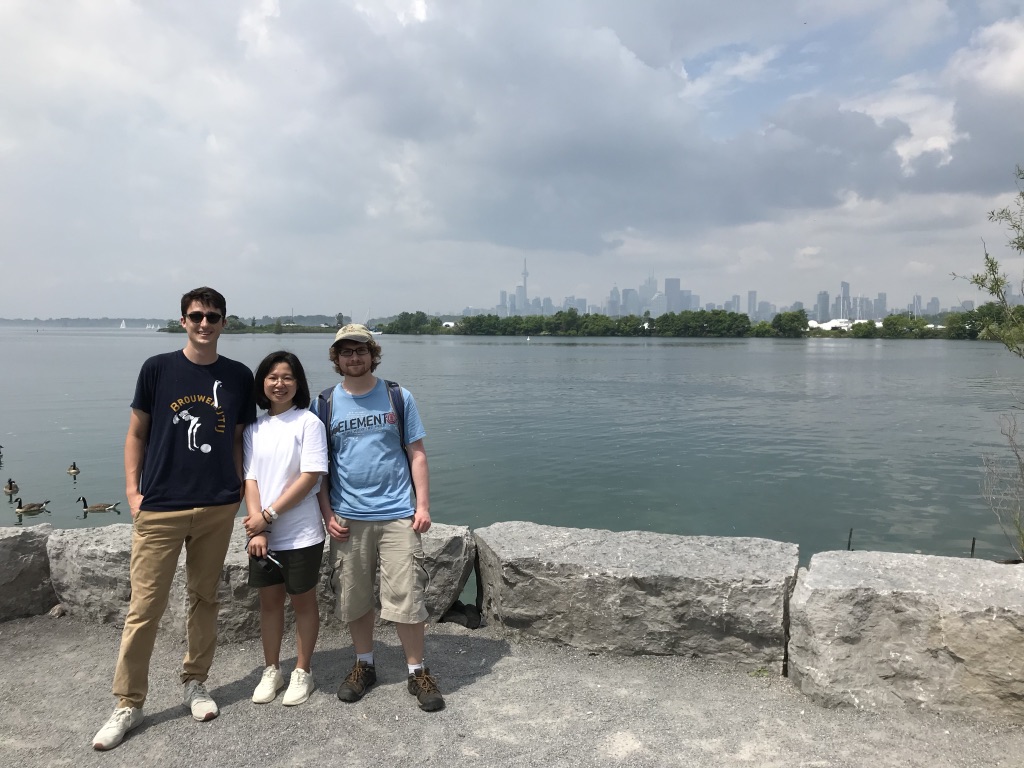
This week marks the halfway point of my summer research, and in celebration (and convenient timing) Liam, I, and a grad student in our lab all went and had a blast in Toronto over this last weekend. Notably, we stayed in Greektown and ate tons of Greek food, we went to the Art Gallery of Ontario (Free for those under 25 woo), and just ate lots of good food at various restaurants throughout Chinatown and Koreatown. Another highlight was bird kingdom at Niagara Falls, which was awesome. I got to feed some lorikeets as well as hold a macaw.

Here is a picture of us at a park!
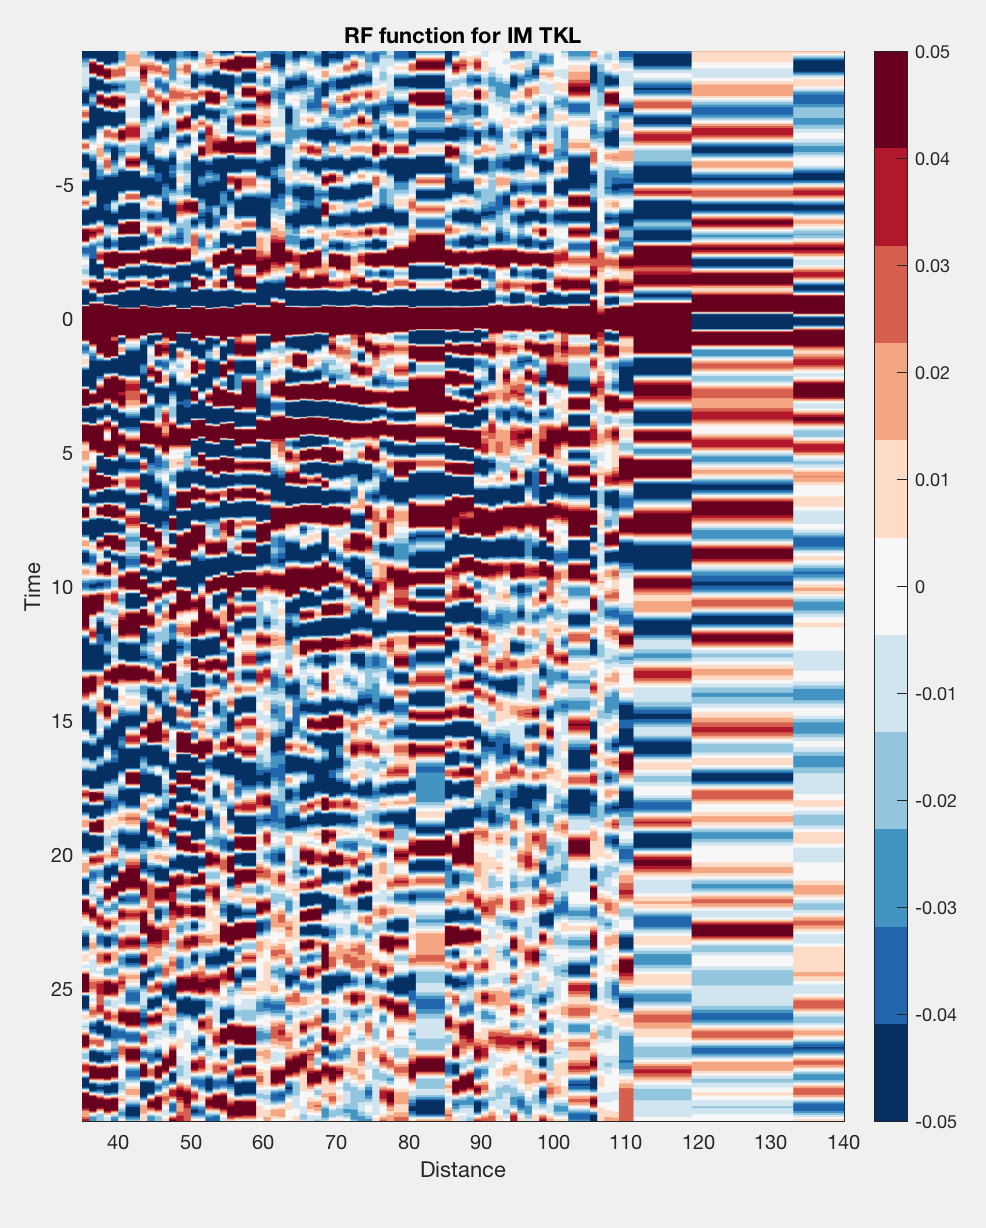
We have finally gotten a receiver function from our code, albeit with a lot of help from Tolu. There are a few issues with the code we are still ironing out, as our receiver functions appear to have completely reversed polarity?? We’ve tried a few things and looked at a few parts of the code we thought were suspect, but still no luck! Anyway, the picture below this is a receiver function for one of my above average stations within the region I care about. Note that there is more than likely something subtly wrong or just plain wrong with it! The colors show positive or negative polarity. At about 4 seconds, there is a red band that is probably representative of the moho!
One paper that my research sort of piggybacks on is a Magnetotelluric study done in the South Eastern US. Once we have results, we will be comparing it to the data within this paper. This paper attempts to couple the seemingly contradictory seismic data and magnetotelluric data, as both show different depths to the lithosphere-asthenosphere boundary. However, this paper shows that when accounting for anelasticity (finite grain size), velocity as a function of temperature is slower, even reasonable grain sizes (1 mm to 1 cm). This allows them to infer cooler mantle temperatures with the seismic results, and thus make the two different results compatible. They then argue that the modern thermal lithosphere in the Southeastern US formed in association with the Central Atlantic Magmatic Province.
Right now though, we mainly care about their depths to the lithosphere-asthenosphere boundary though! Later on we will use this paper and a few others to start interpreting geology.
Trey out!
Week 4 - Mapping and the GOGAlocks zone
June 29th, 2019
Right now, one of my main challenges is working with the supercomputer they have here at the University or Rochester. It’s a little annoying to work with, because you must make sure it has all the directories of functions and programs you are using, and that you tell it where to read and write different files. You also have to be careful about the amount of cores you request for whatever job you want it to carry out because that can be a little finicky as well. Figuring out that entire system was definitely a little frustrating and took a few days of playing with it.
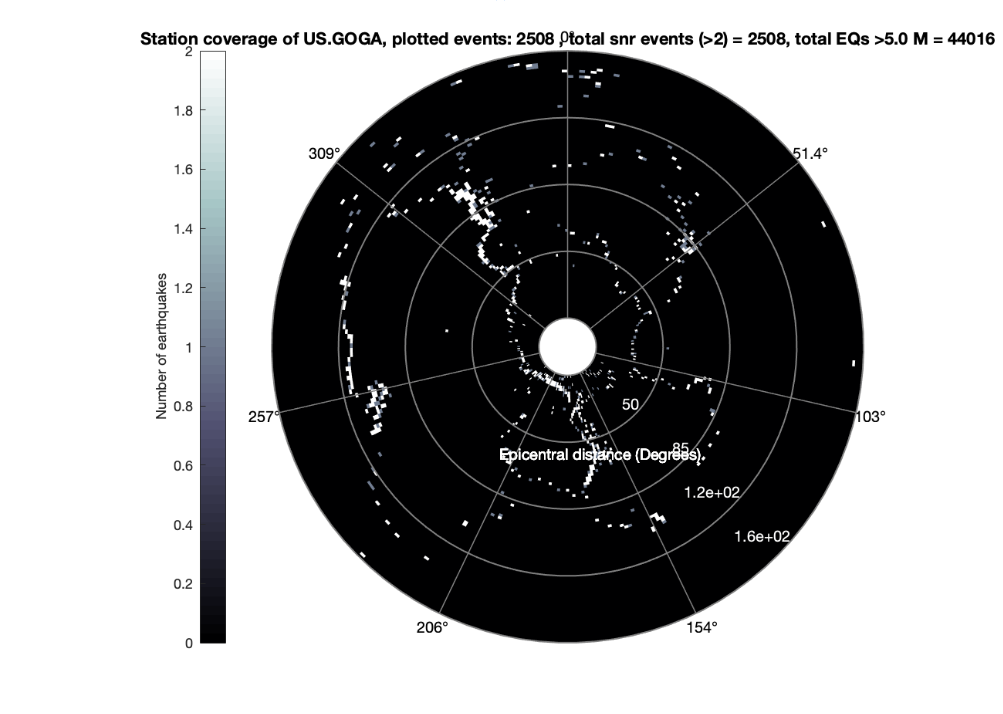
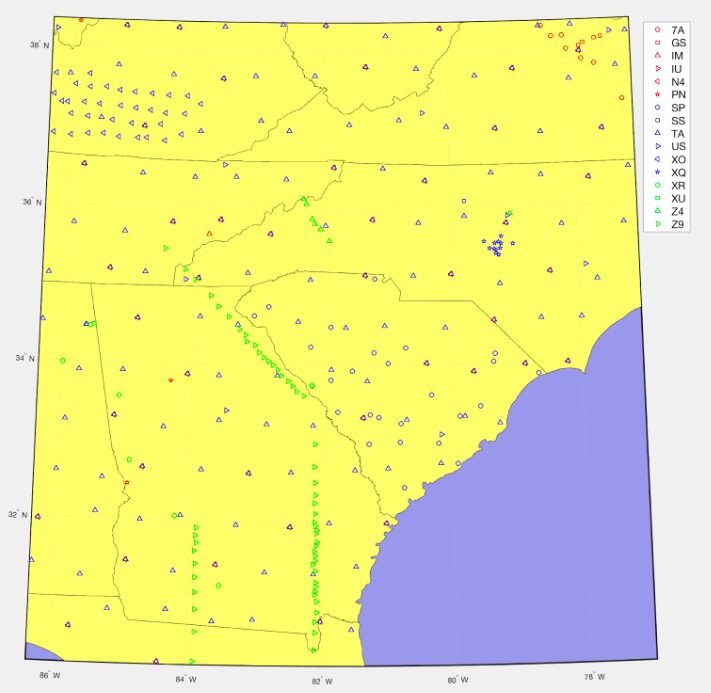
I already posted a picture of my field area using Matlab’s mapping toolbox, but I’ll just post another one! I also have a much more interesting polar plot of where earthquakes are coming from for the best station in my area of study (US GOGA, hence GOGAlocks zone, I'm sorry). You can see the outline of some plate boundaries on it, which is so cool! I am studying the Southeastern US because there is already a large swath of data (some seismic studies and a magnetotelluric study) I can check this new method I’m using with, and also a large portion of my area has higher P-wave velocities, which helps with the method we are using (a receiver function stacking technique).
Making this polar histogram was neat, I basically just looped through all the earthquakes I was able to match with a corresponding signal-to-noise ratio event picked up by the station and created bins for each bucket of back azimuth and epicentral distance. To match the earthquake with something the station picked up, I added in the travel time for a P-wave to get to whatever station I was checking (I used TauP) to recorded earthquake start time, and if they matched within a specified tolerance, we saved the earthquake data and station data. Oh, I also added a pretty cool feature where you could easily change the resolution of this plot, which may not sound very exciting, but it is a cool feature!
This is the polar histogram!
This is the map of the stations in my region.
Trey out!
Week 3 - An elegant elevator explanation
June 22nd, 2019
As part of this internship, we are given some assignments to do concurrently with our summer research. This week’s assignment was to draft and start practicing an elevator pitch of our research. Now, I spent about 15 minutes drafting an elevator pitch and spent a few tries saying it to myself. I think this assignment wasn’t too bad in terms of difficulty, because as part of the elevator pitch, you mainly explain the broader aspects of your research, rather than the gritty details. And in terms of actually saying it, I found that I was a little inconsistent in what I would be saying, because sometimes I ended up explaining things or emphasizing things a little differently. I could probably quell this if I practiced it more, but I feel like being fluid with your explanations, especially depending on the audience, is important to a good pitch.
This speech would be important for explaining to people what I do as a scientist, as there is often a gap between scientists and the everyone else. Much of science is funded by people who don’t know many of the specific details of what they are funding, so that is another area where bridging the gap and explaining the important aspects of your research without loads of jargon would be important. Thinking about this assignment, being able to explain things, and describe the main aspects of something while maintaining a simple explanation, is probably just a good skill to have in general, as it comes up in a lot of different aspects of life.
Trey out!
Week 2 - That’s a lot of data
June 14th, 2019
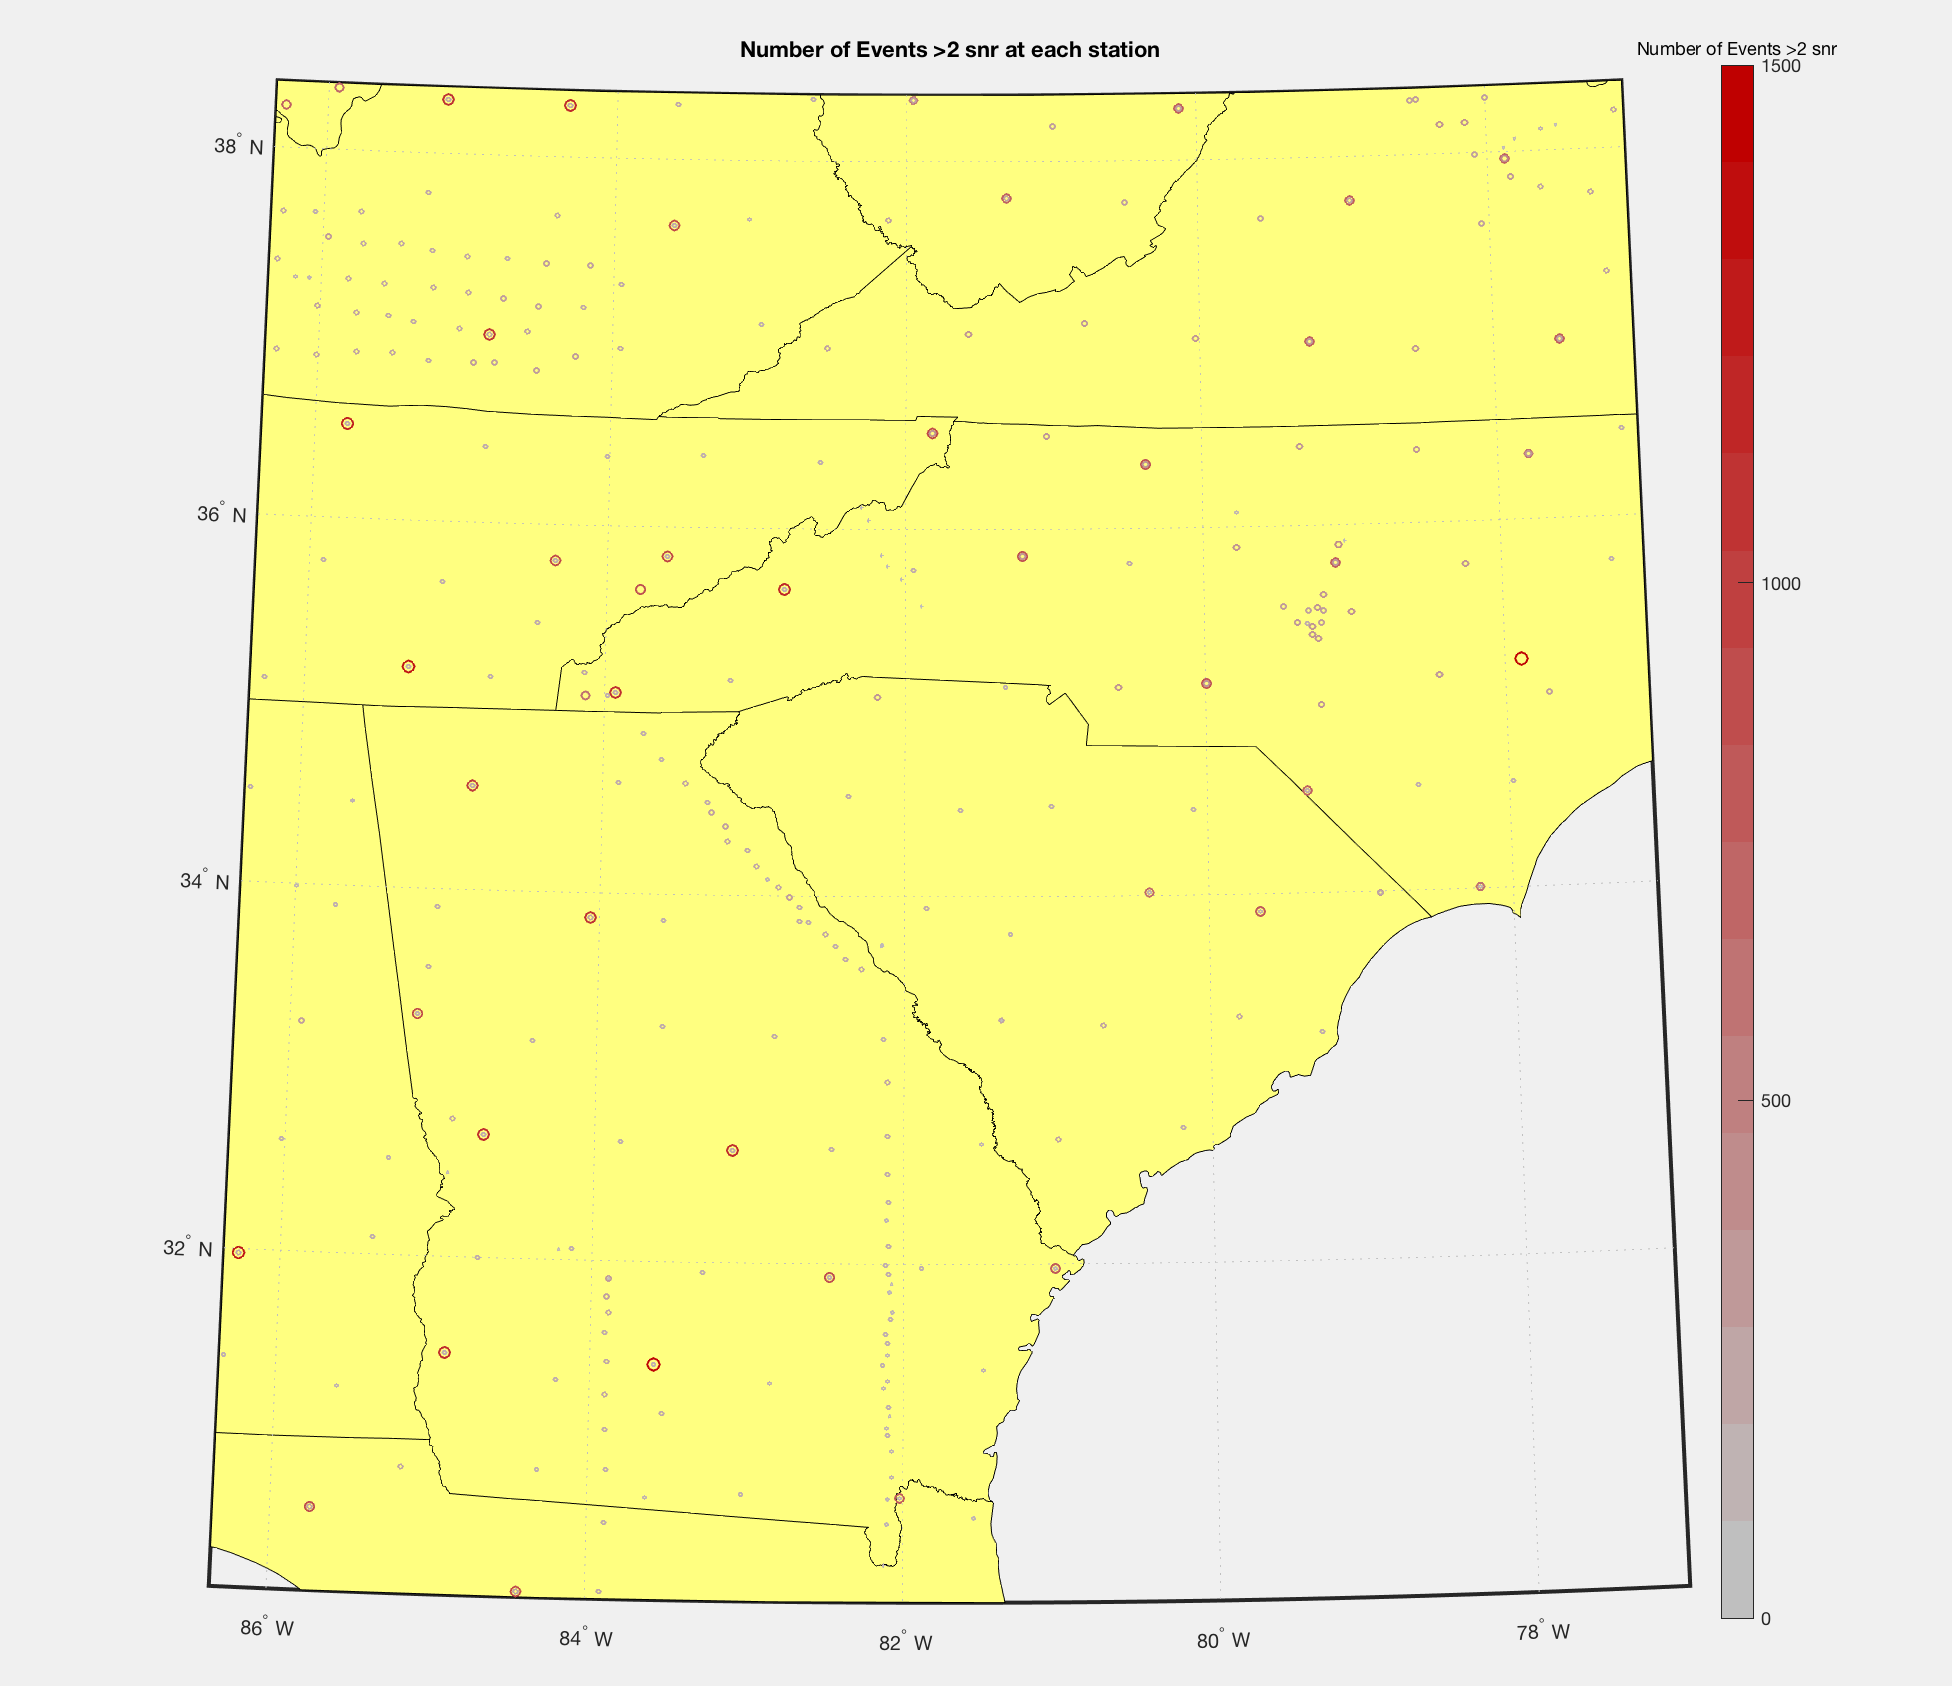
For the past several days, I've been downloading a lot of station data from IRIS, as well as data from seismic events that are within the lifespan of these stations. The data we are interested in are all from the Southeastern US in an area of about one million km2. So far, I've been mainly trying to assess the quality of the data and how good of coverage we have (in terms of back azimuth, ray parameter, and simply ground coverage). I've been looking at signal to noise ratio events picked up at stations and cross checking them with catalogued earthquakes by adding a predicted travel time. I’m starting this event processing from the ground up with some help from Tolu. He’s going to help with writing some of the more difficult code. Next week I’m going to finally start looking at waveforms and start my receiver function stacking! Below I'm attaching a very preliminary view (and pretty ugly) of our station coverage and the number of events picked up at each station with a signal to noise ratio of greater than 2.
On the skills sheet we were given at the orientation, there was one skill that really struck me. It was the "Communicate knowledgeably about your research area and discuss
concepts in a scholarly way with academic colleagues (e.g. defend an argument when asked questions, and explain your project to people outside)" skill. As I've always kinda struggled with putting my thoughts into words (especially verbally!), because often it seems like I grasp some concept or some other idea or something, but when I'm suddenly on the spot to explain what I'm thinking I just sit there like a deer in the headlights before regaining my train of thought. Hopefully, as the summer progresses, being in that situation more and more will make it easier for me to explain myself! In fact, this Monday I am giving a small presentation on the work that I've done so far to our research group.
Trey out!
Week 1 - Getting acclimated
June 10th, 2019
I’ve been having a great time in Rochester so far. I’ve gone to a beach on Lake Ontario. They had some limestone boulders with some cool little nodules of calcite. I’ve met everyone our lab group and they all seem super cool and are incredibly helpful and nice! I’ve also made a friend, we played some smash bros. This last weekend, I went with a group of people to the Rochester Science Museum, where they had a pretty sweet photonics exhibit (also a small area on seismology!).
Anyway, in terms of what I want to accomplish here at my internship this summer, I have quite a few goals. I’ll be breaking them up into thirds, corresponding with each third of the summer.
First third goals:
- Make some friends and develop professional relationships
- Learn the city of Rochester better (e.g. bus routes, fun places to hike, etc.)
- Become comfortable asking for help when I need it (I’m incredibly stubborn!)
Second third goals:
- Learn more of the methodological nuances of my project
- Become more proficient with MATLAB and shell scripting
Final third goals:
- Be able to more comfortably present my research in front of groups of people and complete a presentation for the Kearns Center.
- Work on my AGU abstract and submit it
- Determine whether I want to continue with seismology or to explore another aspect of geophysics
- Become confident in my own abilities and my research
Overall goals:
- Stay on track with the GRE prep class they offer here
- Make a list of what graduate schools I want to apply to and which faculty I’d like as my advisor and get into contact with them
Many of these goals are more of a gradual shift than a sudden one, so they might be difficult at first glance to figure out if I’ve accomplished them or not. However, I’ll be keeping a journal which if I look back on should help me figure out how much I’ve improved. Some other goals will be pretty clear once I’ve completed them.
Trey out!


