Page Dabney

Page Dabney is a student at Eckerd College currently completing her research at University of California, Riverside under Dr. Heather Ford .
This summer, I will be using Sp receiver functions to image the structure of the Australian lithosphere. This project is a follow up of the analysis to a study in 2010 (The lithosphere-asthenosphere boundary and cratonic lithospheric layering beneath Australia from So wave imaging). Since 2010, seismic networks have expanded, providing more data and coverage across the continent. My role in this project will be to request and process data from broadband seismic stations. In addition, I will take on forward modeling and interpret the results to better characterize the structure of the lithosphere and the nature of the lithosphere-asthenosphere boundary.
Week 9
August 13th, 2019
Well this is my final week of the internship. During this time, I have been working on putting together my poster for AGU. In addition, this week is dedicated to reflecting back on the internship and my goals for the summer. At the beginning of the internship, I made a list of goals to try to accomplish throughout the summer. Overall, I accomplished a majority of them. The two important goals I believe to have succeeded with are: feeling confident about my work and my ability to discuss my research and having a better understanding how to proceed with my education and what options there are. I am also very happy that I have gotten experience coding and was able to be somewhat sufficient at it. I actually enjoyed that part a lot (despite it also being incredibly frustrating at the same time). This summer has been a great experience. I have learned so much from this experience about geology/seismology, myself, and what I want to do in the future. I am very grateful to have had the opportunity to participate in this internship and do research at UCR.
Week 7
August 4th, 2019
At this point in the summer, I am finally “over the hump of the learning curve” on my project and it is exciting. The past couple weeks have been some of the more interesting weeks because I have results and now it’s mainly about interpretation and figuring out the best way to present the findings. It has taken some time to get to this point in the project, and I have faced several challenges along the way.
Two of the main challenges I faced this summer was learning how to best manage my time and feeling good about my work. Over the course of this internship, there was no specific schedule to follow or assignments to complete. Some days I would need to work for hours to run different sections of code, to examine figures and record depths. There were other days where my main task was to just periodically check on the code and make sure it does not break. Because weeks were not very consistent and often highly dependent on what stage of the project I was at or the computer, setting daily and weekly goals were very helpful. These goals also helped me manage my time and made me feel more productive at work. I do still need to work on managing my time because I have admittedly been a bit behind on my iris assignments such as blogging on my fellow interns pages (Although I have read and enjoyed them. Some I find quite entertaining and I believe have a pretty good knack for blogging).
Fifth Week
July 21st, 2019
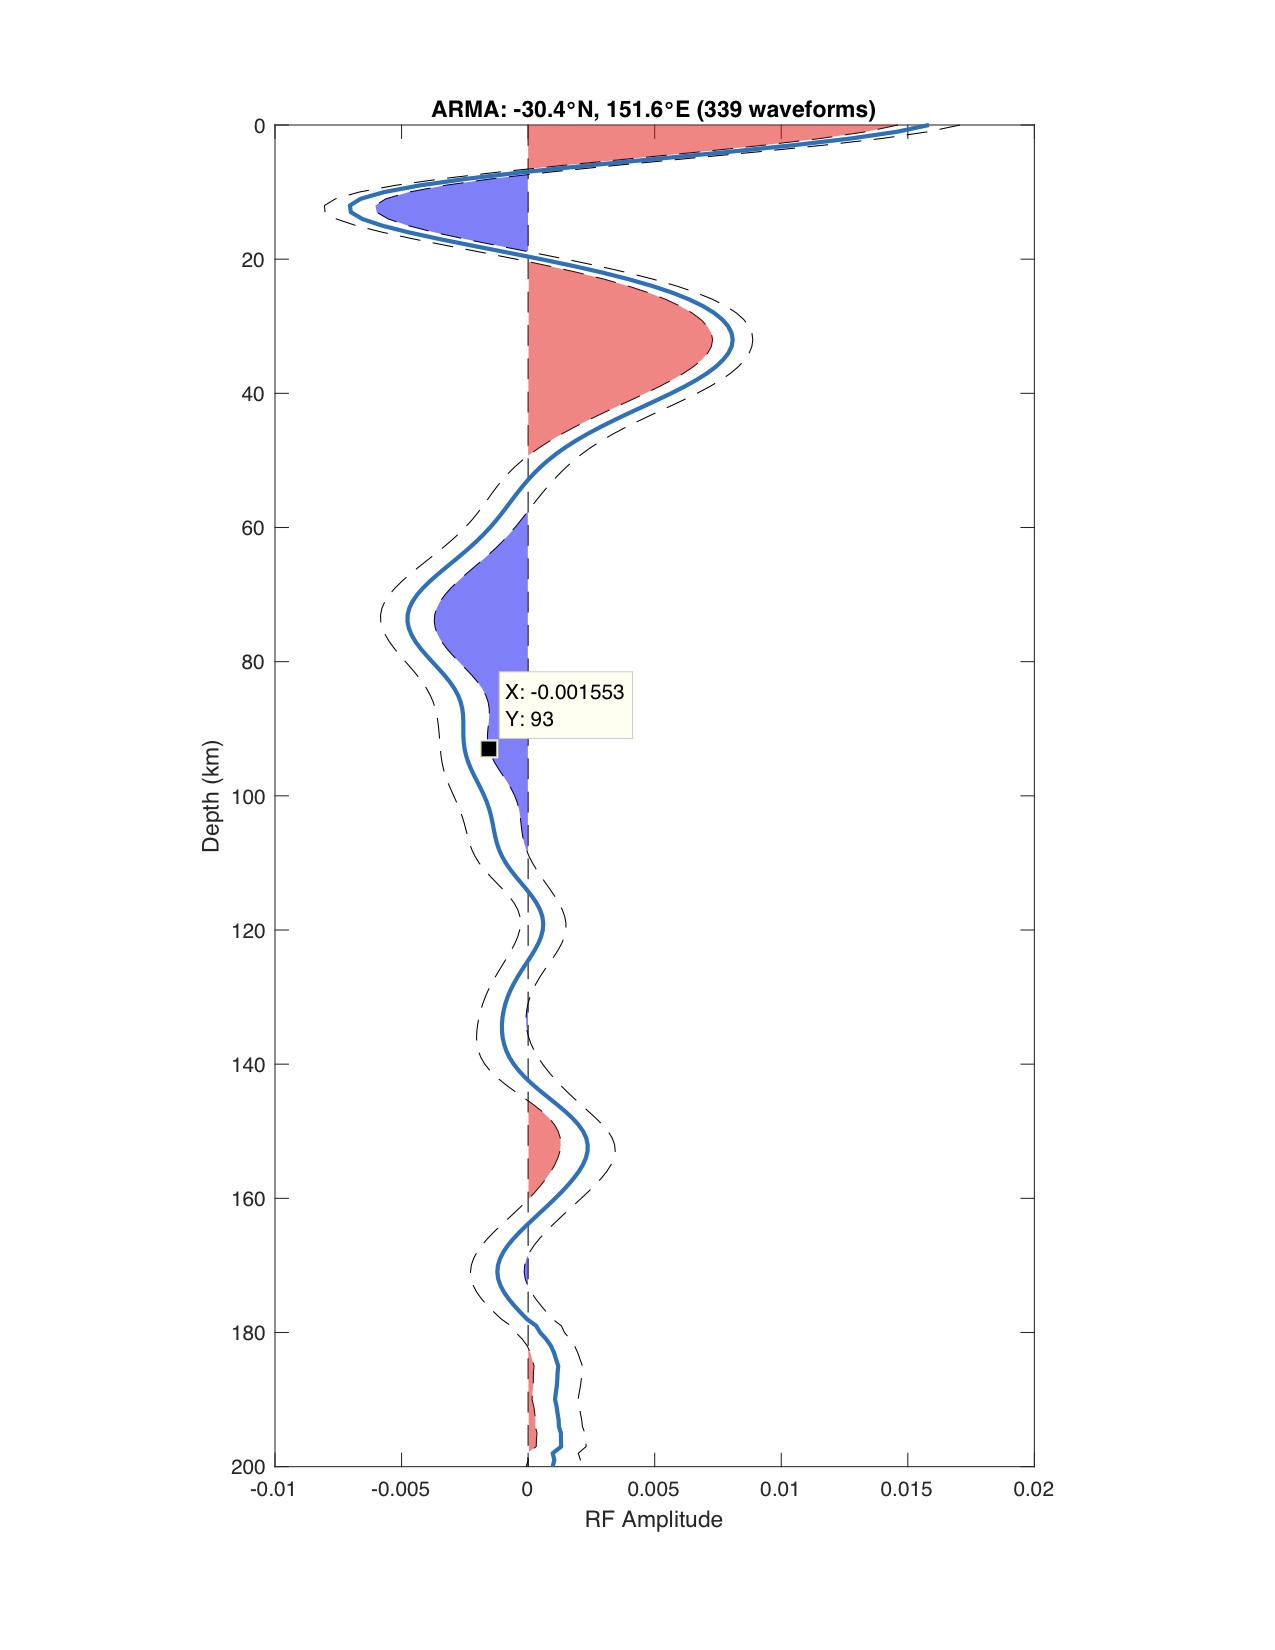
This week was exciting because I finally got to see some results. I enjoyed analyzing some of the results because it helped me get a much better understanding of the overall project and it was satisfying to actually see my progress. Unfortunately, there were still moments when the code did not work, so a few more things needed to be adjusted. However, I am fairly confident that there should be no more problems moving forward. I hope this next time the code finishes processing, I will have my final results. This is an example of a figure that was produced during the processing of the data. This figure is of a single stack station in depth from the station ARMA.

The paper that is most important in my project would be The lithosphere–asthenosphere boundary and cratonic lithospheric layering beneath Australia from Sp wave imaging (2010). The project that I am doing is essentially a follow up of this project, using the same process of Sp receiver functions and analyzing the same region. One of the main reasons to do this project is that since 2010, there have been several more stations installed and almost 10 more years of data that can be analyzed. Ultimately, the results from my project will be compared to the results from this paper, which is why it is so important to my project.
Fourth Week
July 21st, 2019
Sorry I am a little bit behind on posting blogs. I would say one of the main challenges that I face is working with the code in matlab. I am using a long code to analyze all of my data, which takes a very long time to process. Frequently, this code has broken for various different reasons. Each time I had to find and correct the problem. Then I would reprocess that section of the code. Sometimes that section would take days to process and I often would just have to wait and see if it breaks again. This was frustrating at times because it sometimes seemed like I would work on just one part of code for days without accomplishing anything. On the bright side of things, each time the code would break, it gave me an opportunity to better understand the code and the process. Each time it would break, it helped me practice using matlab. In addition, it really helped me learn more about matlab and coding in general. I am much more capable with matlab and coding than I was at the beginning, which was one of my main goals. I am at least proud to have accomplished that goal, however, I still have a lot more to learn.
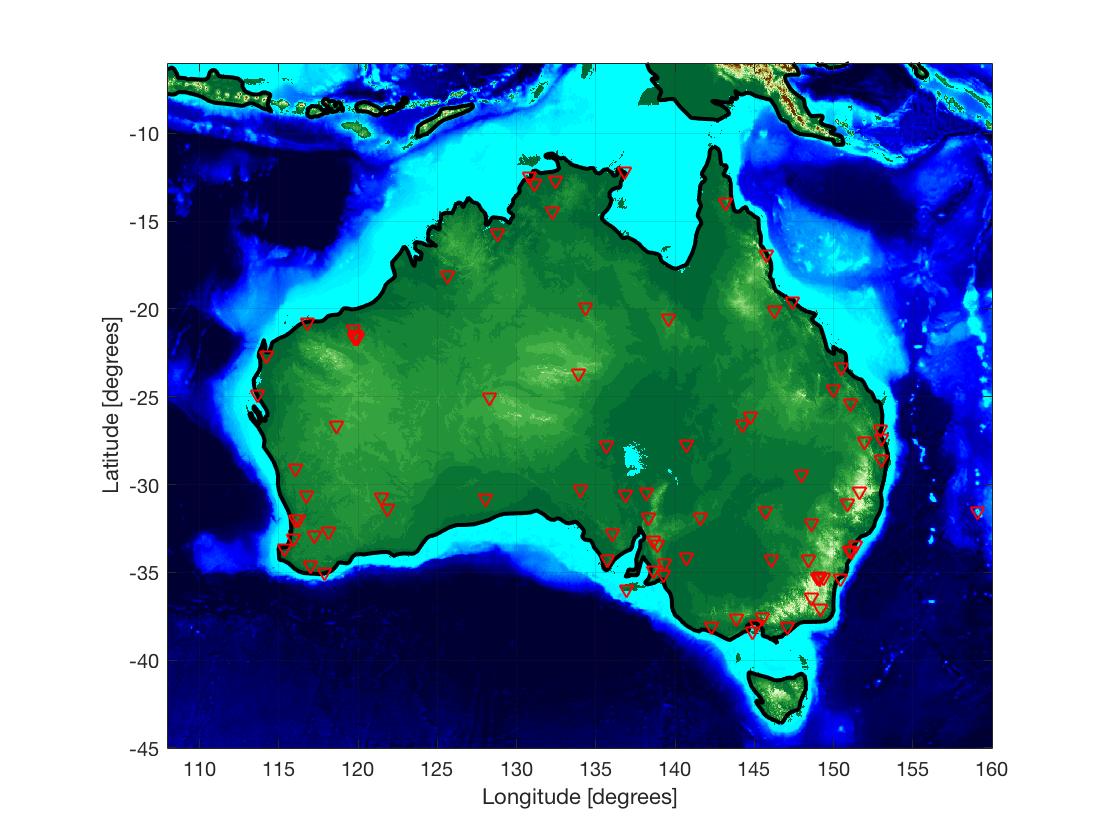
I almost forgot... This is a general map of Australia with the locations of stations that I collected data from. However, as the weeks go on, the number of stations will most likely go down depending on the quality of the data. This figure was created in matlab.

Third Week
June 30th, 2019
This week, our assignment from IRIS was to develop an ‘elevator speech’ for our individual projects. These types of speeches are important and useful because they are essentially a bridge that connects science/research to an audience that may not have the same level of knowledge or understanding (possibly no knowledge at all). It gives others a better understanding of the importance and relevance of your work. This speech is useful for meetings such as AGU, but also useful in simply explaining to anyone (friends, family, co-workers, employers, etc.) what it is you are doing.
I found this assignment to be very useful because it gave the me opportunity to evaluate my current understanding of my project. It made me realize the areas in my project that I do not fully understand, but I can now look into or as questions about. I found that the assignment was a bit easier than I had anticipated because I have already been developing this speech when I explain to family and friends what I have been working on this summer. However, when I have been practicing, I realize that I have not been consistent on the things that I emphasized or the way I explained things. Overall I could stand to continue practicing and revising my speech. And I am sure as I continue working and learning about this project, my speech will evolve.
Second Week
June 28th, 2019
The second week, I had been working on processing all of the data from the broadband seismic stations. For my project, the data that was collected were from permanent and temporary stations in Australia. The data set collected was selected using earthquakes with a magnitude of 5.5 or greater over roughly the past 30 years. It was requested and obtained the data from IRIS. Once downloaded, the data was then unpacked and processed using a code on Matlab. There was a LOT of data, so the overall task of processing all of the data has taken all week and some.
One of the skills that I believe is important to develop is the use of software and statistics for data analysis and presentation, in this case, understanding Matlab and GMT. Prior to this internship, my experience in computer science was minimal. My hope is to develop my understanding of coding and computer science and the ability to create or edit scripts that will satisfy my needs as well as be able to debug errors that may occur. If I am able to do this independently, or with minimal help, and be able to explain what I am doing, I would consider myself proficient. However, there will still be more that I can learn, practice, and improve on.
First Week
June 16th, 2019
This past week was my first week in Riverside and first time working on my project. I have had the opportunity to get to know my surroundings a bit. Lucky for me, I have found a rock climbing gym down the street, which I have frequented several times already. So far, everyone I have met is incredibly nice, welcoming, and helpful. I am looking forward to working with them and on this project.
For this week, I have read the publication of the 2010 study, which my current project is following up on. In addition, I have requested data from the broadband seismic stations and am currently working on processing the data using a code on Matlab.
So, there are a few goals that I would like to accomplish through this internship. I am very interested in coding but have very little experience. One of my main goals is learn and practice coding to become proficient. I would also like to improve my abilities to work independently, to work through problems, and to develop a good sense of how to analyze, organize, interpret information. Lastly, I am fairly new to seismology and I want to determine whether or not this is a field I'd like to study in the future.
These are my goals for the summer split up into thirds
First goals (1/3):
- Become familiar with Riverside and the surrounding area. Perhaps explore other areas of southern California.
- Read and learn more about my project, seismology, and the field of geophysics.
- Learn about various fields in the geosciences as well as education and career options.
- Become comfortable with Matlab, GMT, and Unix.
Second goals (2/3):
- Have established relationships with my peers or faculty.
- Have a better understanding of my project including the background information, the process, and the significance. Be able to understand the results from the data and to interpret.
- Be sufficient at coding. Be able to create plots and maps using Matlab or GMT. Be able to create my own script or to alter an existing one to satisfy my needs.
- Learn more about relevant projects or even other areas of study through reading scientific literature (in hopes of determining if seismology would be a good career path).
Third goals (3/3):
- Construct and submit an AGU abstract.
- Be comfortable and satisfied with my knowledge on my research and my ability to present and discuss it.
- Have a better understanding on how to proceed with my education and career. Research graduate schools, projects, and faculty members I'd like to work with and get in contact with them.


