Ben
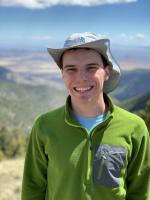
Ben is a student at Luther College currently completing his research at Brown University under Colleen Dalton.
This summer, I am studying Rayleigh wave attenuation in Alaska. By comparing the amplitude of the Rayleigh waves that arrive at two seismic stations that are close together, we can isolate the differences in amplitude to be caused by the receiver or the Earth’s structure. From this, we will analyze the composition and structure beneath Alaska to better understand some of the interesting surface features that occur there, such as the Denali volcanic gap, the Wrangell volcanic field, and the Aleutian volcanic chain.
Week 7: Where has all of the time gone?
July 22nd, 2019
My seventh week here has come and gone! This past week we had a ‘virtual meeting’ where all of the IRIS interns presented our summer research topics to each other. It was fun to see all of the very different projects that everyone is up to. I’m excited to see these fully developed projects once we get to AGU in December!
This week, our task is to reflect on challenges we’ve faced this summer. Personally, one of my biggest challenges has been deciding what to do next and when to move on in my project. One of the difficulties of open-ended research is that there is not always a set guideline for when a task is done, and it is time to move on. I want to make sure I have done everything I need to before moving on to a new part of my project, but sometimes that is hard if I don’t quite know what I am looking for. I’ve been working hard on deciding what should be done next in the project and how to move forward, which I am still working on, but as to when to move on from one problem to another is difficult. In research like this, many small questions along the way could become a whole new research project, so it is best to sometimes just make a note of a question and move on. I can always come back later if I have more time or want to change my decision.
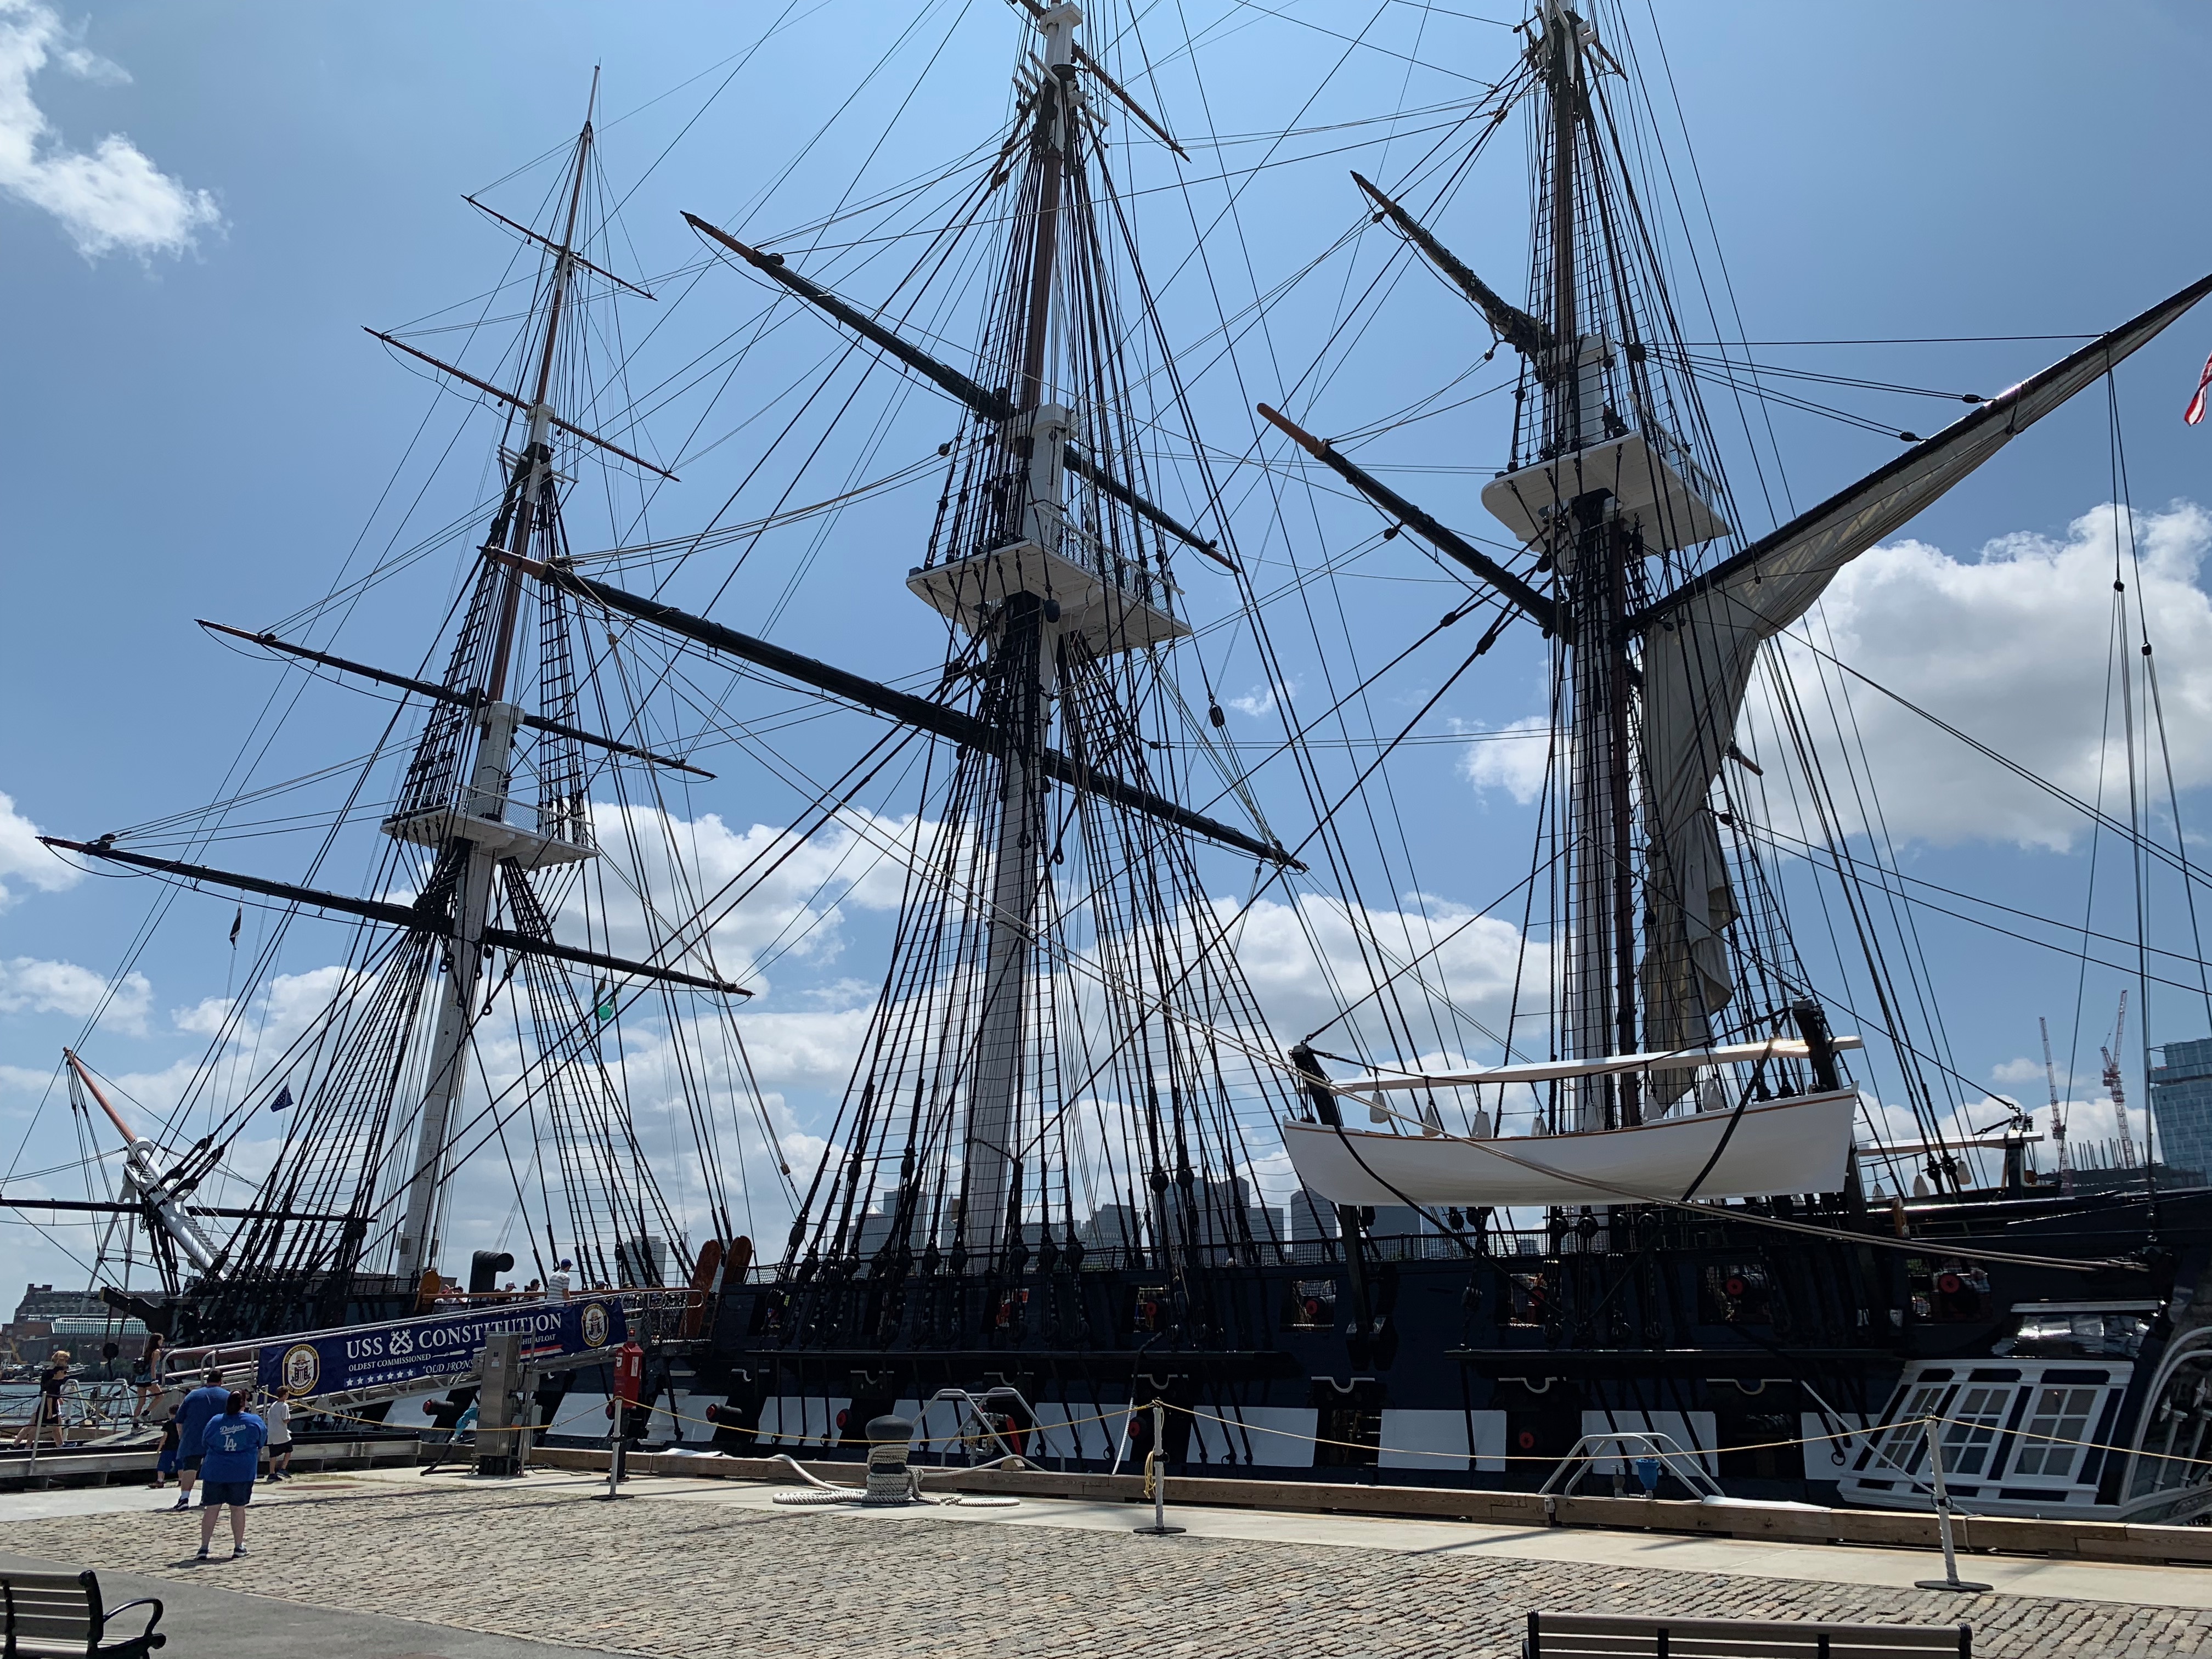
Last weekend, I took the train up to Boston. It was exciting to get out of Providence and see something new. I walked all through town to see some of the historic sites, and ended with a tour of the USS Constitution, the oldest surviving US Navy ship.
Week 5: Halfway point!
July 5th, 2019
This week marks the halfway point for my research at Brown University this summer. I have now finished five weeks of research and have only five more until I head back to the Midwest.
This week we are supposed to post another figure from our project that best represents our research at its current stage.
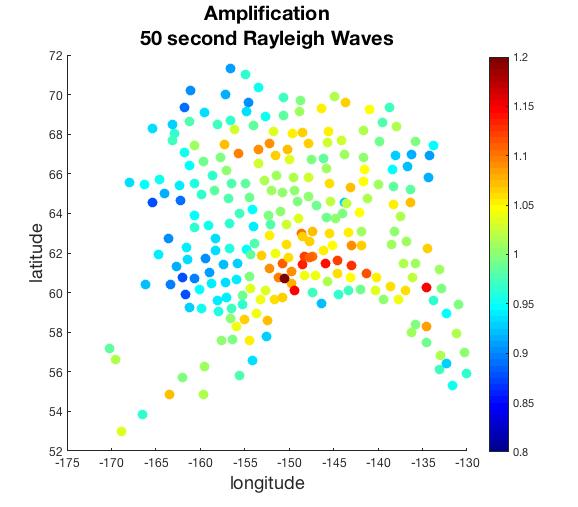
This is a figure of the amplification at each station in my study area. Since the last amplification plot that I’ve posted, I have filtered the data to get rid of large outliers in the data set. In this plot, the amplification is calculated with a weighted mean by the azimuth of the incoming earthquake. This means that if there are more earthquakes coming from one direction than another, they will not have a stronger influence on the amplification calculation but will balance with incoming earthquakes from other directions.
The paper that is most central to my work this summer so far would be a paper titled “Local amplification of Rayleigh waves in the continental United States observed on the USArray,” by Velia L. Eddy and Göran Ekström. This paper introduced me to the process of calculating site amplification at each seismic station. This paper looks at the lower 48 states, but I am applying this to Alaska. The foundation for these calculations is that there are four factors that impact the amplitude of a surface wave that will arrive at a seismic station. By observing two stations that are near each other, we can assume that the arriving waves traveled on nearly the same path, and the only difference in the amplitude would be due to receiver effects, the effects from the station/the earth directly below the station. By looking at the ratios of the amplitudes, we assume the other factors that are nearly the same for the station pair would all cancel out leaving just the ratio of the receiver effects of the station pair. By averaging this ratio for many events at each station pair, we then solve for the amplification at each individual station in the study.
At this point in my project, I have a good process to find the amplification at each station across my study area. I will be moving on to use the amplification to look at how shear wave velocity will change with depth below each station. From this, I will be able to compare my observations with current earth crust and mantle models to better understand what kind of structure below Alaska would lead to these kinds of results for amplification and shear velocity.
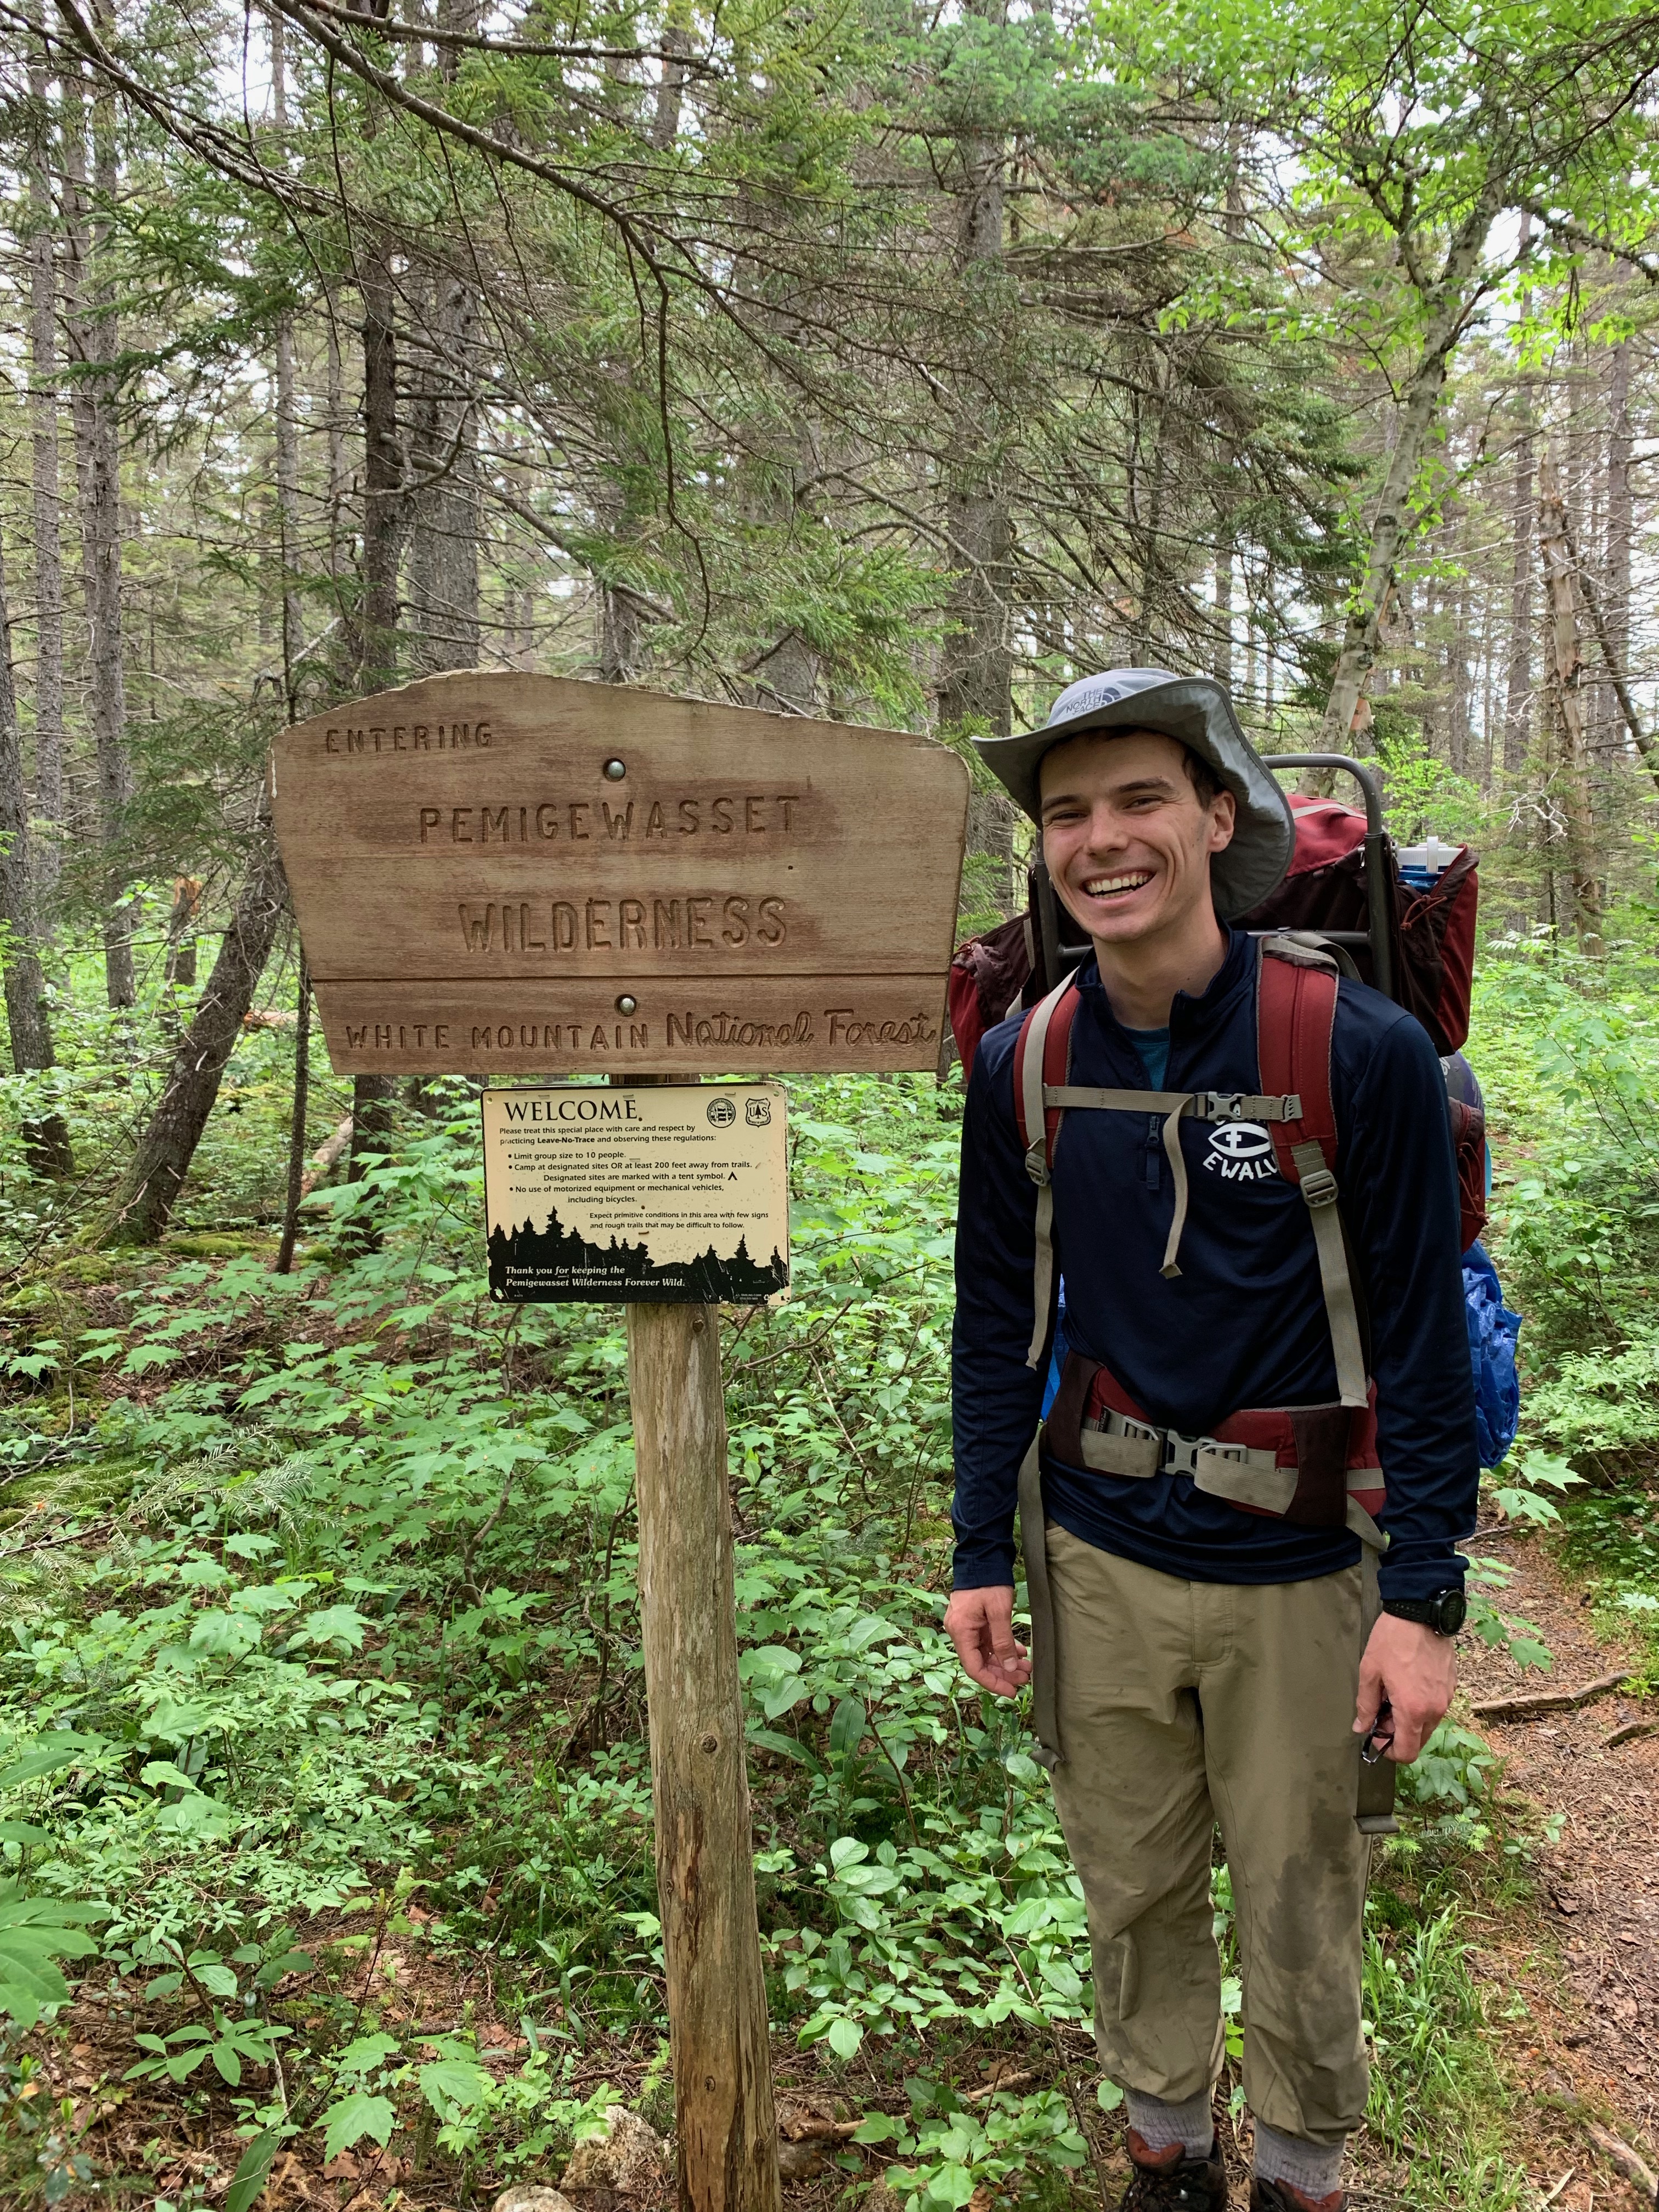
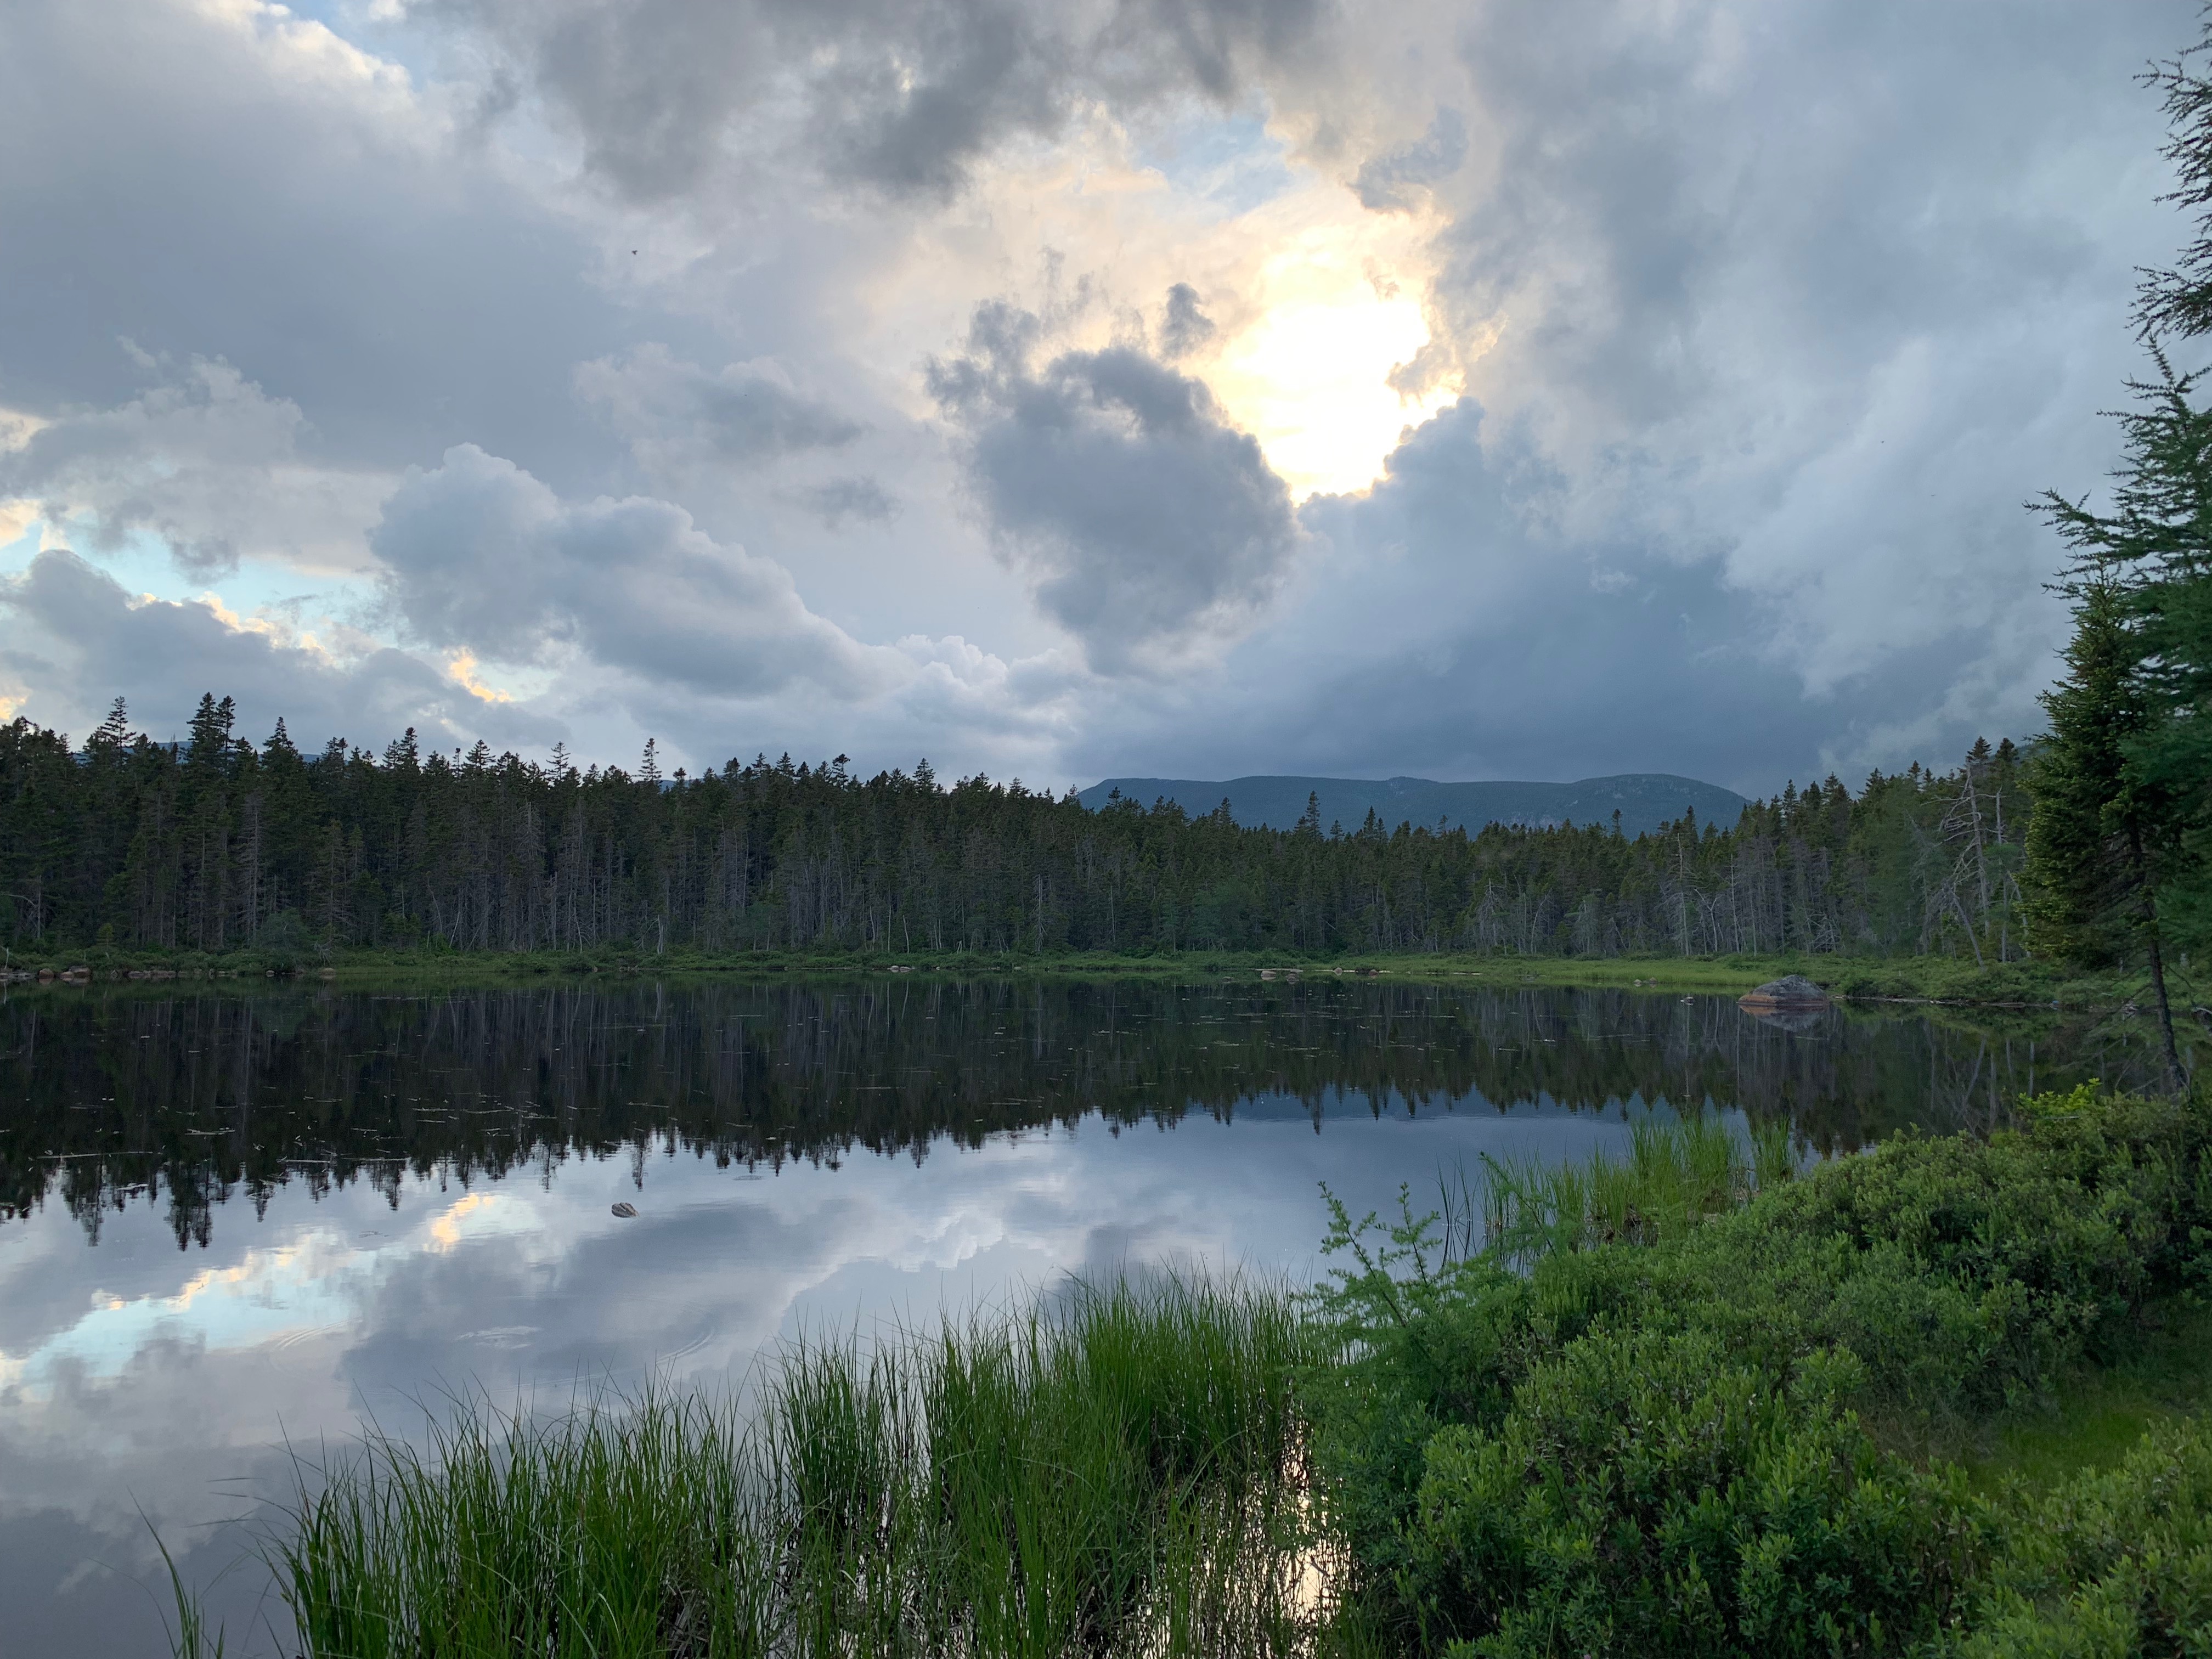
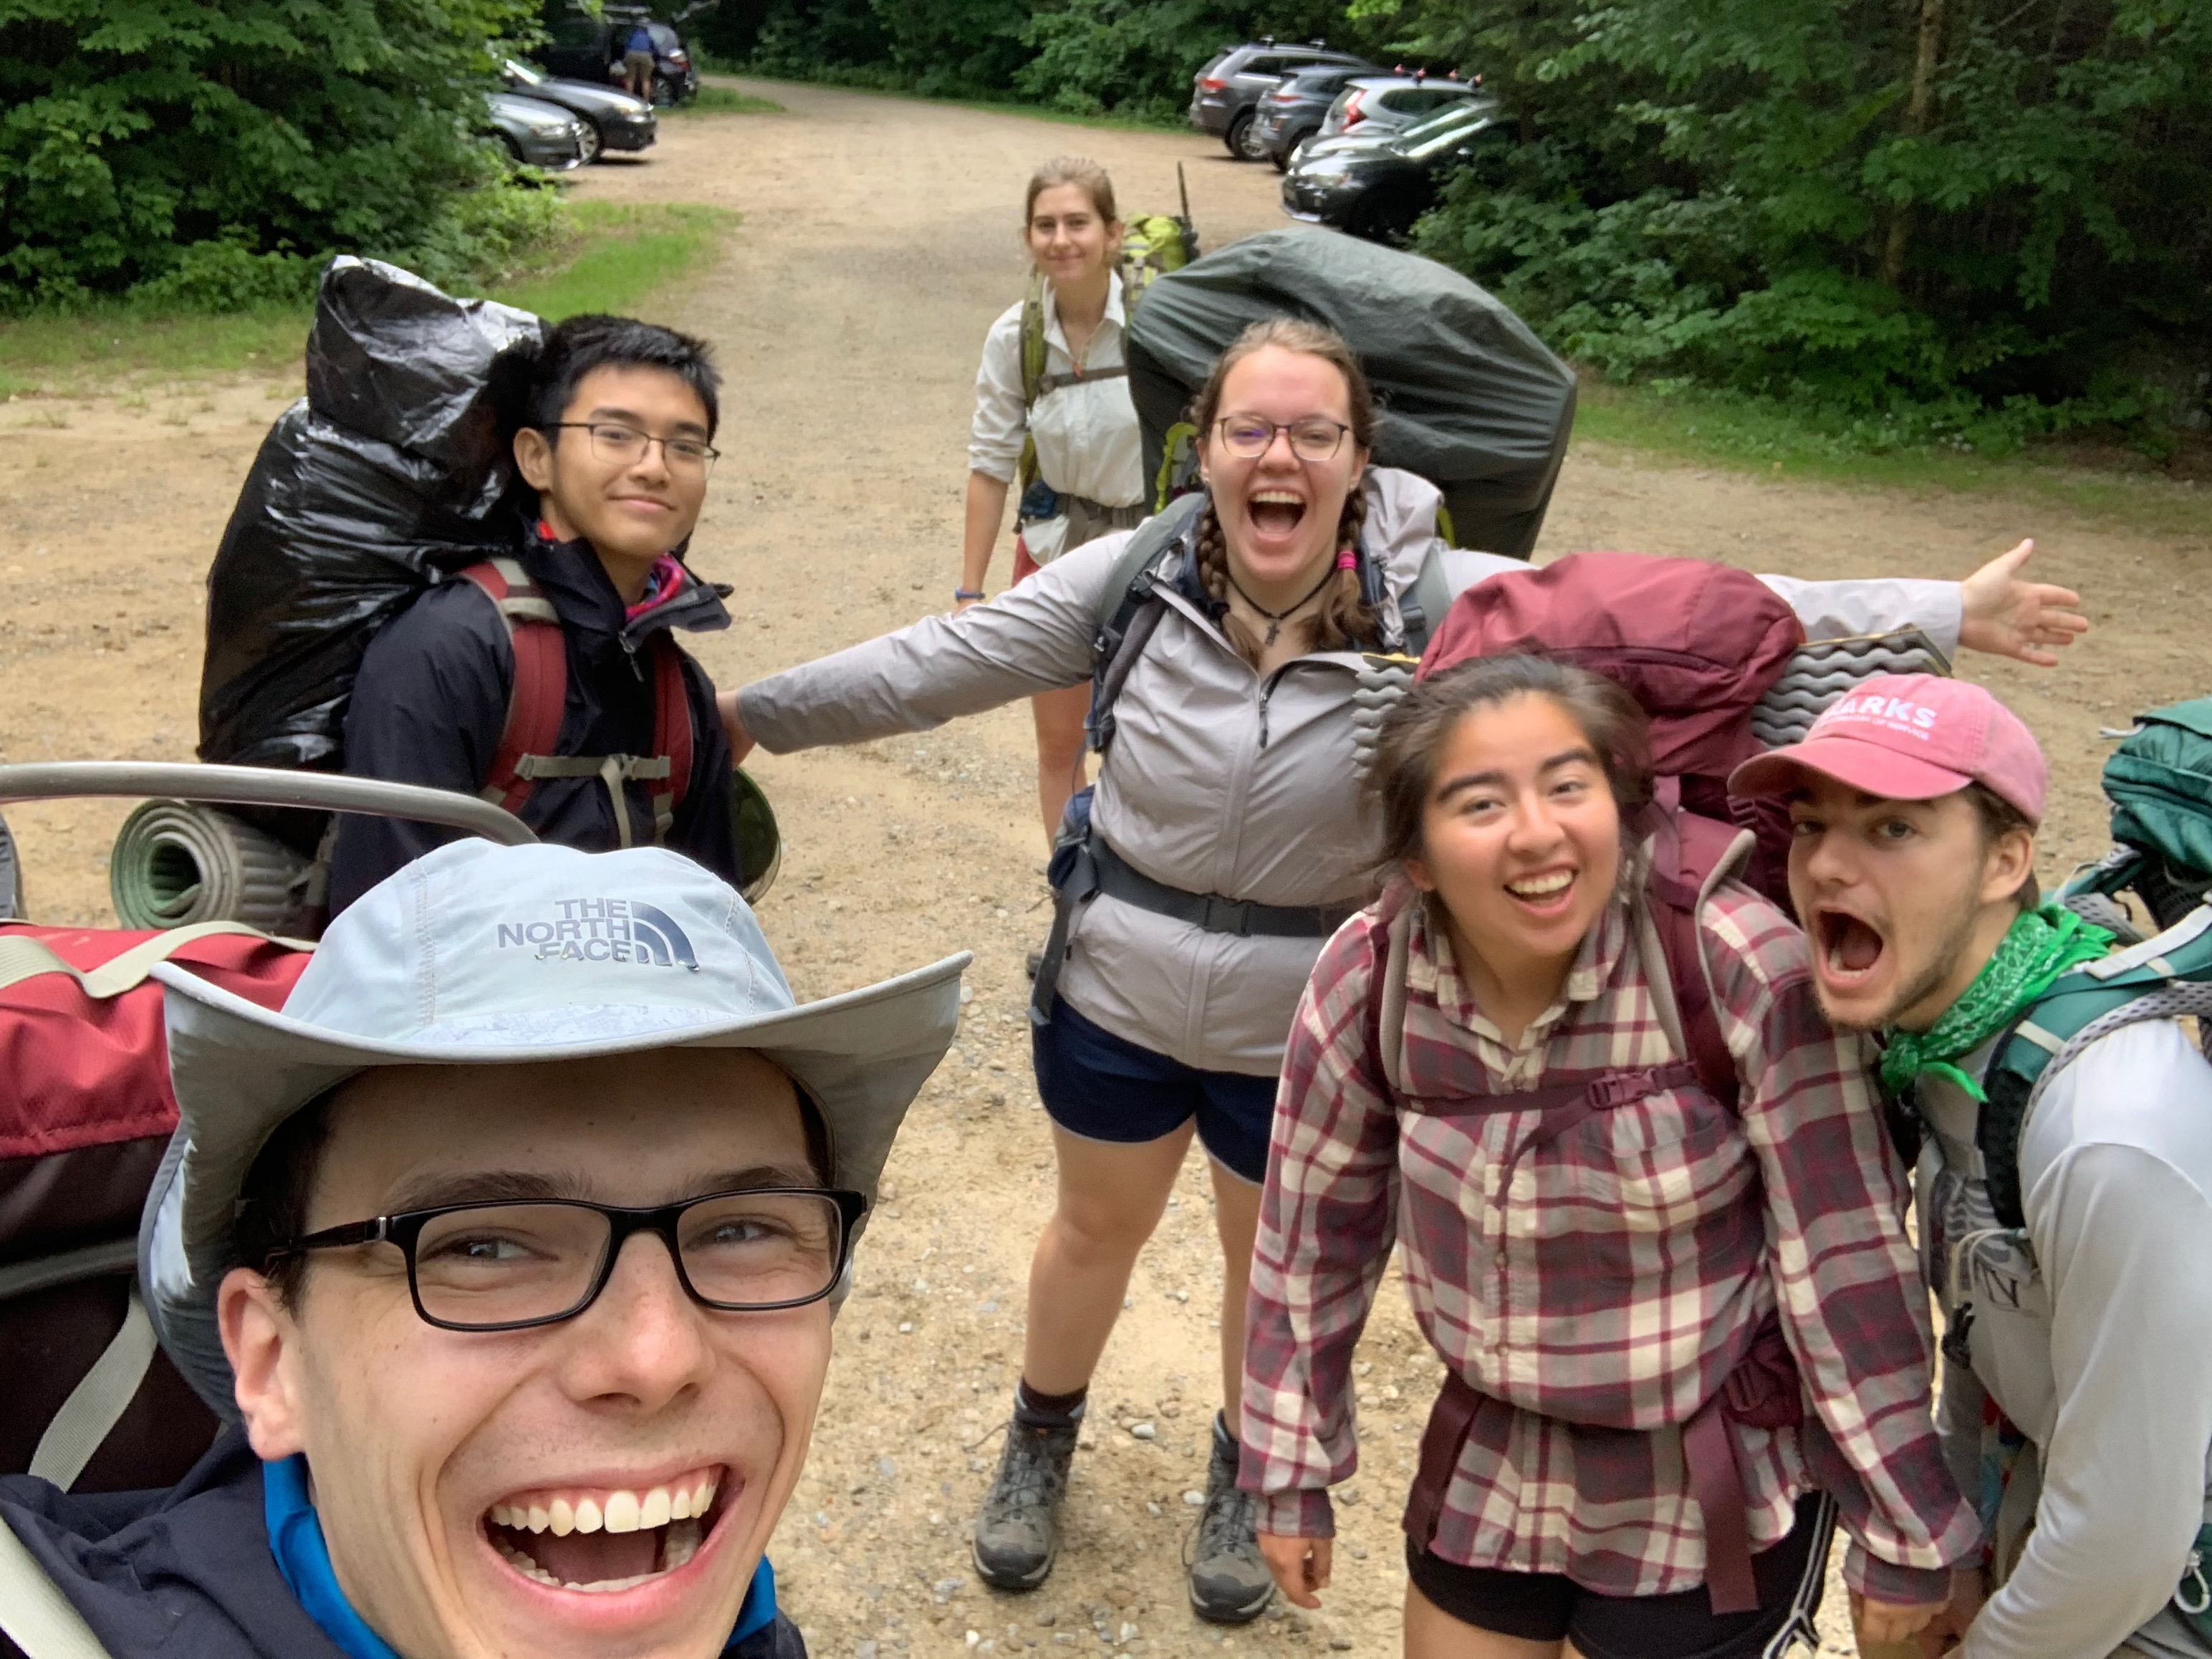
This last weekend I was able to go on a backpacking trip into the White Mountains in New Hampshire with some friends out here. It was very refreshing to get out of Providence and into the wilderness for a couple days.
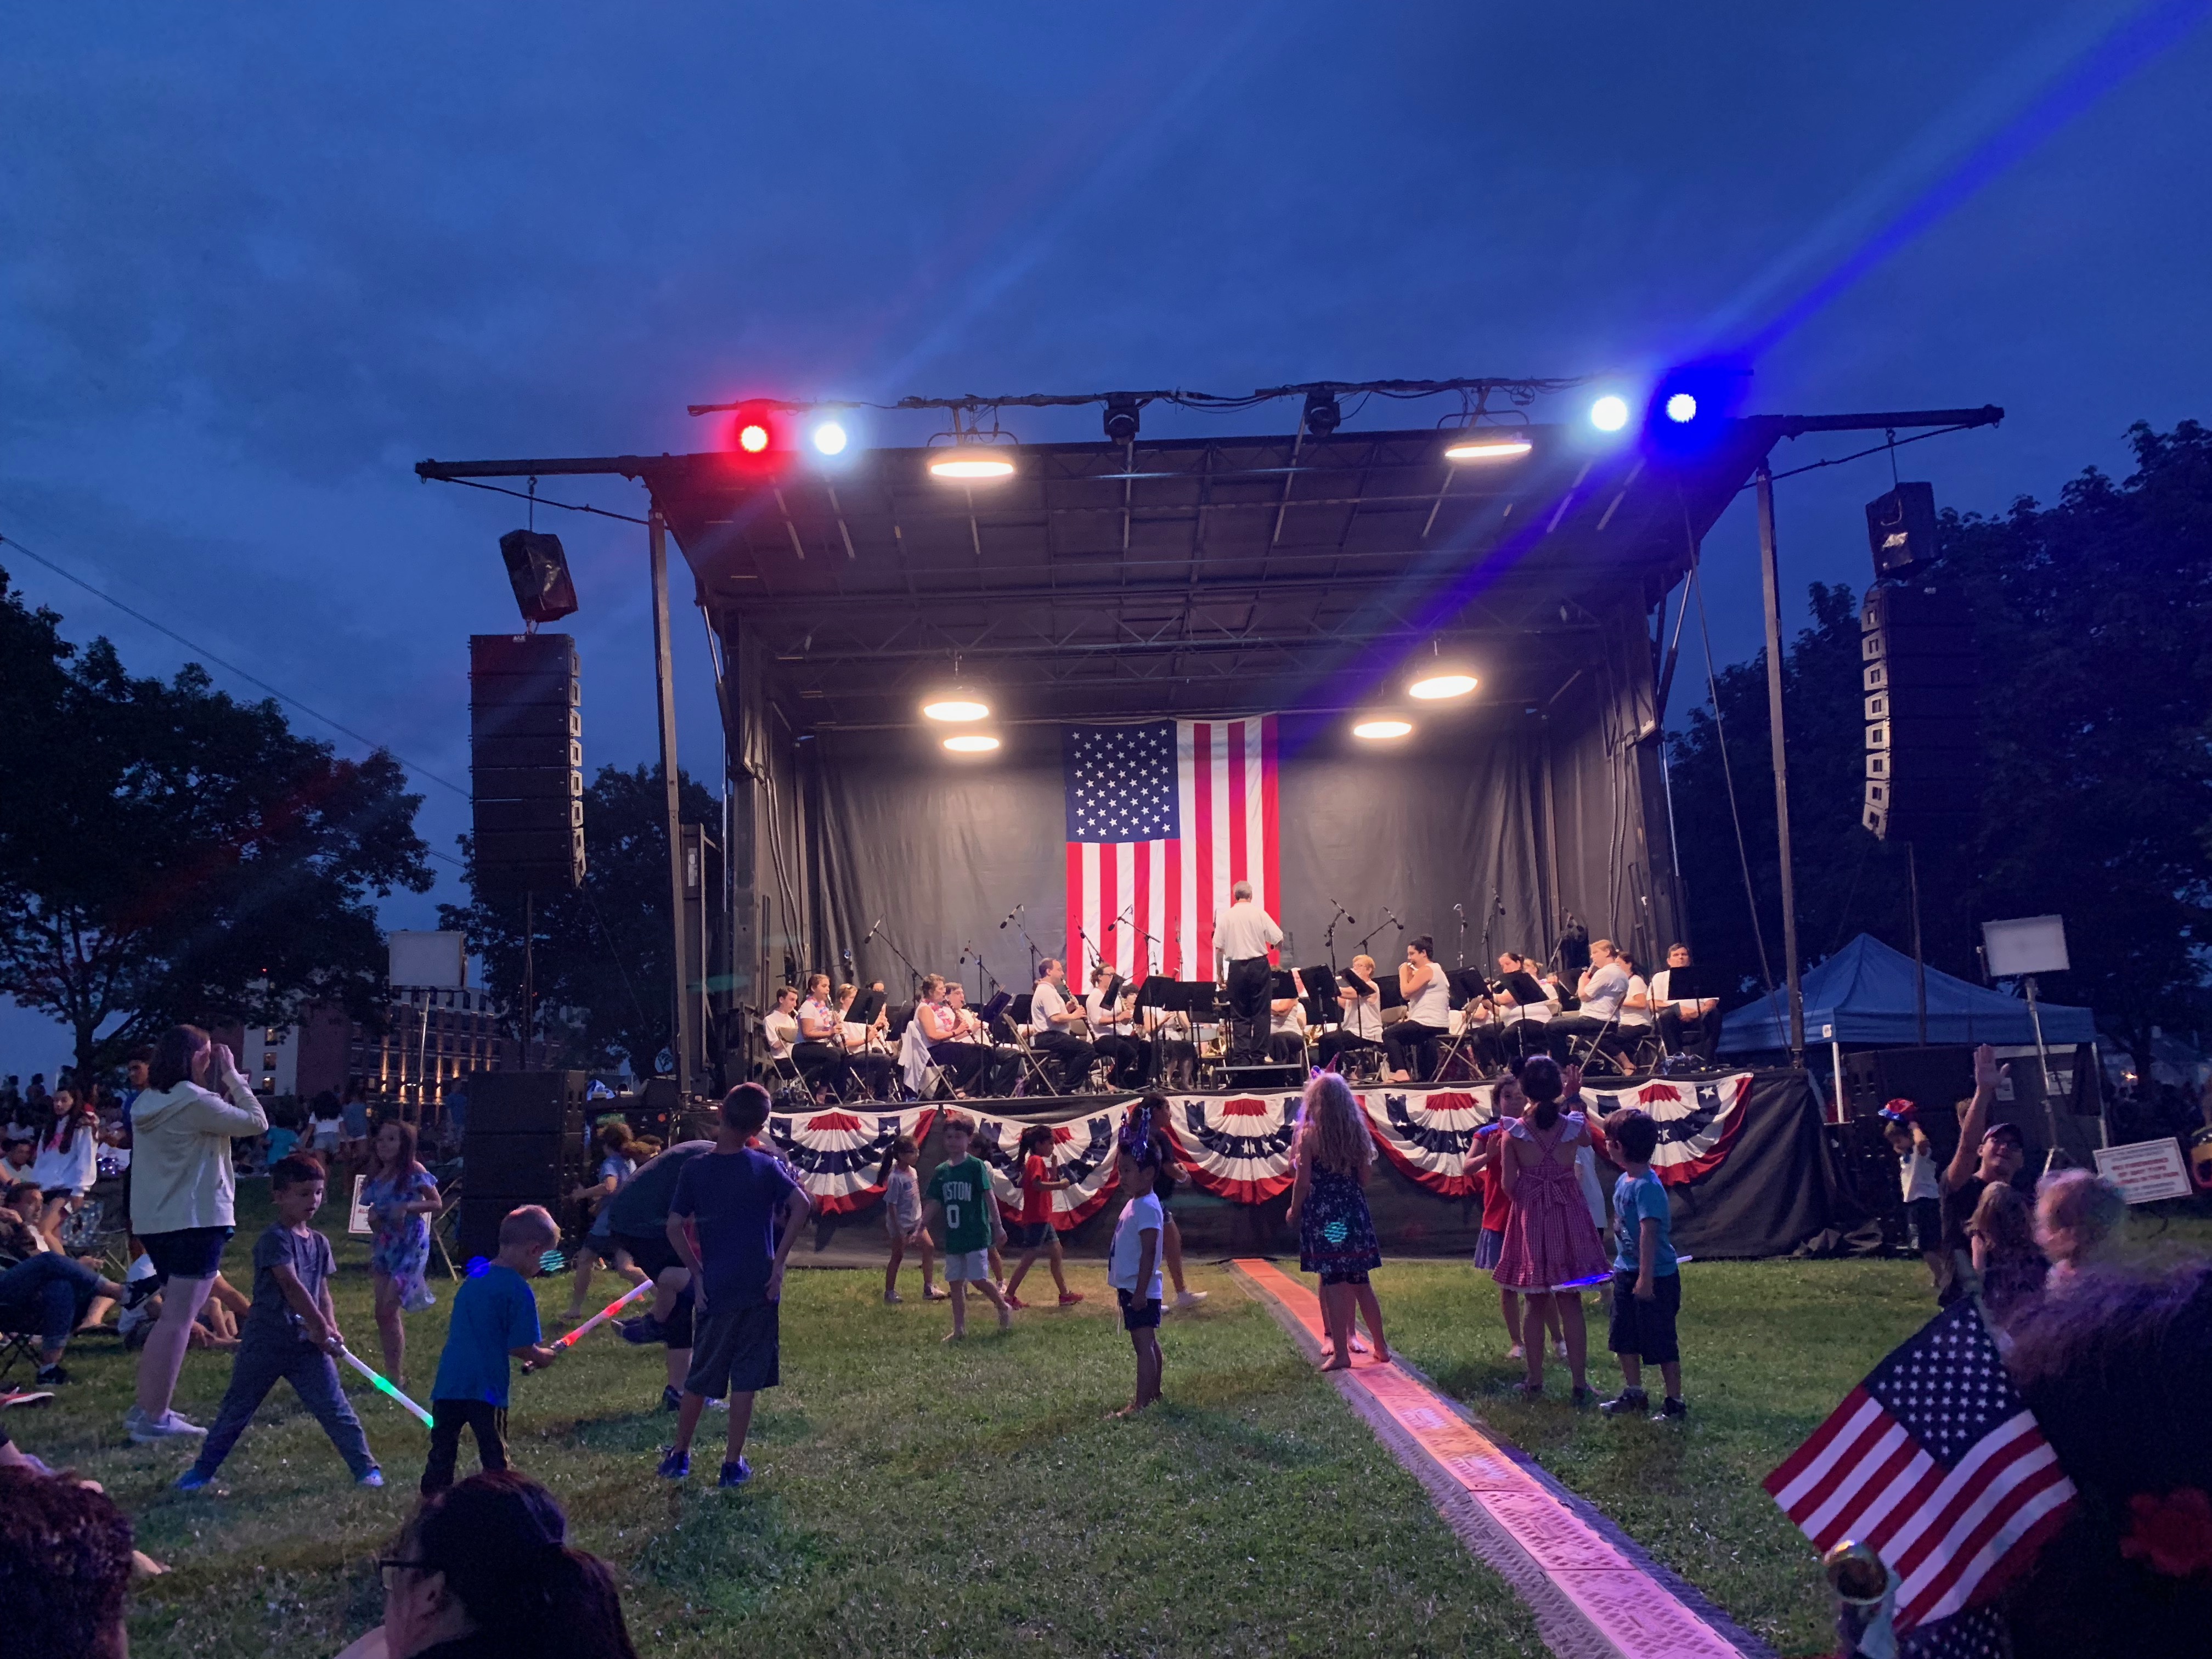
For the 4th of July I celebrated by going to a barbeque and then to the Providence celebration and fireworks that night. A local community band played some tunes before the fireworks.
Week 4: Challenges and Successes
July 1st, 2019
This week for IRIS, we are to reflect on a challenge and a success that we have experienced so far. I’d say one of my biggest challenges is when I want to adapt a MATLAB script to do something else or to work for a slightly different data set than I originally intended. I usually try to make a copy of the script before I start editing, because I don’t want to risk losing the script that actually works. Next, I make the changes or additions I want to the script, then spend lots of time combing through each line of the code to make sure there weren’t any variable changes or indexing errors. I have come to expect to have the first few times of running a script after changing something big like this to have many errors. I feel that sometimes it is far easier to just start with a new script and use the old script as an outline but write it from the beginning if I am making significant changes.
Although I do get stuck in MATLAB sometimes, when it works, it works great! Before last weekend, I set up some code to download about 5 years of seismic data from Alaska, and when I got back on Monday it was finished with no errors! I have also been able to run this data through some preliminary processing, and we are starting to see some promising trends in the data! It is really exciting to have the code I write for a few events work when I scale it up to around 400 events in total.
This summer, I’ve already made a few plots of my research area in MATLAB, but I wanted to try to make a map in GMT, of which I have no experience. One of the grad students in the lab here was able to give me some sample code and help me understand how to get started making a GMT map. I definitely have a lot more I need to learn about GMT, but this is a simple plot of all of the stations that I am using in my analysis plotted with geo/political lines as well. I still need to figure out how to make a title and other things like that in GMT, but I am pretty proud that I was able to make this map as a start.

Also, this last weekend my family came out to visit me in Providence which was a lot of fun! We spent a day up on Cape Cod and another day out in Newport, RI. Also, this last weekend was the first ‘Water Fire’ in Providence, which is when they light these giant torches in the river all through town, lots of food stands and vendors, live music, and lots of people come out to watch. It was a really fun and interesting experience.
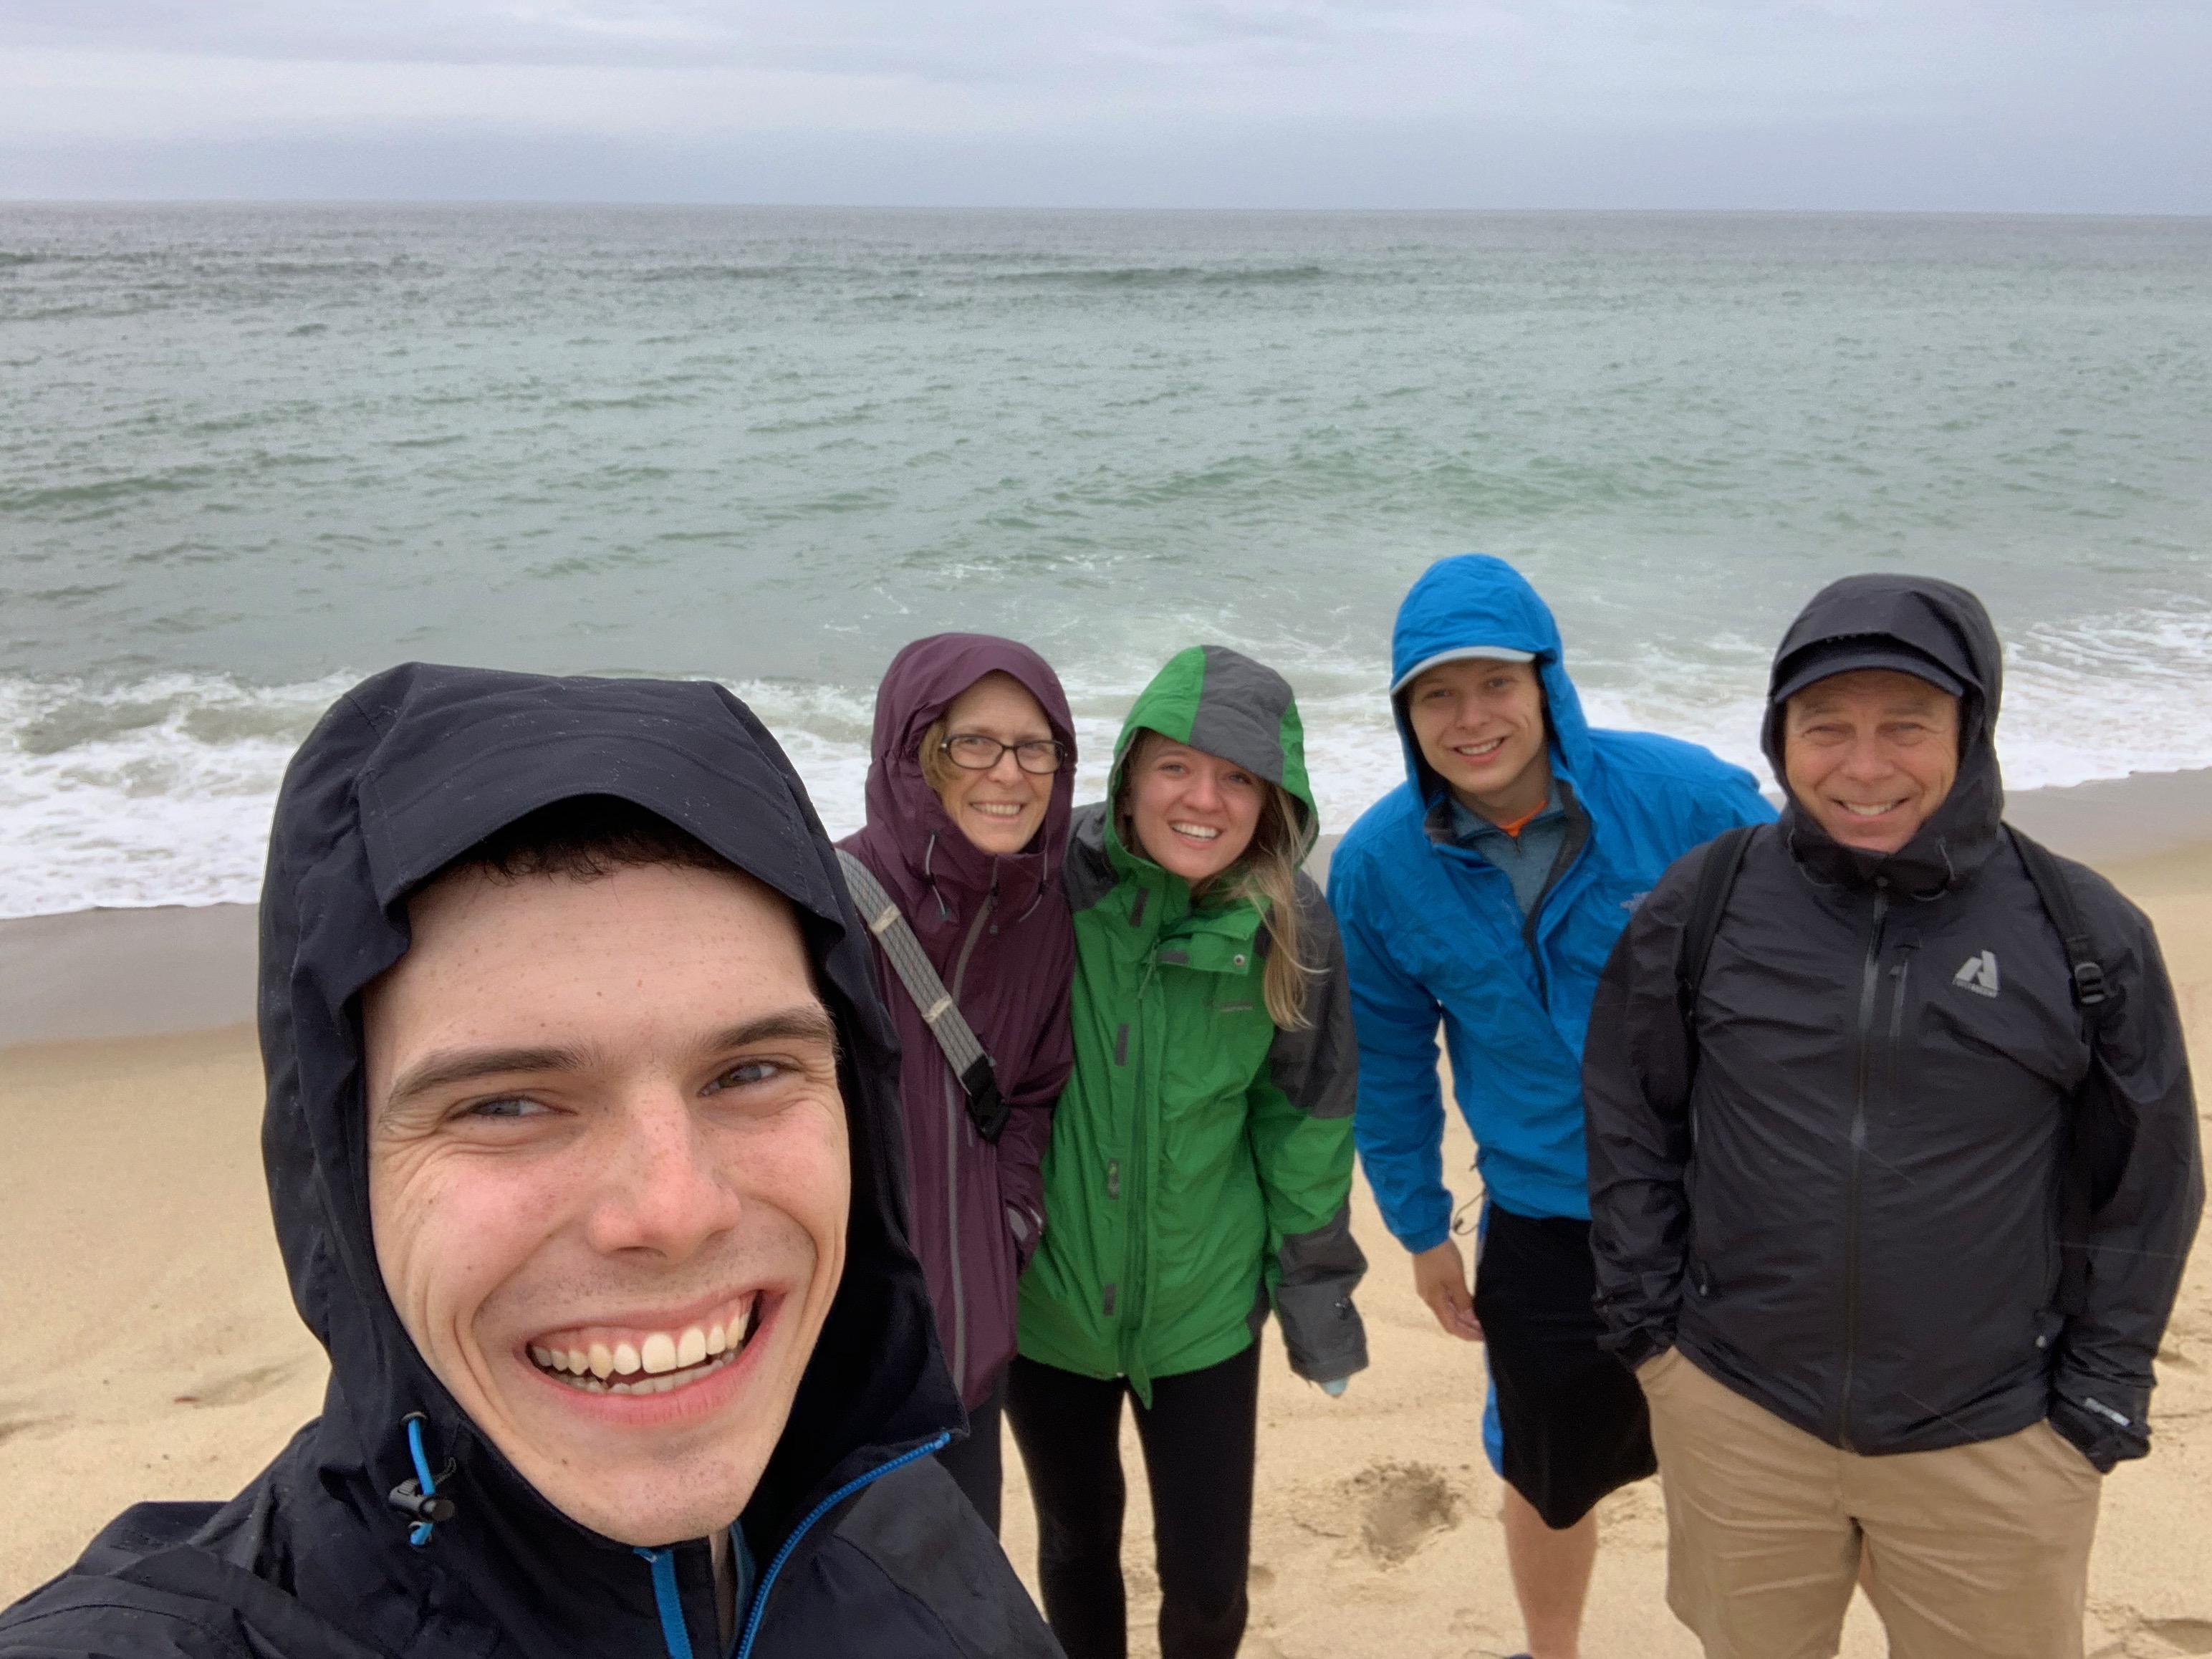
Rainy afternoon watching the seals off Cape Cod.
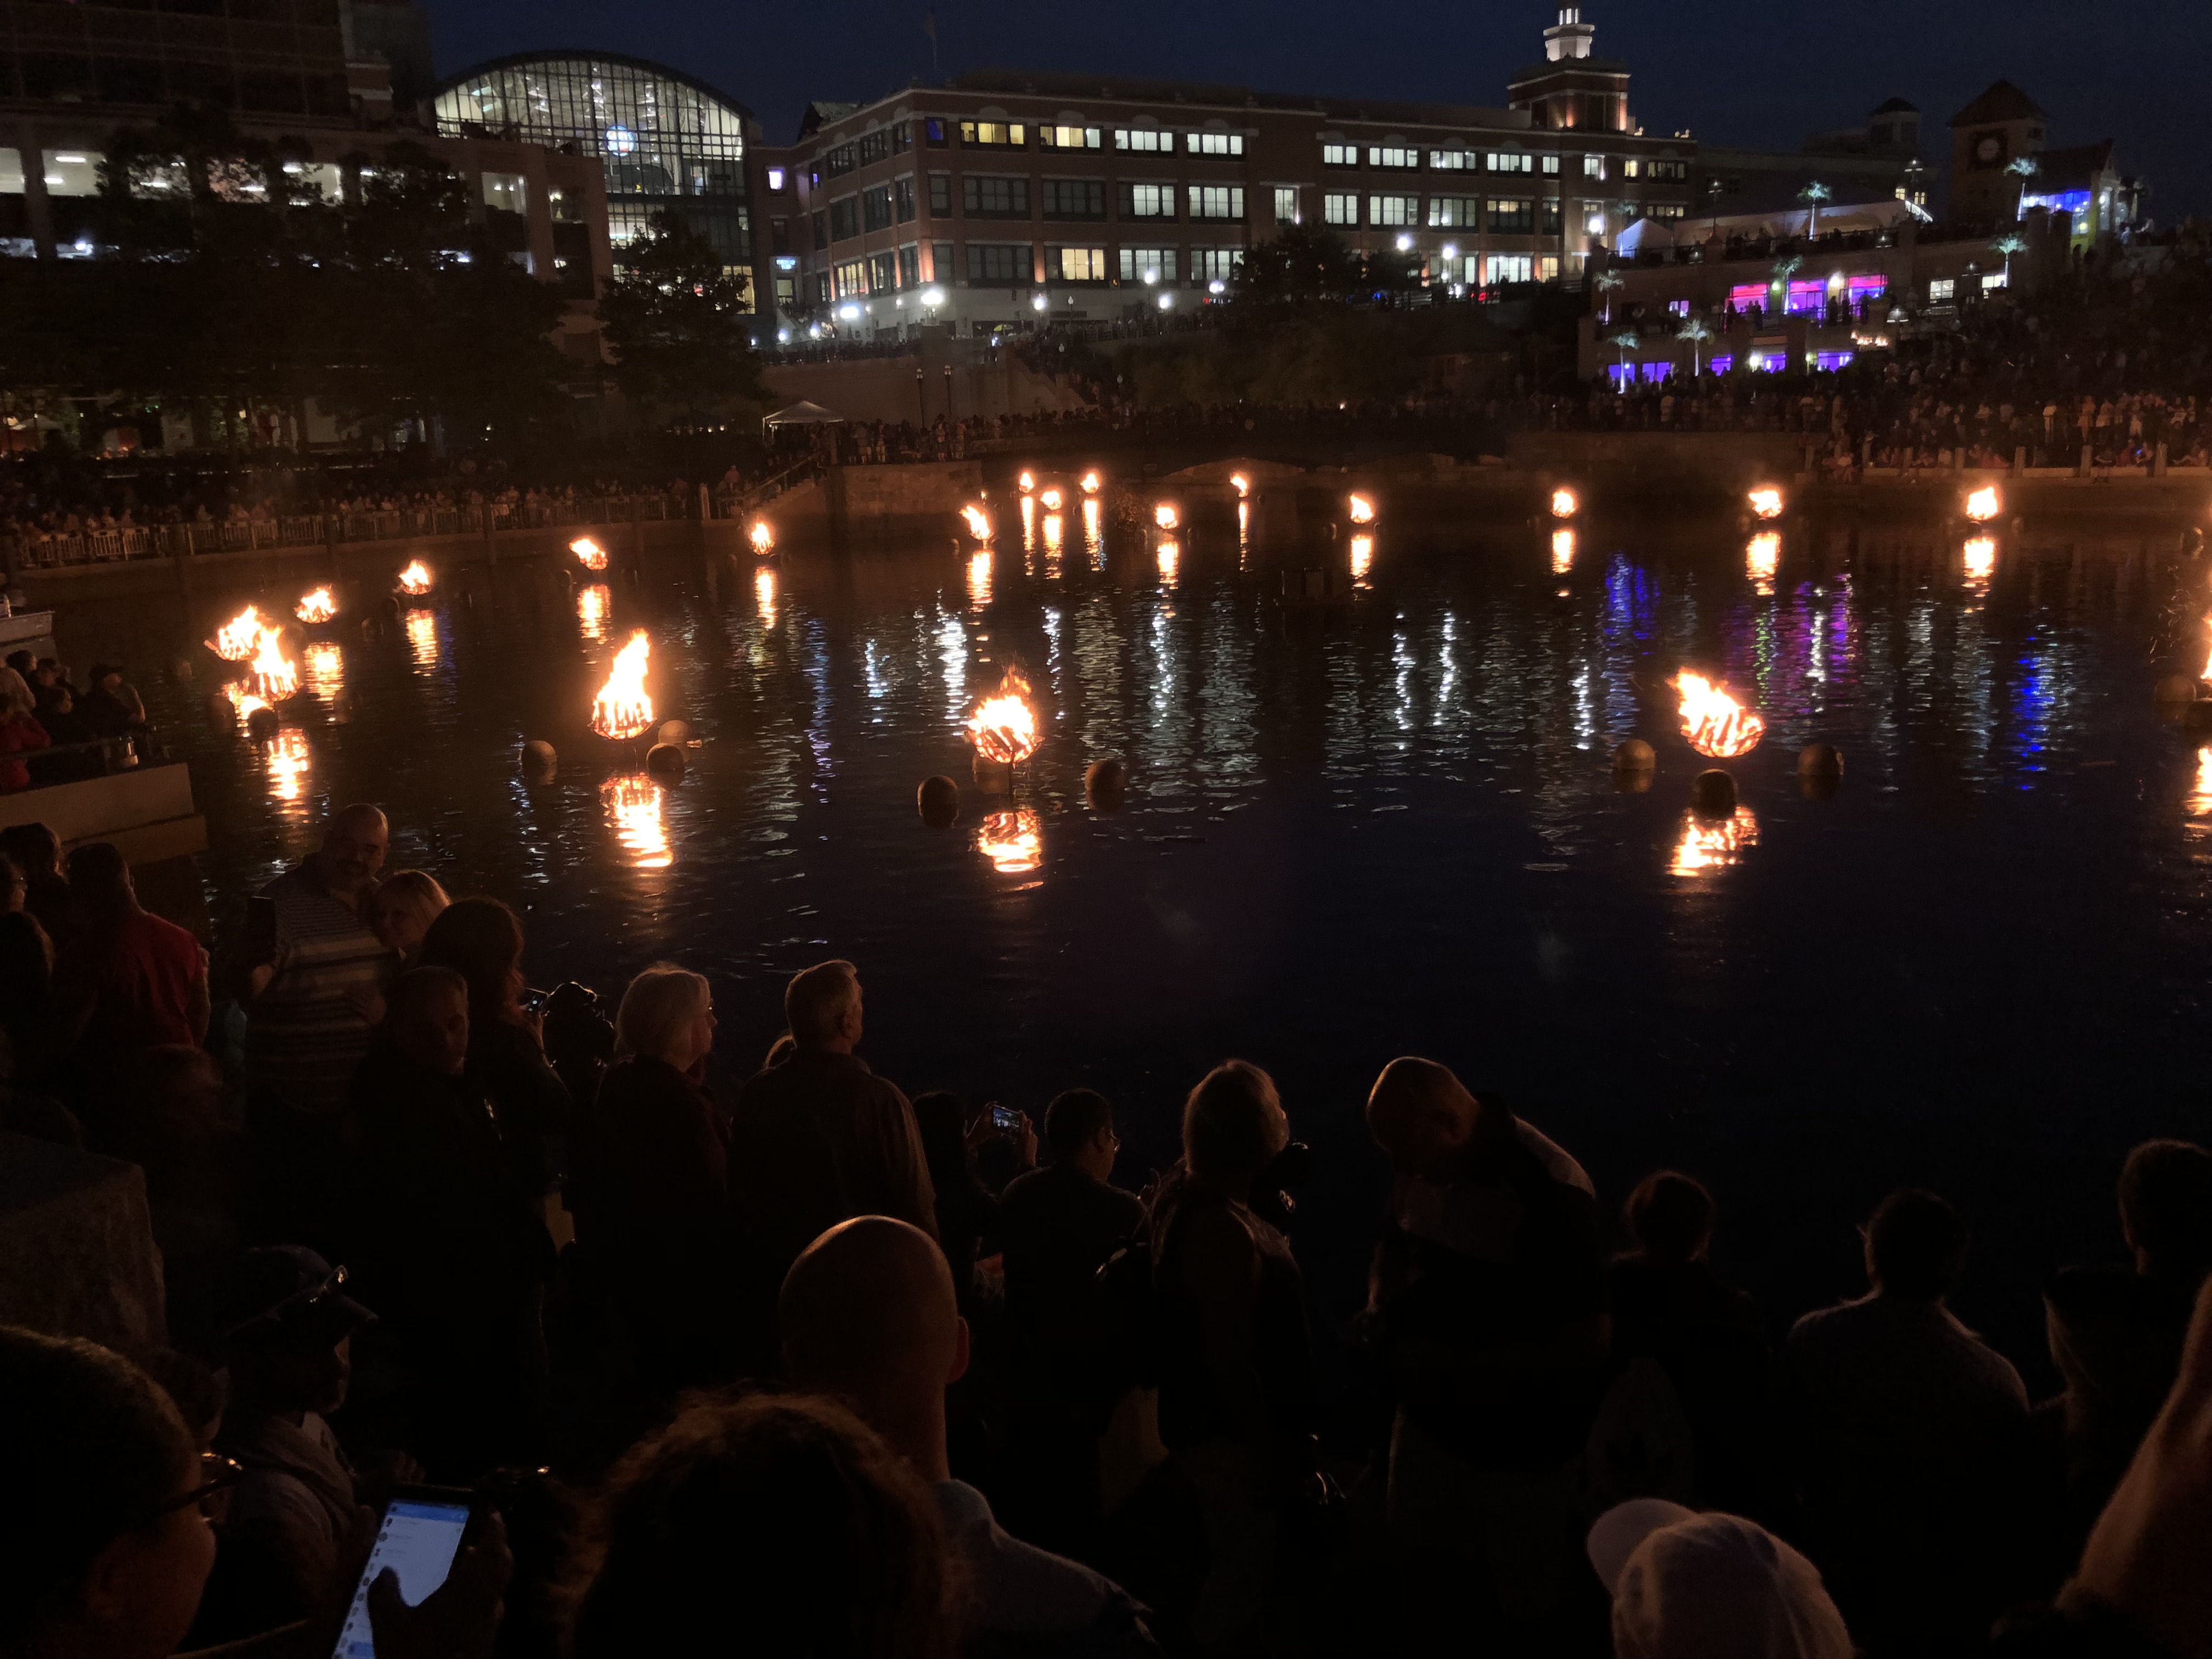
Great way to cap off a long weekend with my first ever WaterFire!
Week 3: Elevator Explanation
June 24th, 2019
This week, our assignment from IRIS was to come up with an ‘elevator speech’ about our project, a short one-minute explanation about what we are studying this summer. I didn’t think it was too hard to explain my project to someone with little seismic background, since I did not have much myself at the start of this internship. When I thought of my talk in context of explaining my project to other seismologists, I did have a harder time knowing what kind of baseline knowledge would be expected. I have a good understanding of everything I’ve done so far in my project, and the importance of what I am studying, but currently I am having a little trouble with where I will be going through this summer. I do have an overarching idea of what will come next, but I feel that I don’t have a super strong grasp on the specific things I haven’t done yet. It is hard for me to completely explain where the project will go to others when I have yet to accomplish those tasks, but I know that as I come upon new parts of the project, I will gain a better understanding through doing my work.
I found it very useful to spend some time thinking about a short explanation of my research, as I feel now that when someone asks what I am doing this summer, I can quickly explain what it is that I am studying and why the research is important/relevant.
Earlier this week there was a pizza party over lunch for all of the summer research interns and mentors in my building. It was a lot of fun to meet some of the other student researchers here this summer and take a break from work for some pizza! In my research this week, I’ve been continuing to learn how to download the data that I will be using this summer and setting up the code so that when I leave for the weekend, I can start downloading around 400 seismic events from 2014 – 2019 and hopefully it will be finished by Monday!
Week 2: Digging into the Data
June 14th, 2019
This summer I am looking at Rayleigh wave amplification with data from the US transportable array stations in Alaska. So far, I have been analyzing data that was already organized for me, which included the relative travel time and the amplitude of the waves for each station for many different earthquakes. After making some preliminary plots of the amplification throughout the region, I have decided that it will be helpful to have more data, since there is a whole year worth of data since the data set that I’m currently using was downloaded. That leads to where I am now. I am using the automated surface wave phase velocity measuring system (ASWMS) to collect the data from the IRIS database. From this I will be able to download all of the information that I will need to process to get the station locations, earthquake origins, wave amplitudes, and travel times at each station and the station names.
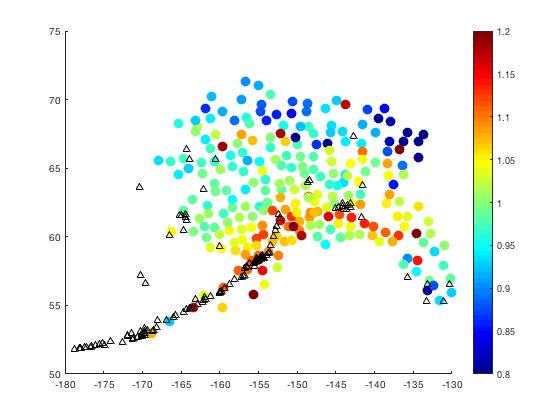
Above is a very preliminary plot that I have made of my project showing the amplification at each station. This basically is showing the effects on the amplitude that are caused by the ground directly below the station. What is really interesting is that the values are noticably different between the southern part of the state, where there is a subducting plate, from the northern part of the state. In this figure I have also plotted the location of the volcanos in the state, which are notated by the black triangles.
All of the data from the Alaska TA stations are a part of the Earth scope project, which is available for anyone to download and use. I started working with data that was already downloaded, and now I’m going back and processing my own data so I can analyze even more events.
One of the skills that I chose to work on this summer is being able to decide the next step in a research project. This is important when working on an open-ended research project such as this, as there are many decisions to make and potential directions to take the project. Being able to decide how far to take an idea, when to try something new, and being able to navigate where to go next are useful skills beyond just this project. To work on this skill this summer, I’m planning on trying to take my own ideas as far as I can before I ask for guidance on what should happen next (while still checking in and making sure that the decisions I make are on the right track). When talking about the project with my advisor, I am constantly thinking about how what we do now will set up the next few steps. I think that this helps me understand why I am doing this project, while also giving me good foresight for what will come next. This is also helpful for understanding the ultimate goals and the importance of the project as a whole.

Here is a picture of a bike trail I found this past weeked when I was out exploring the city of Providence.
Orientation/Week 1
June 10th, 2019
I’ve been here in Providence for a full week now, so I’m starting to get a handle of what it is that I’m doing and what the rest of the summer will be like. IRIS orientation in New Mexico was a blast! I learned so much and met some really awesome people. It is a lot of fun to put many of the skills I worked on there to work here on my research project.
My first week here in Providence was pretty quiet. Many people in my department were gone either at a conference in Massachusetts or a field trip in Greece. I met with my mentor on Monday, Dr. Colleen Dalton, and we talked through what I could work on the rest of the week, but after that I was really on my own until Friday. I spent lots of time reading papers and struggling through problems with MATLAB. It has been nice to have people back and around the lab, including some grad students, and other undergrad researchers.
During the past week, I spent some time thinking about some of my goals for this summer. I’ve tried to split them up into the first, middle, and final thirds of the summer.
1/3 Summer
1. Learn about seismology, my project, and geophysics
2. Learn about different fields of Earth sciences and the potential careers available
3. Explore living on my own in a new city
2/3 Summer
1. Talk to people in the fields that I may be interested in
2. Make my own decisions about what needs to happen going forward in the project
3. Explore different grad school programs that I may be interested in
3/3 Summer
1. Submit AGU abstract
2. Be ready to continue with my project into the fall for my senior paper
3. Be prepared to apply for grad schools this next year and know what I want to do
Overall, I am excited to really dig into this project, work on my skills as a researcher, learn all about this field of seismology which is very new to me, and ultimately present my research at a national conference.
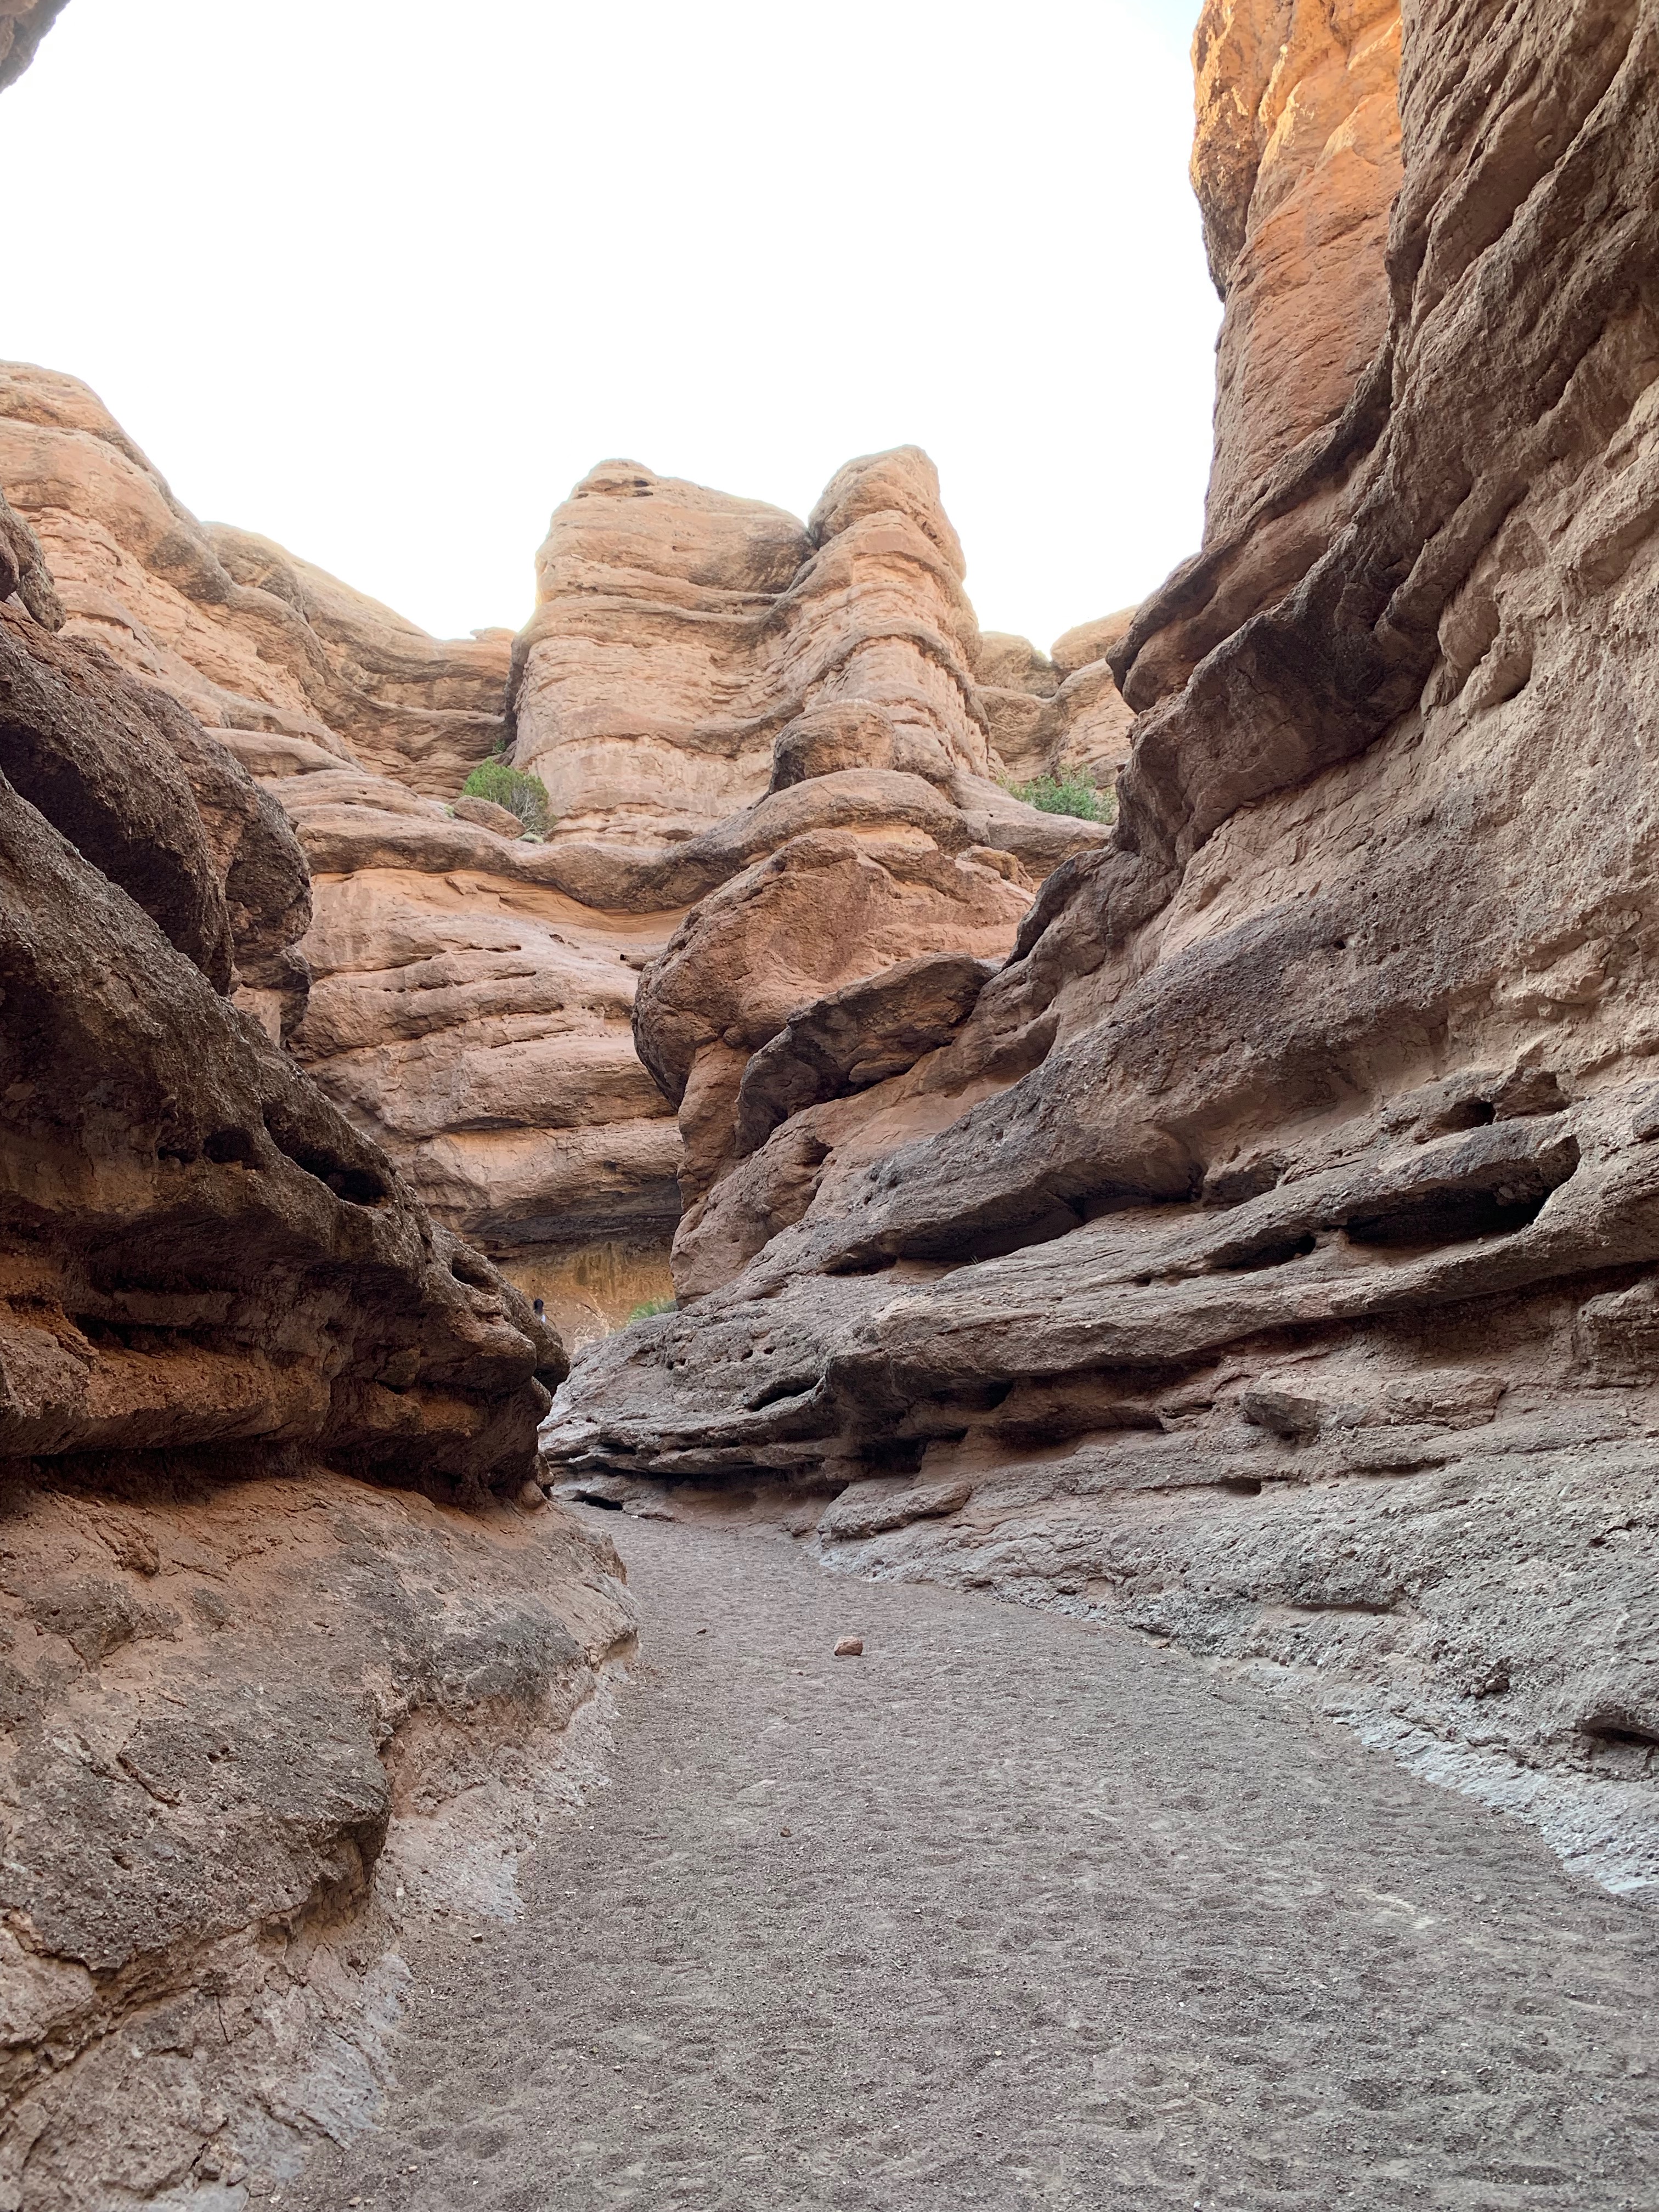
On our last night at orientation, we had a cook out and camp fire in the San Lorenzo Canyon (pictured here).


