Liam
Liam is a student at Western Washington University currently completing his research at Universtiy of Rochester under Dr. Tolulope Olugboji.
This summer I will be working with Dr. Tolulope Olugboji at the University of Rochester. Seismic waves that convert phase at a boundary, P to S for example, are frequently used to image the lithosphere. However, there is worry that reverberations from within the crust impact these conversions. I will be utilizing receiver functions and a tX stacking technique on all satisfactory seismic stations across Africa in order to identify and catalog reverberations. By improving our understanding of crustal reverberations we will be better enabled to examine lithospheric discontinuities, such as the Mid-Lithosphere Discontinuity (MLD).
Week 9: My Final Blog
August 21st, 2019
With much fanfare this summer has come to a close. The opportunity to work (mostly) undistracted on a project all day and everyday has been an incredible experience. It’s great to look back at the original description and realize that I actually fully understand what things like “reverberations from with in the crustal column” and “phase-weighted R-Vp stacking” mean now.
Nine week ago I set goals for the summer. Let’s reflect on how they went!
- Gain a better understanding of the physical and geologic motivations of my project - yep, happened somewhat naturally as I continued to read papers throughout the internship.
- Rapidly improve my MATLAB and UNIX abilities - definitely, hours of coding in MATLAB really improved my understanding and technical abilities.
- Gain (some) of the necessary language to discuss and self-teach about high performance computing - I generally moved in the right direction on this. However, I was definitely selective in only trying to understand aspects that were most pertinent to my project.
- Get my hands on a bike (call around to local bike shops about rentals) - Done, rented a bike and took a ride around Monroe County.
- Plan one or two weekend/day trips out of Rochester during the Internship - Spent a weekend in Toronto and visited lots of the nearby state parks!
In addition I laid out goals related to completing the AGU abstract, giving a research talk here at the University of Rochester, and completing workflows for analyzing a single seismic station and all the stations in my region. I am happy to report that I successfully completed all of those. However, as with most things, there is always more that can be done. We still have ongoing work and exciting paths of investigation that for the moment will have to remain unwalked.
In this last blog I want to thank first and foremost my advisor Dr. Tolulope Olugboji. He was unfailing available for assistance, advice, and feedback throughout the summer. Then in no particular order: Trey and Yingping for keeping me company, Michael Hubenthal for the orientation, webinars, and all the IRIS organization and logistics, the Kearns Center, Sergio Allen, and George McCormick for supporting me at the University of Rochester, and finally everyone who helped me apply and encouraged me to do so. I am extremely grateful to have had the opportunity to participate in the IRIS Internship program.
Week 8: The Birdies Leave the Nest
August 10th, 2019
This past week I said goodbye to my fellow intern Trey as well as our labmate Yingping. While it's sad to see them go, here at UR Seismology we are very proud that they have spread their wings and left the nest. With their departure my responsibilities have increased tremendously. I am now the sole caretaker of our lab plants. Hopefully I am up to the challenge.
Related to work, in the past few days I have been able to clean up and streamline a lot of the code I have written this summer. From each function I was able to create new single workflow. By workflow I refer to the steps it takes to process the raw seismic data and extract from it the information we are looking for. It feels good to know that our code is well organized and up to date. Seeing it all in one place has made me realize how much work and material Trey and I have produced in the last 9 or so weeks. As an added bonus the new workflow has greatly increased my efficiency at testing different processing techniques. These techniques aim to improve the clarity of our results. All very exciting stuff!
This weekend I made the drive to Vermont to visit family. My drive from upstate New York took me through the Adirondacks a part of this country that I have never been in before. I wish I had had more time to stop and maybe go on a hike or two. That being said, I’m coming up on my last week in Rochester! It’s been an excellent experience and I am sad that it is coming to and end.
I wish my extensive readership good health and an excellent rest of your weekend!
Week 7: Final Presentations
August 4th, 2019
It has been a very busy two weeks. Last monday Trey and I had our “final presentations” during the Kearns Center Research Symposium. The Kearns Center supports summer researchers here at the University of Rochester. I put the quotation marks on “final presentation” because I actually had three more weeks of research left when I gave the talk. Both of our talks were 15 minutes long. It wasn’t the easiest presentation to prepare. I had to figure out a way to balance actually speaking to my research while providing enough background so that more than just the two other seismologists in the room could understand. In addition to that we submitted our AGU abstracts on Wednesday! All in all we spent a lot of time preparing for both of those things as well as trying to push our research forward simultaneously.
One of the most challenging and yet exciting aspects of this summer has been realizing what it takes to work on problems that don’t have obvious or straightforward answers. At school when you are working on an assignment there frequently exists a “correct” answer. There is comfort in this. This summer that comfort was yanked away. When I started getting my first results they were at times significantly different from the existing literature. Under this circumstance, how do you convince yourself that your results are accurate and not just a bug in your code or some other mistake? This requires a mentality shift and significant level of confidence in your own abilities. It has been rewarding to work on this this summer.
However, it hasn't been all work. Trey, Yingping, and I have been keeping up our journeys around the greater Rochester region. Last weekend our we went to Stonybrook Brook State park and spent a few hours frolicking under some waterfalls.
Week Five!
July 21st, 2019
Week five has come and gone. The next two weeks are going to be very busy for our lab. Our AGU abstracts and final presentations for the University of Rochester's Summer Symposium are due next week!
As hard as it is to admit to my loyal readership, I must share that the research I have done over the past five weeks has not solely been built on my scholarly merit. Google scholar constantly reminds us to “stand on the shoulders of giants”. In my case these giants are M.G. Bostock and M. Ravi Kumar. In 2010 they published a follow-up (to a 2008 paper they wrote) paper entitled “Bias in seismic estimates of crustal properties”. In the paper the authors develop a bias free method to calculate p-wave speed, ratio of p-wave to s-wave speed, and crustal thickness underneath a seismometer from a receiver function. First arriving seismic waves reflect up and down between the free surface of the earth and the crust. These reflections show up on a receiver function as “bands of energy” arriving to a seismometer at a specific time. In theory, these bands are largest signals on the receiver function. If we know p-wave speed, s-wave speed, and crustal thickness then we should be able to predict at what times these bands would show up on the receiver function. In reverse if we know the band arrival times then we could constrain and estimate these values. Kumar and Bostock suggest a grid-search methodology that scans over different combinations of p-wave speed, ratio of p-wave to s-wave speed, and crustal thickness. For each combination the “bands” in the receiver function are summed at the calculated time given by the values. The best combination should be the one that results in the highest sum since a large sum implies that the high energy reflections were correctly identified. Most importantly, this method does not need the scientist to assume a p-wave velocity from another model. This helps detach our results from previous assumptions and studies.
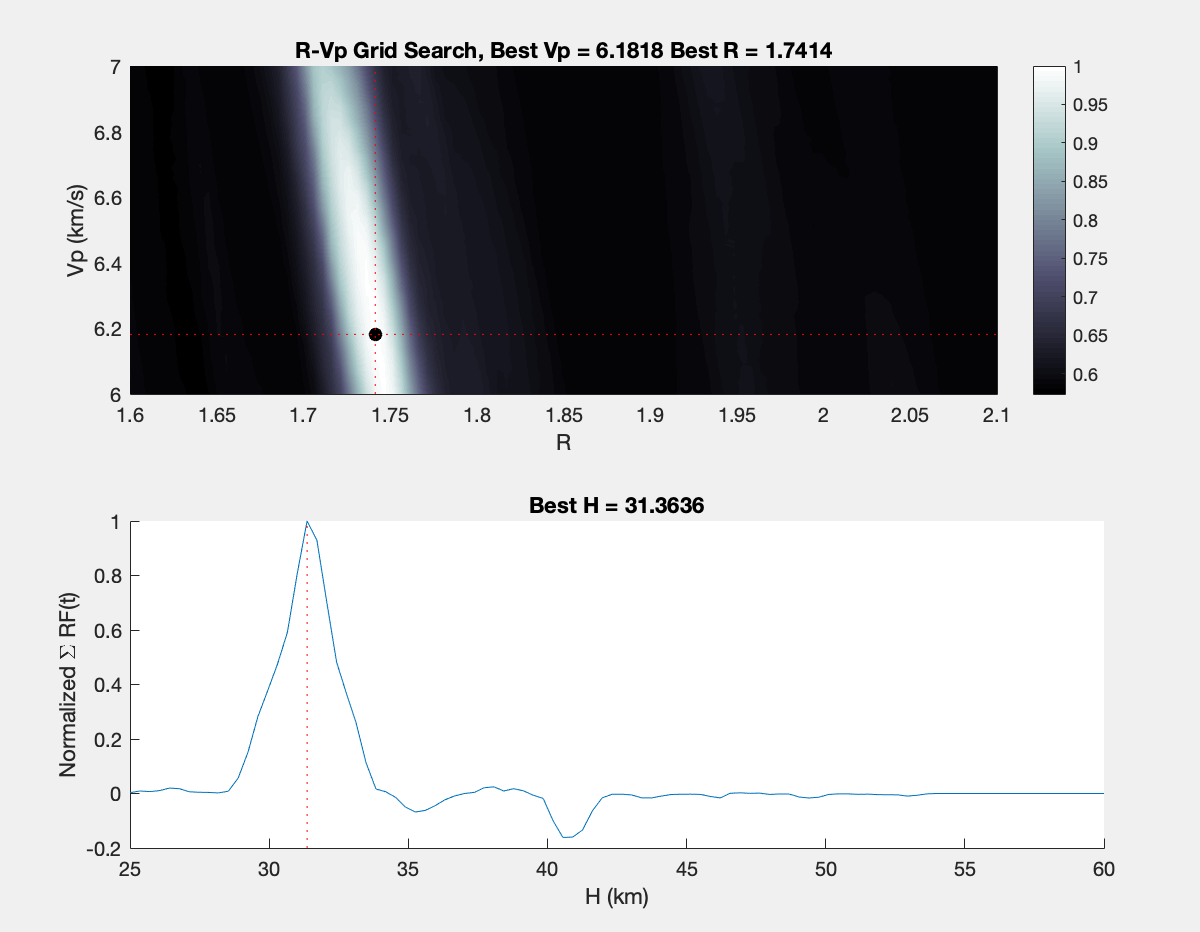
Below I have shared a plot that I have generated using this technique. The plot shows the 2-D and 1-D grid search for crustal parameters under a single station. The global maxima identify the best parameters! R is wave speed ration, Vp is p-wave speed, and H is crustal thickness. This figure identifies that under this station the crust is ~31 km with a p-wave speed of ~6.2 and an s to p s wave speed ration of ~1.7.
Thanks for reading.
Week four: High points, low points, and a map
July 14th, 2019
My biggest frustration so far is that I wish there were simply more hours in the day. Not just any hours, but the hours in which Matlab and I are in perfect harmony, where bug free code flows like cool water out of an artesian spring. In all seriousness, I have had to reflect in quite a few instances on whether I am focusing my time on the most important task at hand. If I spend too many hours trying to debug, perfect, or generalize a function that isn’t that important then I will have no energy left to read papers or work on aspects of my code that have larger impacts on my results. With respect to understanding background literature, it has been difficult to draw a line between what I must know now to succeed at this internship and what I am ok not fully understanding for the time being. This is something I am still working on!
That being said, my biggest high point occurred this past week when Trey and I have began generating and refining our receiver functions! We were able to check that our generated functions were (on visual inspection) quite similar to those previously published! While we still have quite aways to go I am heartened by these results and quite proud of the work we have done and the chunk of code we have written for the lab.
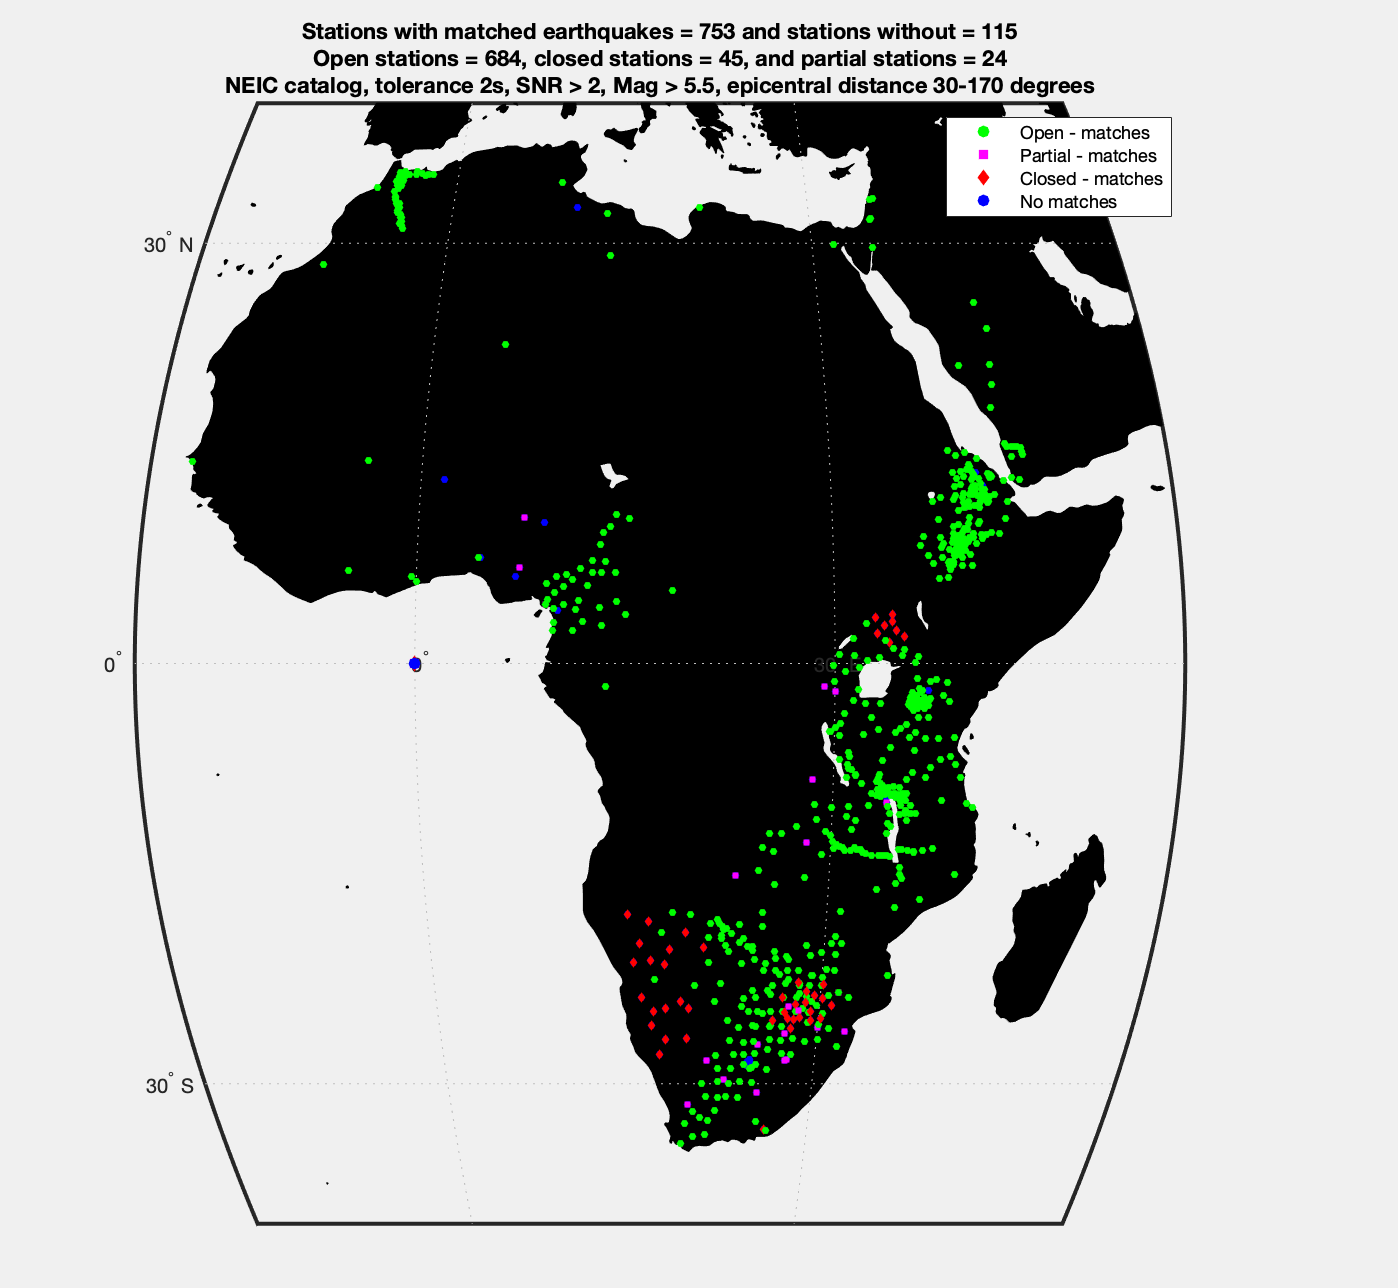
Below is a station map of my study region (really an entire continent). I made this map using Matlab’s mapping toolbox. This map shows a marker for every station (on land) that is currently stored in the clutches of IRIS’s data management center. This map is the result of one aspect of the data-quality analysis that I have been working on for the past few weeks. One important focus of my project is to use receiver functions to estimate the thickness of the earth’s crust across the African continent. However, receiver functions only provide an estimate of this depth directly below the station being analyzed. The goal of this map is to give geographic sense to where we will (potentially) be able to see into the earth’s crust.
On the map there are four possible station types. First, blue dots are stations that did not detect any earthquakes in the magnitude or location ranges that we are looking for. Second, the red diamonds are stations that are closed. This means that for a period of time the data is restricted. This embargo is usually lifted once the group that installed the station publishes with the collected data. Third, a pink square means I am only partially able access to the seismic data of the station. Finally, all of the green dots are stations that detected ideal earthquakes and stations that we can access the seismic data on. However, just because a station is green doesn’t mean it will make a good receiver function :( . I have generated some other plots and metrics that try to quantify a stations ability to generate reliable information about the crust. That being said, the proof is in the pudding. As I write this the University of Rochester’s computer cluster is cranking out the receiver functions that hold my fate...
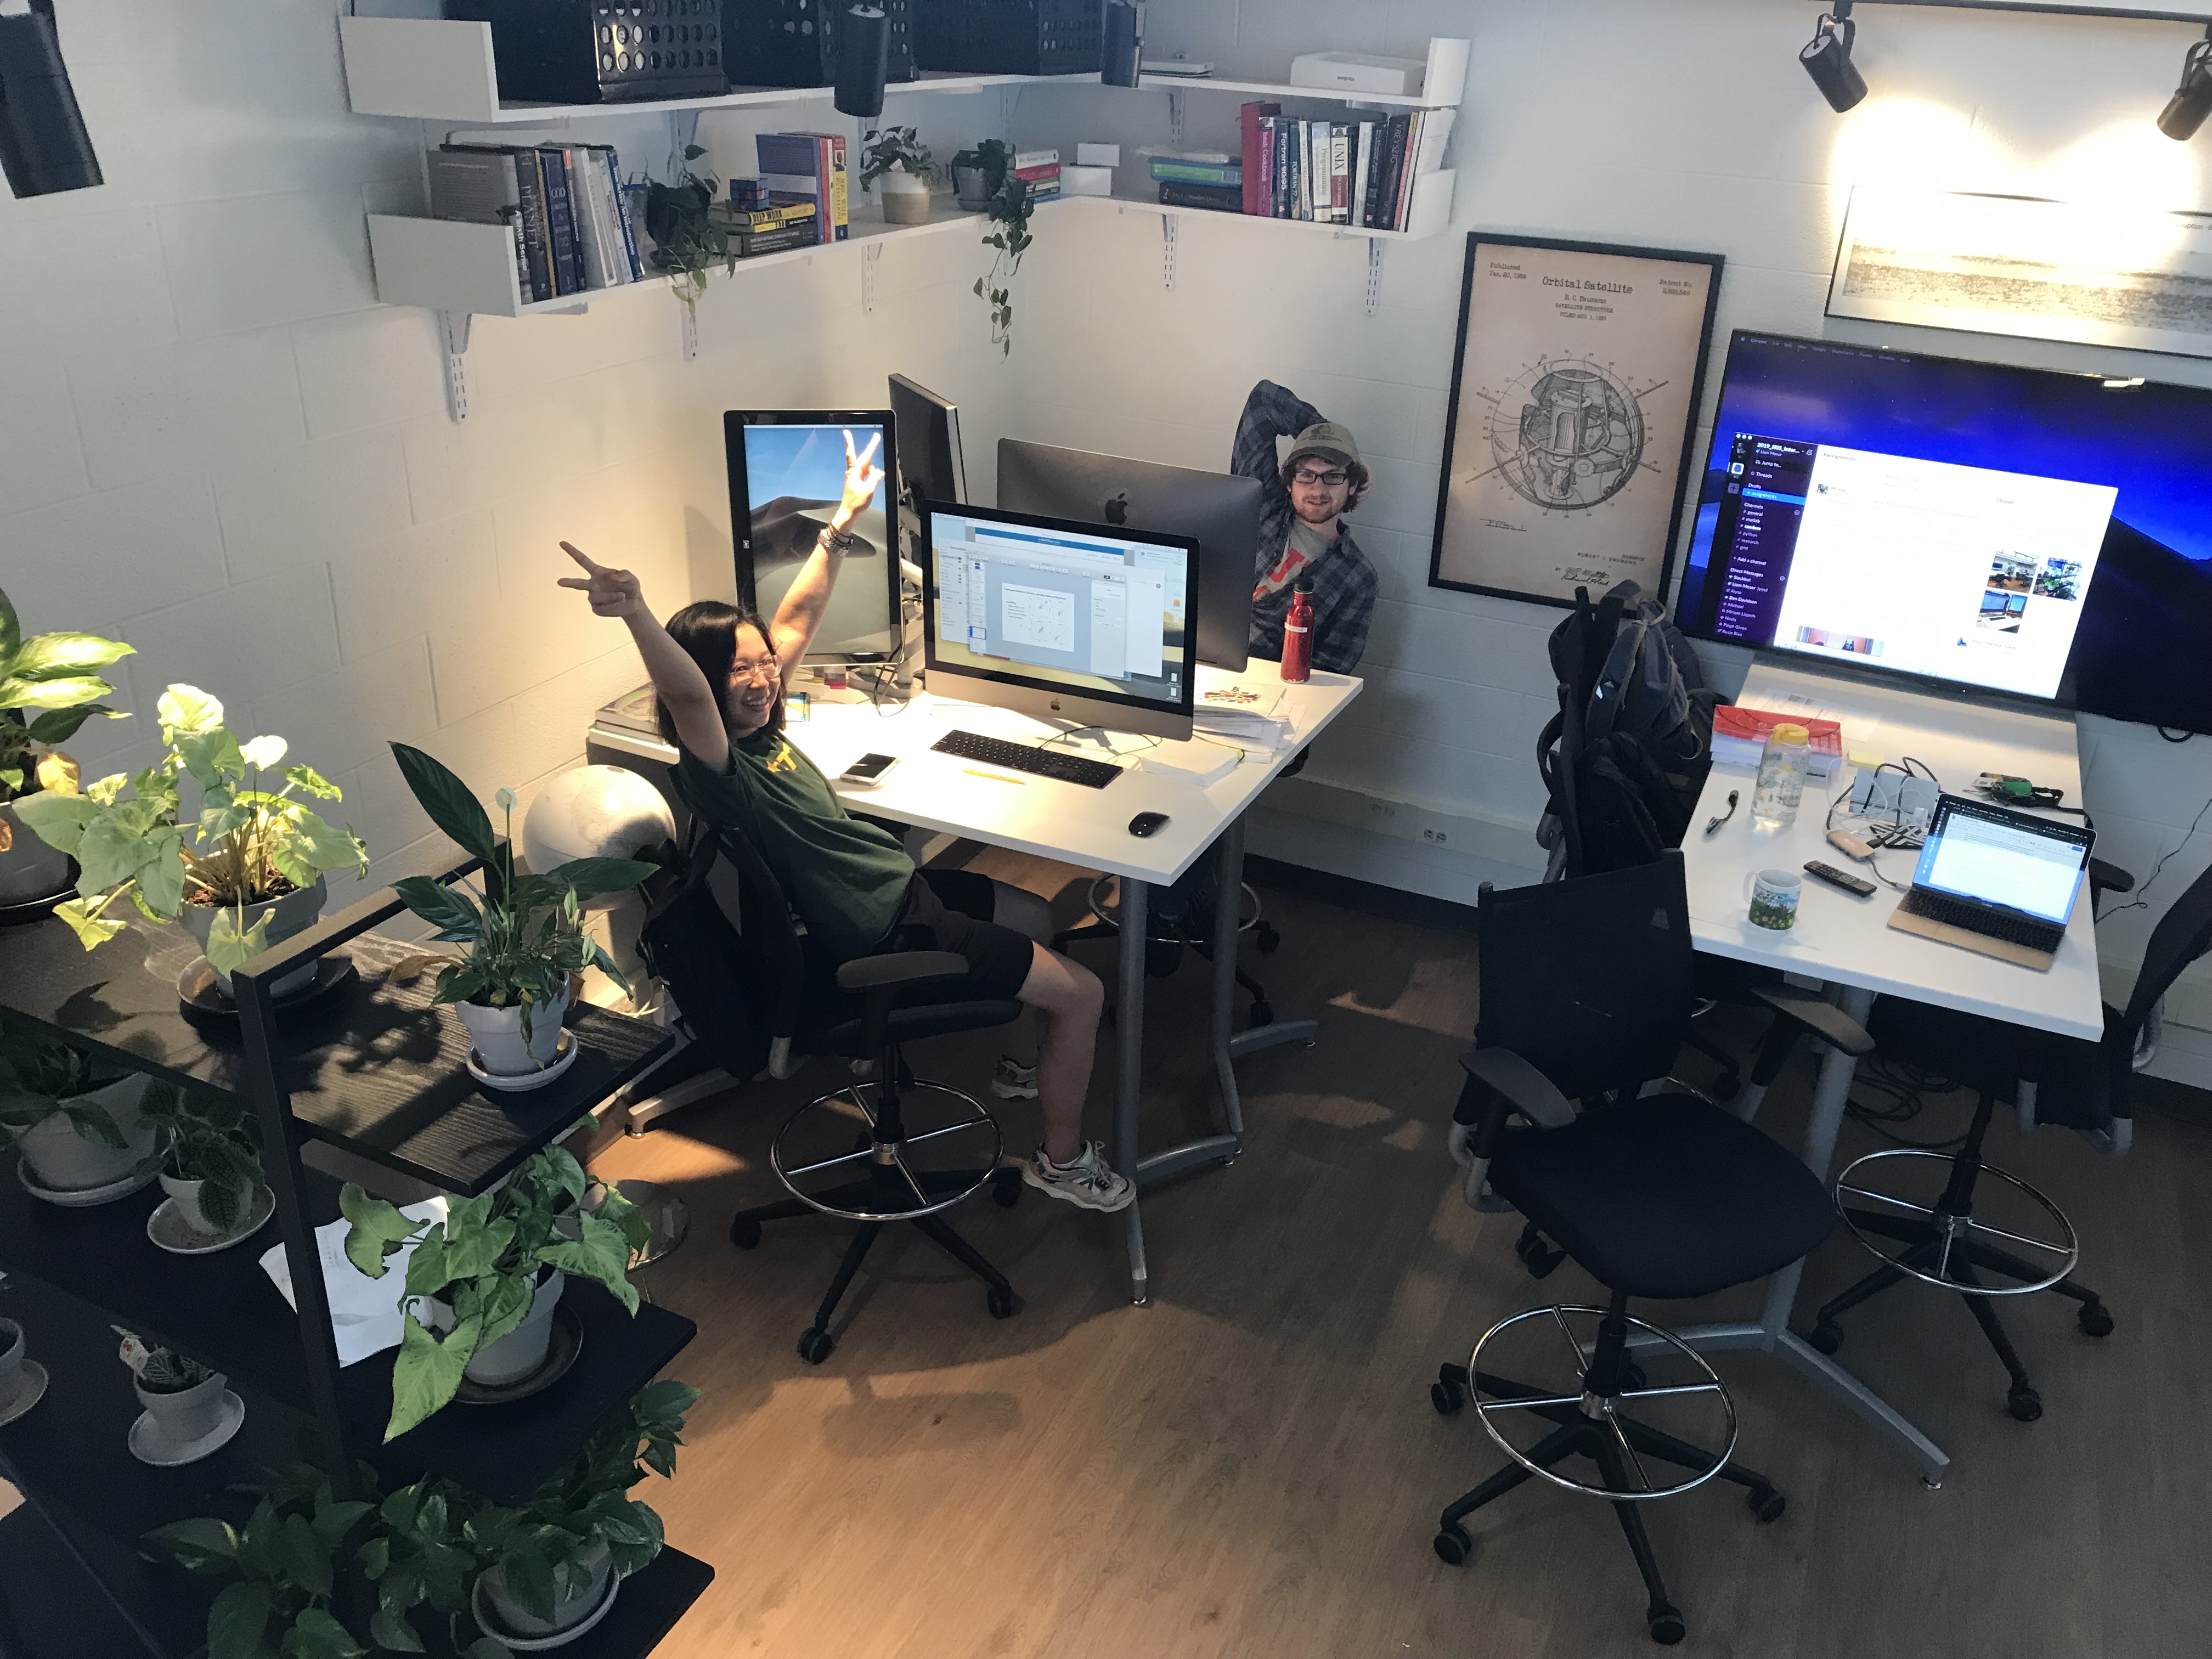
As an advertisement to come work for Dr. Olugboji I have included a picture of us having at great time in the new lab space!
Week 3: We Visit the Big City
July 8th, 2019
Last week was a short week as our lab took Thursday and Friday off for vacation. My advisor, Dr. Olugboji, went backpacking and so Trey, Yingping and I (our lab group) took a trip to Toronto for the long weekend.
Last week, in addition to giving my first research update presentation, I spent many long and arduous hours perfecting my elevator speech. The goal is to be able to deliver the core message of my summer research in sixty seconds or less. I sculpted two versions: a technical one for a scientific audience and more general one for any interested party. I found writing the latter to be easier. I felt as though I could be more relaxed/casual with the way I talk about my research. Knowing that who I was talking to had no preconceptions allowed me to build an explanation of my research from the ground up. I did not have to worry that I was over explaining topics that were either obvious or simple. I think with the elevator speech targeted at a more technical audience I was concerned about whether I was hitting on the most important parts of my research. The best thing I can do to remedy this is to run my speech by my advisor. He should be able to give me succinct feedback on whether, from the point of view of an expert, I am capturing the essence of my project.
At the end of July we have a poster and presentation session here at the University of Rochester. I think that it will provide an excellent opportunity for me to dust off my elevator speech and give it a whirl.
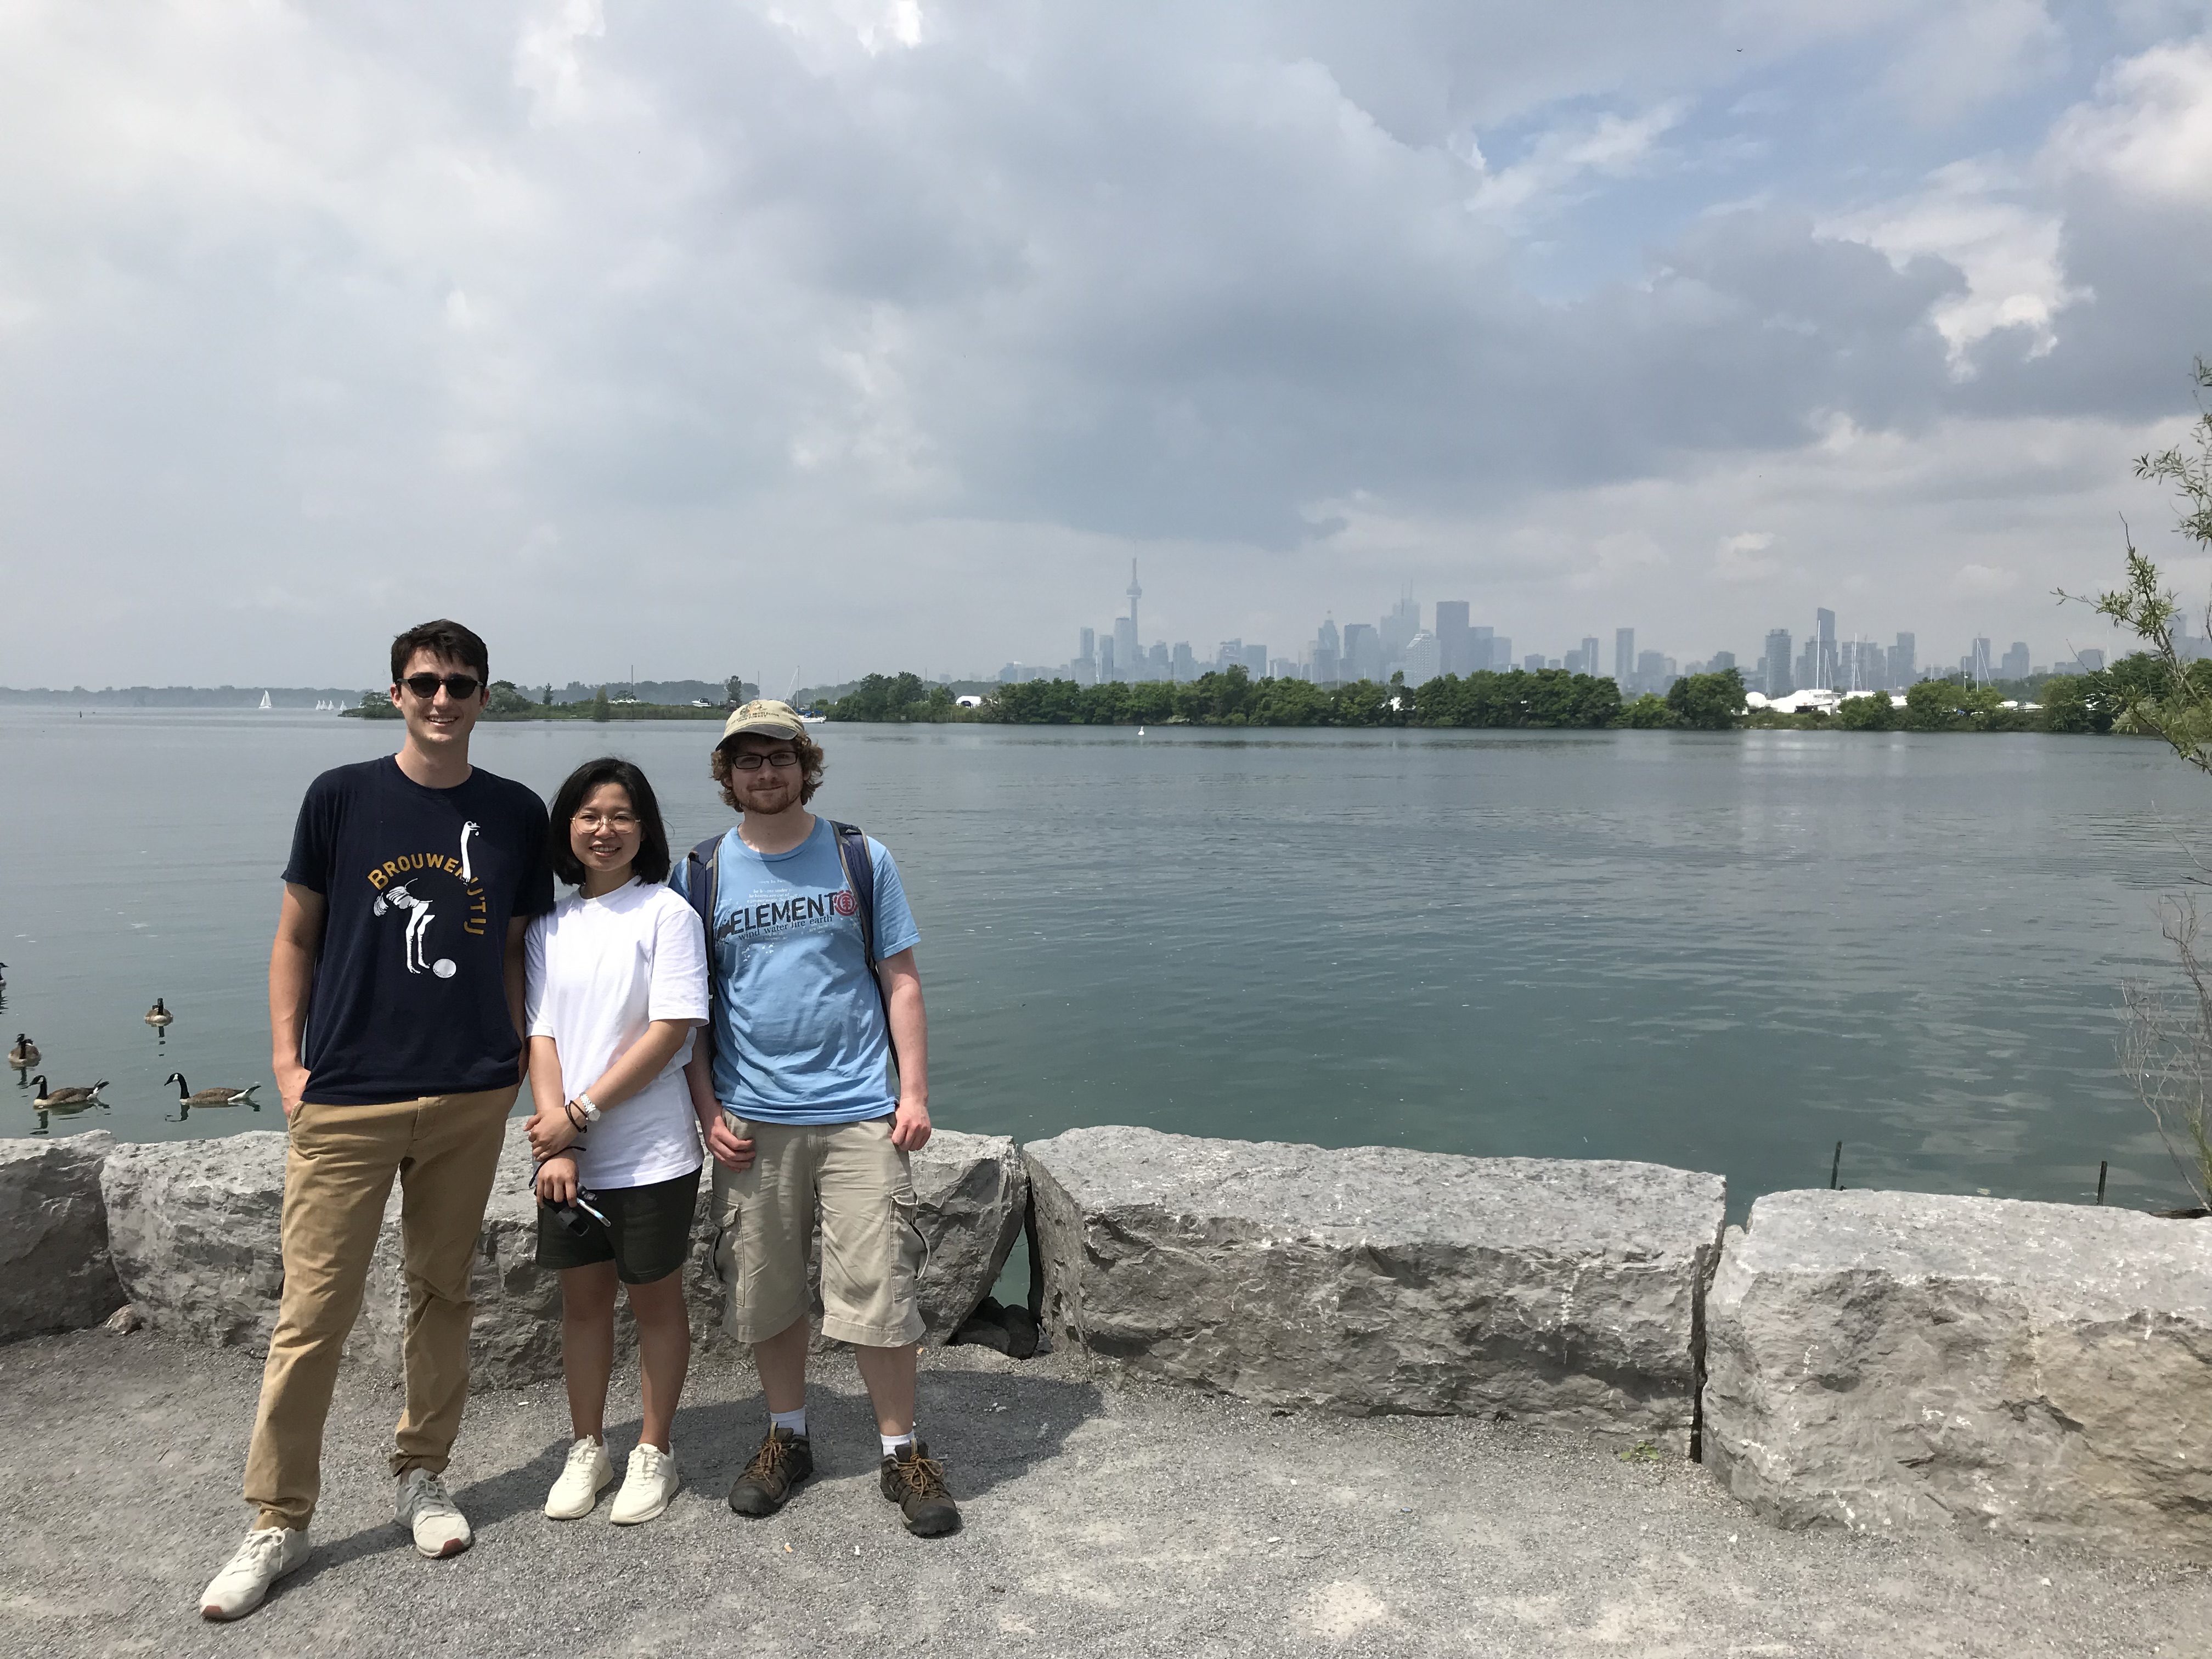
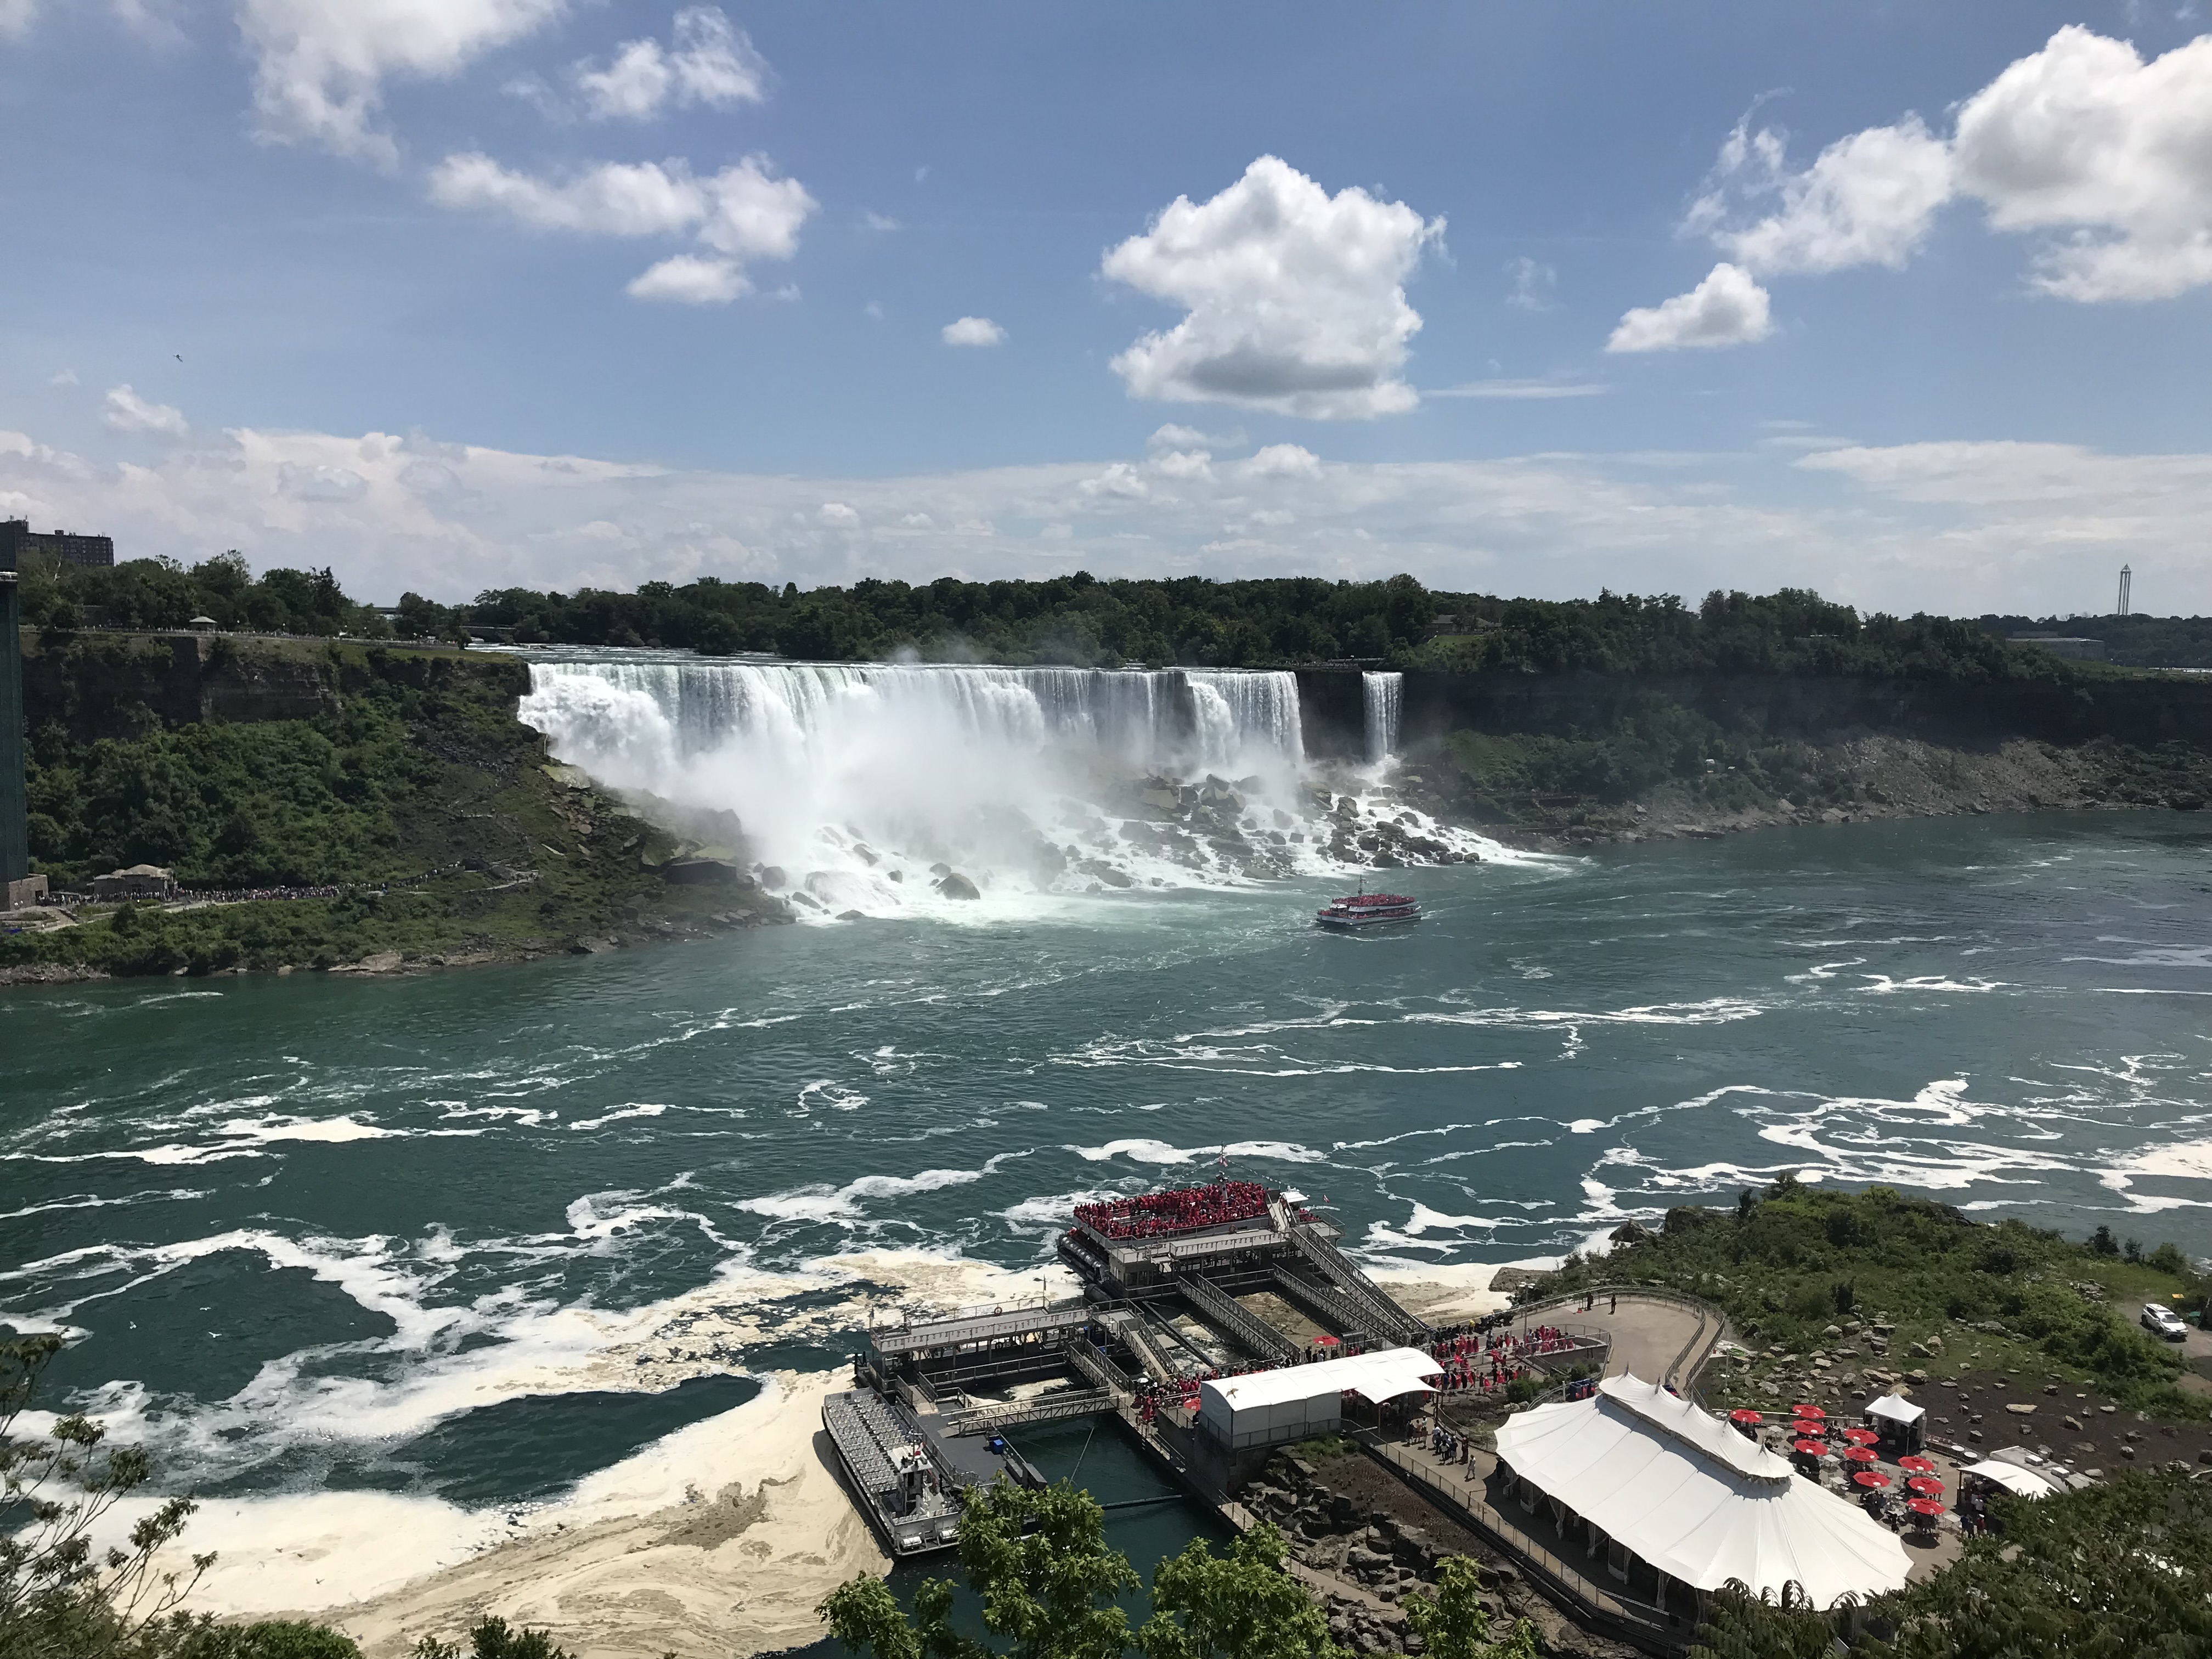
Here are some photos from last weekend! The first is our group at Tommy Thosmpson park in Toronto and the second is at Niagara falls.
Until next time.
Week 2: Data sources!
June 30th, 2019
The two main data sources I am using are the International Seismological Center‘s (ISC) event catalog and the International Federation of Digital Seismograph Networks (FDSN) metadata holdings. I access both databases via either the Matlab library irisFetch or the MUSTANG data browser. Both of these data sources are widely used and the data has already been processed and organized by IRIS.
For my project I am using as much seismic data from the African continent as humanly possible. The data collection process begins by retrieving station information in a rectangular geographic region that I designate. Then I collect every event that that station has detected over a signal-to-noise ratio of 2. For each station I then download every earthquake above a magnitude of 5.5 that occurred at a certain distance range while the station was operating. By accounting for the travel time of the P-wave we are able to assign the events detected at each station to an earthquake. The whole point of this is that we are able to analyze the stations “coverage”. Better coverage means more earthquakes at many different azimuths relative to the station. This makes our calculation of crustal depth more accurate and stable.
Given its curation the data so far seems to be fine. However, as my project continues to progress I might find it inadequate to run some of the analysis I am hoping to do...
During the IRIS orientation we were given a list of skills pertinent to scientific research and we were asked to self-reflect on our ability level for each skill. Under the category of Data Collection the skill “use software and technology to obtain or collect data” was given. In the first two weeks of my internship this has been the skill that I hands down have developed the most. For me this means understanding the different sources of seismic data/information and how you can retrieve them. It also means having the programming ability to process and analyze the data effectively. In the context of my project it means understanding the geographic scope of the above mentioned event catalogs as well as how once can effectively access the data in a few lines of code.
Last weekend I rented a road bike and went on a ride around county!
Until next week.

Week 1: Hitting the Ground Running
June 22nd, 2019
I have been in Rochester for six days now! I am in a unique situation where there are two Interns at my placement (Hi Trey!). The first parts of both of our projects involve the same data processing methodology. However since Trey started out two weeks before me he quickly brought me up to speed to where he was. We spent most of the week “pair programming” the same code in MATLAB.
The University of Rochester campus is beautiful and is located right on the banks of the Genesee River. There is a river trail and many connected parks that I have been running in most days.
Here are my goals for the Internship...
First Third Goals:
- Gain a better understanding of the physical and geologic motivations of my project (read all references and project background material)
- Rapidly improve my MATLAB and UNIX abilities (actively take notes where my adivsor help with debugging or scripting)
- Gain (some) of the necessary language to discuss and self-teach about high performance computing
- Get my hands on a bike (call around to local bike shops about rentals)
- Plan one or two weekend/day trips out of Rochester during the Internship
Second Third Goals:
- Run workflow for a single station
- Run workflow for all stations
- Begin analysis of results and work on effectively visualizing the data!
Final Third Goals:
- Continue analysis and data visualization
- Present project at Kearns Center Event
- Submit AGU abstract
In this writing these up I realize I need to better specifiy my second and final third goals! Since there was already an intern here it was really easy to just jump into where he was at. I realize now that its important for me to take a step back and evaluate my indiviaul trajectory for the next 8 weeks!


