Steve
Steve is a student at University of Wisconsin-River Falls currently completing his research at Boise State University under Lee Liberty.
Use active Source seismology to not only map the Seattle fault with relationship to downtown But also measure shear wave velocities within the upper 30 meters of ground. Using the measured shear wave velocities will help constrain areas that are at the most risk in the event of an earthquake.
Week 9
August 4th, 2019
Finally submitted my abstract to AGU! It came down to the wire as I expected it to, but it was still stressful. Now that it is finally submitted, I can focus on data processing and getting my Vs30 measurements.
At this point in the summer its finally winding down and I still have 3 weeks left to go but I have learned a lot especially lately as I have been playing around with MATLAB more and more. I even wrote some of my own scripts for processing data outputs! As I was building these scripts it was nice to know that much of my previous knowledge of Java programming came in handy. Just knowing how to handle for loops and if statements was a huge help.
As far as things I have been able to achieve this summer, I have a good understanding of the fieldwork necessary for seismic surveys and the wide variety of conclusions you can draw from them. My goals over the summer have evolved from understanding fieldwork to understanding the seismic concepts behind the fieldwork. As of late, I still feel like I am only scratching the surface and there are still many concepts that I need to learn or get a full grasp of. I still have 3 weeks here and that should be more than enough time for me to help fill in those holes.
I will add some images of my data processing later
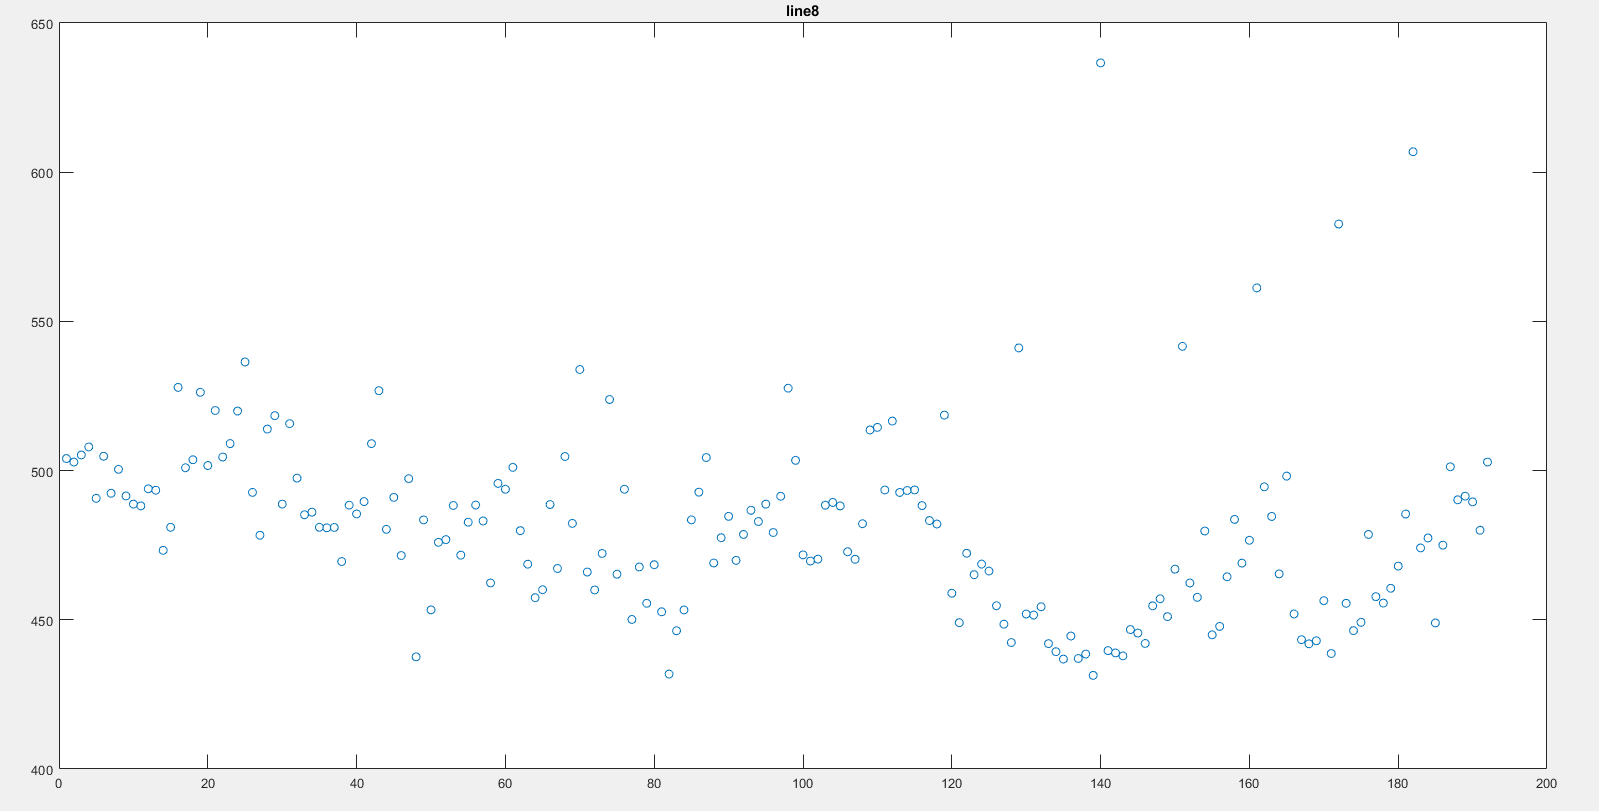
Edit: here are some images of the data processing I promised!
Dispersion picking!
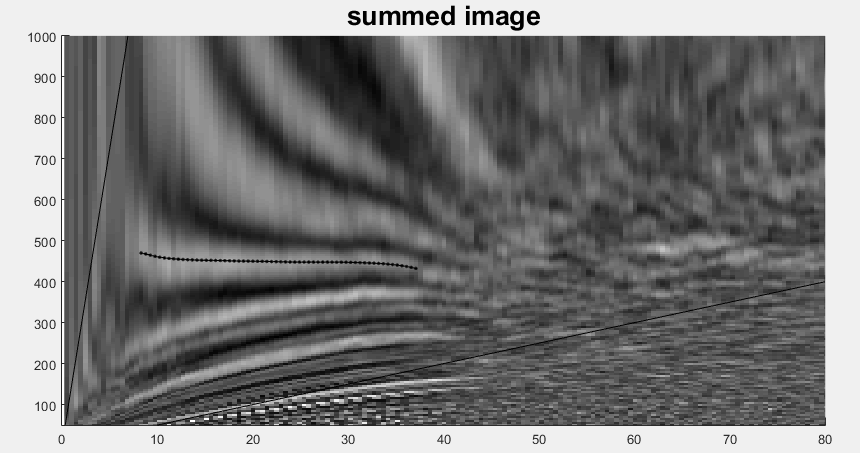
Here is one of the finished VS30 plots
Week 7
July 22nd, 2019
I spent most of this week doing fieldwork in Seattle gathering active seismic data.
It was a completely different experience from my fieldwork in Colorado for several reasons. First, is that it’s a major city we had to constantly work around cars and other people. But in addition to that, we also had a lot of people come up to us and ask us what we were doing. Some of them had no idea about how seismic worked so explaining that was a bit of a challenge. However, most people were interested to see what our research would reveal about the danger the fault poses to Seattle and would often ask where they could find the results of our study. While I could tell them exactly when we would publish out results I was told that anything relevant would most likely be published in a follow-up article by the Seattle Times as they had already published an article on the groups conducting research in Seattle. It was nice to see that the general public was interested in finding out about the results of the research I was conducting and really drove home that this project that I am apart of has not only academic importance but social impacts as well.
Now that I have finally acquired data, I will finally start to really get into the body of my project and start to crank out some results. Thankfully at this point, I have learned much of the software that I will need to use to analyze my data and get the VS30 data.
Now, as for the journey, I have gone on to get to this point where I finally have data in hand. I have had a few hurdles to overcome to get here and some of them I will still be working on as the summer progresses. The first major one that I would like to point out is learning to work in a Linux environment. This was something that was completely new to me and is still a skill that I am working on. There are a lot of different commands and syntax to remember. I always have the list of commands up on my second screen when I am working in Linux so I don’t have to waste a bunch of time looking them up. I am slowly getting better at remembering them, but patience and practice is the key to becoming proficient at tasks like these. Luckily, I have both, and the progress is steady thanks to this. By the end of the summer, I hope to be able to use Linux without the command list open in another window.
Another challenge that I am also still working on is understanding fully how the inversion software works and some of the math behind it. As of right now, I have a fairly good grasp of what it is doing but I feel like I only have a surficial understanding of it at this time. This is mainly because I have only just started using the software and haven’t had much time to ask the relevant questions about it. I’m sure that as I use it more and ask questions I will come to a better understanding.
Welp, that’s my blog for this week, Later tomorrow I will upload a few images of our fieldwork in Seattle when my internet connection is better.
EDIT: here are the pictures
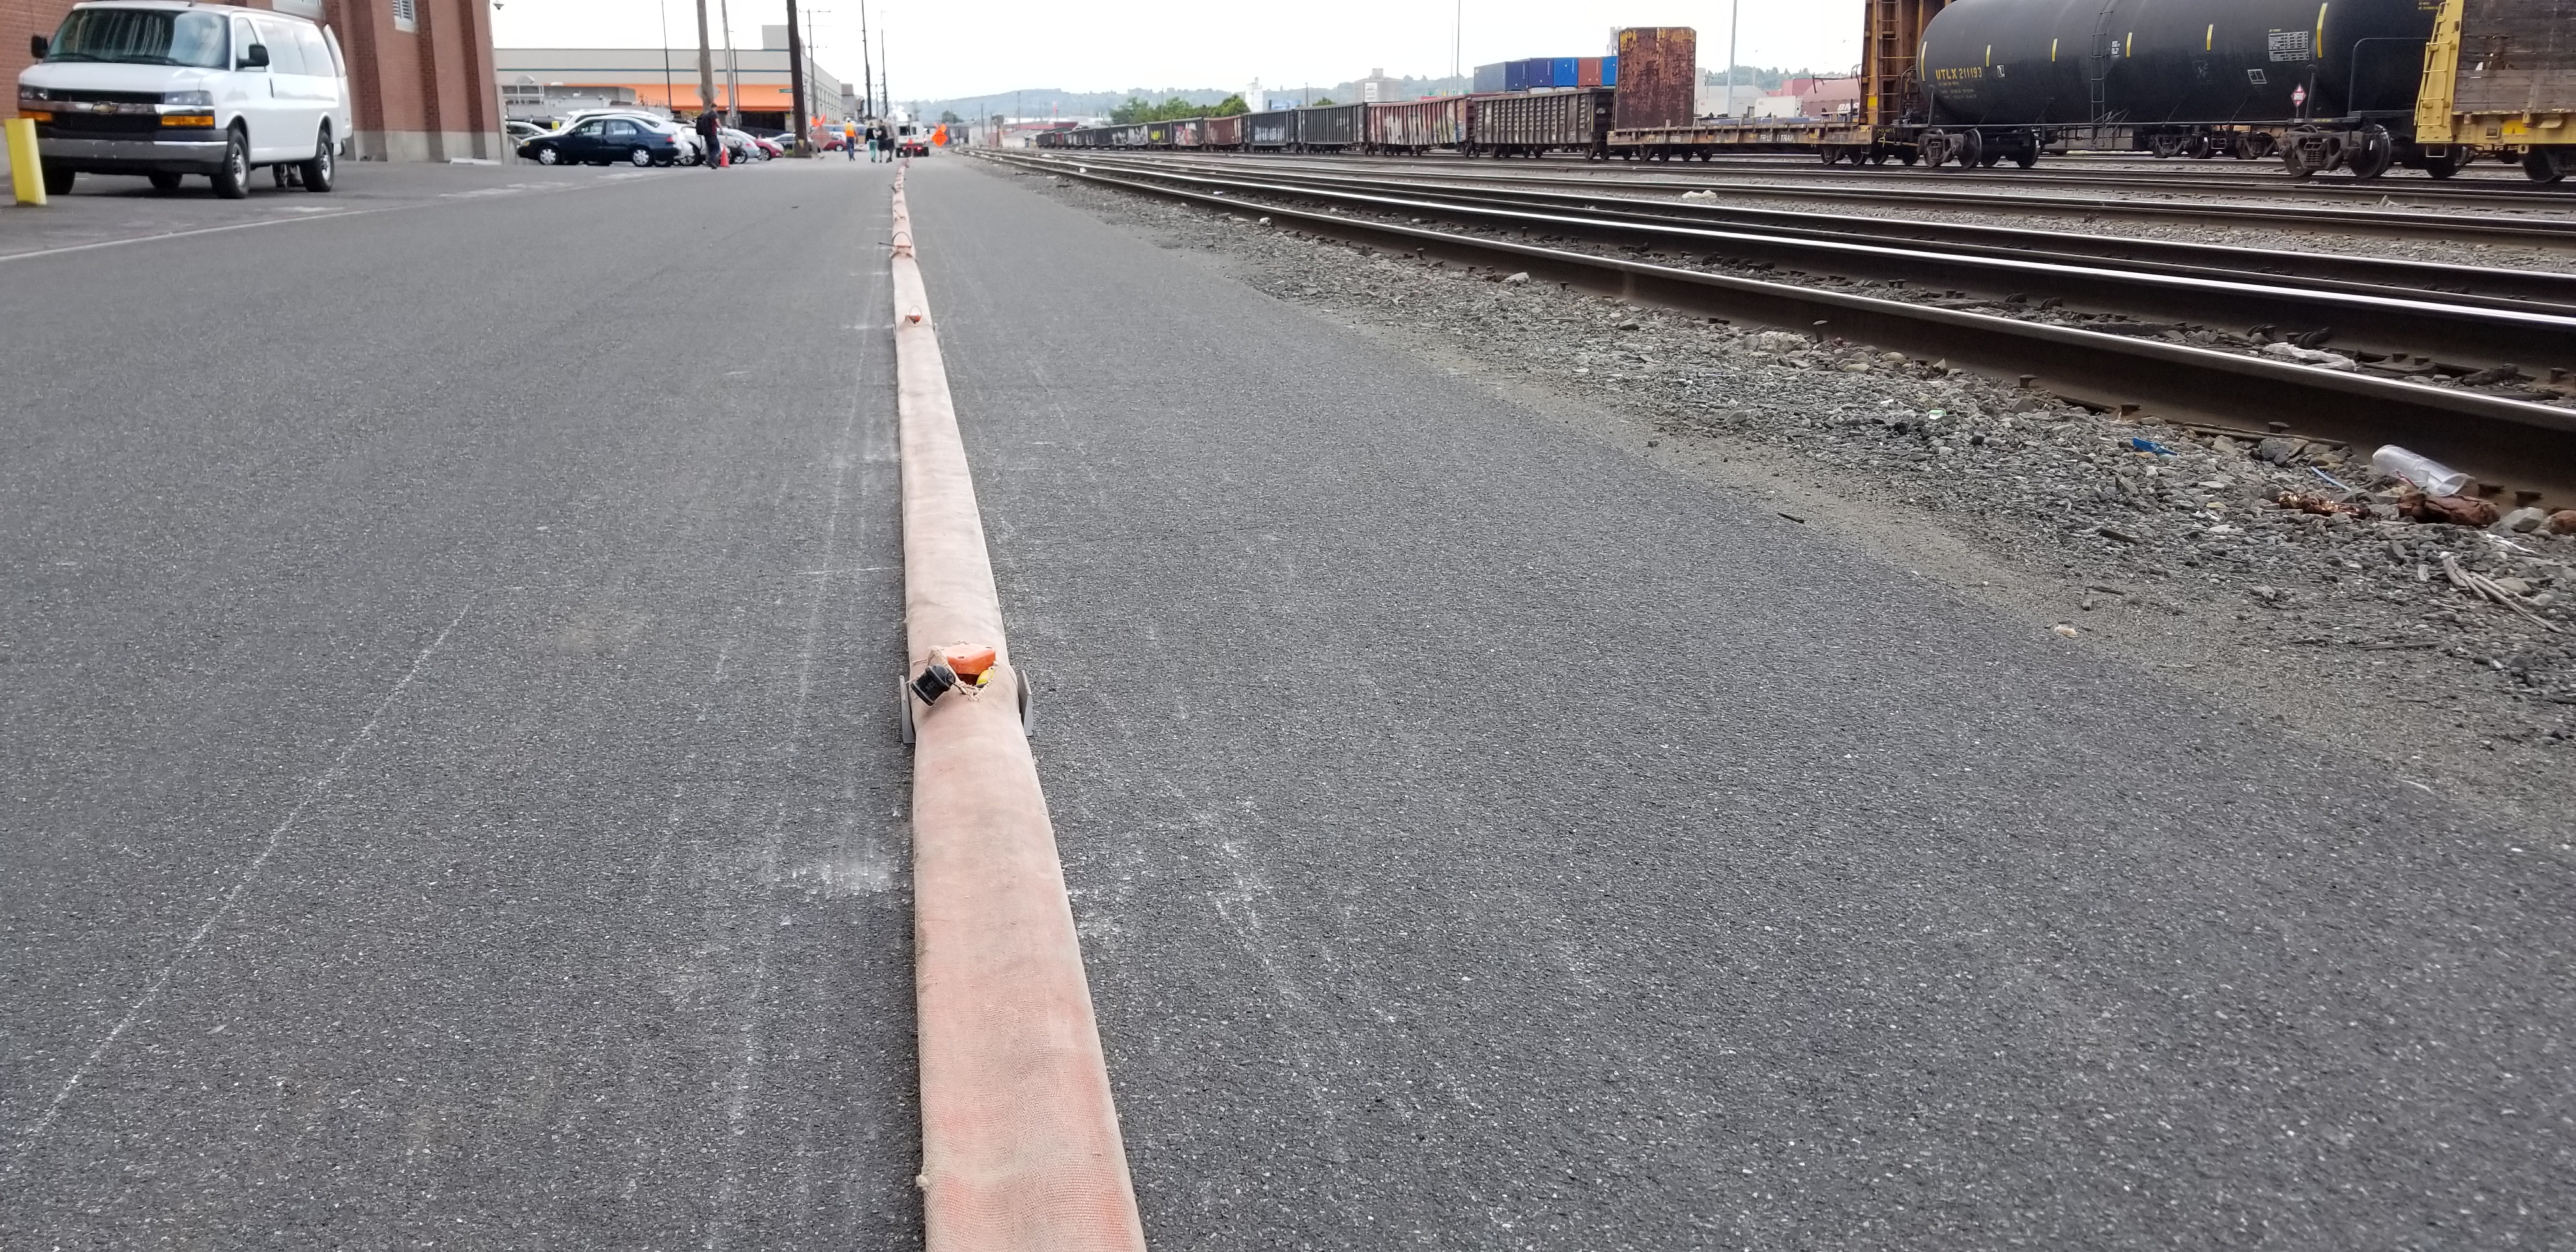
Here is our weight drop that we used for the source, the blanket-like material that you see is to help dampen the sound so it's not as loud for the residents in the area
.jpg)
Here is the streamer that I helped build in action
Week 5! Happy 4th!
July 6th, 2019
Week 5!
A short week this week, but not an unproductive one to be sure. This week was mainly focused on using MatLab and linux coding. While I may have only gotten a taste of it I’m sure that more will come later as I get into the meat of my internship after we get back from doing fieldwork in Seattle.
As far as fun things that I have done this week, I went for a bike ride along the Boise Green Way. The Green Way is about a 10 mile stretch on both sides of the Boise River that has a paved bike path and numerous parks. It was a fun ride take on the 4th as many people were also tubing on the Boise River.
The paper I am summarizing is from geosphere and is on the Kinematics of shallow back thrusts in the Seattle Fault zone. The Primary author Thomas L. Pratt.
Its main points are
1: As previous studies have indicated at least a 7000-year history of activity on multiple faults within the Seattle fault zone
2: They interpret gathered seismic reflection profiles to indicate that there are three main faults one of which is directly under downtown Seattle.
3: The models they created for the faults showed that they were driven by earthquakes in the 5.5-6 magnitude range which is consistent with paleoseismic data.
4: Rates of crustal shortening support that the Seattle Fault has been a “major seismic hazard since the Holocene”
This paper is important to my summer research because it highlights previous research that shows that the area is an active fault zone and that the magnitude of the earthquakes expected to be produced by this system are severe enough to cause major damage to the city of Seattle.
Another reason why it is important is that it shows where there are gaps in the current knowledge as to where the fault runs through the Seattle area. In the image below, which is taken directly from the paper, you can see that below where the words “Seattle” are on the map is a dashed red line indicating the “inferred main thrust fault” is. “Inferred” is just a nicer way of saying that based on current data we think it is here.
While constraining the location of the fault is not my actual project, I will still be helping to constrain the level of seismic hazards that the area will face. This is because my project looks at the shear wave velocity within the upper 30 meters. The speed of the shear waves tells engineers what kind of stresses they can expect a building to undergo during an earthquake, thereby allowing them to design buildings appropriately before construction begins and to modify existing ones.

Week 4
June 28th, 2019
Week 4:
So, this week’s assignment to talk about something that was either challenging or frustrating. As of right now the thing that I find the most challenging, is just the sheer amount of learning I must do to understand a lot of the concepts that are talked about between my coworkers. For instance, one of the words that were thrown around a lot when I first got here was to “invert” the data. When I think of inverting something I usually think of flipping polarity or turning something upside down, but for the context in which it was being used that made no sense to me. I later asked about what was meant and, if I understand it correctly, it means to make a kind of best fit model to the data that is generated by a computer program. I still feel like I don’t completely grasp the concept, but I have enough of a grasp on the subject that I can at least get a general idea of what is going on. The good thing is, that in the future I will have the opportunity to invert my own refraction data. So, after I complete that I should have an even better idea of what is going on. But this is a reoccurring theme, of hearing something I don’t really understand in context and it's like my entire train of understanding is derailed. Luckily, after the conversation is over I will ask for clarification if I don’t understand something, that way I don’t need to interrupt the flow of conversation and I can get at least a grasp on what was said. This is an ongoing challenge that I confront but it is one that should get easier as I understand more and more jargon.
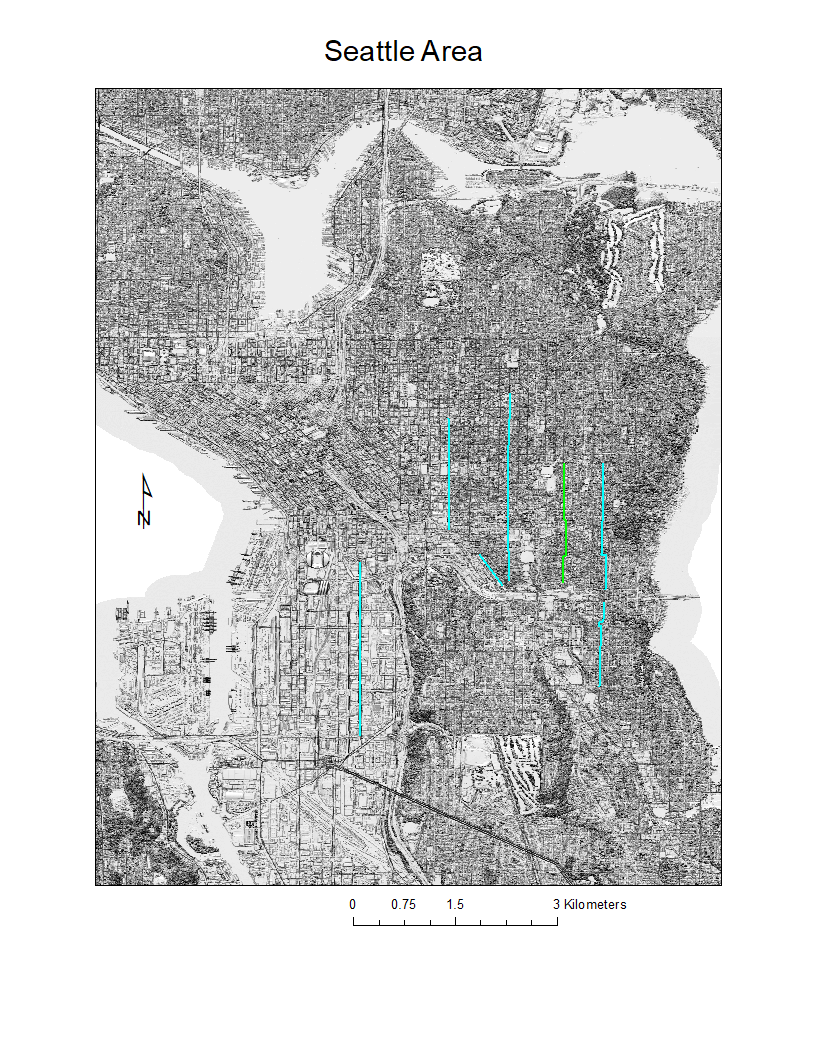
This week we were also asked to make a map of our study area. Below is a lidar map of the Seattle area with lines added in of the seismic sections that we will be mapping. This map was made in arcMap.
Week Three
June 23rd, 2019
Week 3, man time flies when you're having fun. This week the assignment was to create an elevator pitch that explained what my project was in a minute or less. I found this assignment to be pretty straight forward. It was basically making a simple core explanation of what my overall project was that anyone could understand.
The reason that I found this to be easy is that it is something that I often do already when my friends and family ask what I am working on. While explanations that I make up on the spot maybe lacking in elegance it gets the point across without me having to drag it out into a mini-lecture.
Having practice transforming complex ideas into simple ones is a skill that can have a lot of uses in many different domains of life. As I have previously mentioned, it can be used to convey ideas to a party that is not familiar with the topic at hand such as when a scientist is talking to a nonscientist. It can also be used to summarize a situation to another party without having to give them a play by play of what is going on. An example of this would be explaining a problem that you are having at work to your advisor where you provide enough details for them to get an overall grasp of the situation without dragging it out into a 5-minute explanation.
Overall this is an important skill because concise and clear communication is key no matter where you end up whether that be in an academic research capacity or industry.
Week Two : The Data + Bonus camping pics
June 17th, 2019
Data:
So this week I was given the task of compiling all kinds of data about our seismic surveys. Information such as is there dirt/grass in between the sidewalk and road, are there overhead powerlines on one side of the road, how many driveways are on each side of the block and is there a bike lane in the road?
Much of this information will be used to help effectively plan how we will carry out the survey. This can affect where we will use geophones verses seismic streamers. We can only use geophones where there is grass/dirt to put them in and if there is no grass we will have to use streamers.
In addition, things like overhead power lines can induce 120hz noise in geophones to place underneath them so they are best to be avoided.
While some of this information affects data quality, some of it will not. For instance, the reason that we have to keep track of bike lanes is that the City of Seattle has dictated that we can not block active bike lanes while we are conducting fieldwork. So, this is something else we have to keep in mind while we plan our fieldwork.
So, to compile all this information I opened my trusty friend Microsoft Excel and made separate spreadsheet tabs for each transect. The information itself came from plotting the transects on Google Earth and using street view to count things like driveways, power lines, and block length.
Once I had completed this task I was given a new one which involved using Seattle LIDAR data from USGS. I was to process this data using ArcMap, which I have some experience with, to extract the slope of each of our transects. The idea behind this is that I will later compare this slope data against the shear wave velocity in the upper 30 meters0 (Vs30) that we will measure in Seattle. There is a known relationship between these two values, except for in the Seattle area and Dr Liberty expects that it will be lower than expected due to the sediments being compressed by the previous glaciation.
Skills:
The skill I would like to look at this week is the Fieldwork Prep and Procedure skill. This skill was not on the original sheet but one I.
The reason this skill is important is that knowing what kinds of pitfalls to look out for when planning fieldwork can make not only carrying it out easier but also make the data that you get from it better quality and easier to process.
Demonstrating this skill is what I like to think of as a two-fold set.
First, you have to prepare for the fieldwork itself. This could be a few different things such as looking at previous work in the area, contacting the local government and citizens to get permission to conduct fieldwork, or in my case gathering data on possible obstructions to the actual survey itself.
Second is conducting the fieldwork itself. Which may sound straight forward but it can be complex. It mostly comes down to efficiency and how you can minimize wasted time. For instance, wrapping up a cord in a specific way may make it a lot easier to unroll later.
As far as steps I am taking to develop myself in this are questions are key. The most important question is why? Why are we taking notes of where the power lines are? Why do we set up the equipment this way?
Asking these questions helps me to understand why things are done in a certain fashion. Sometimes it is for efficiency other times its to improve data quality. I would say that while its important to learn how to do things it's just as if not more important to learn why they do them that way.
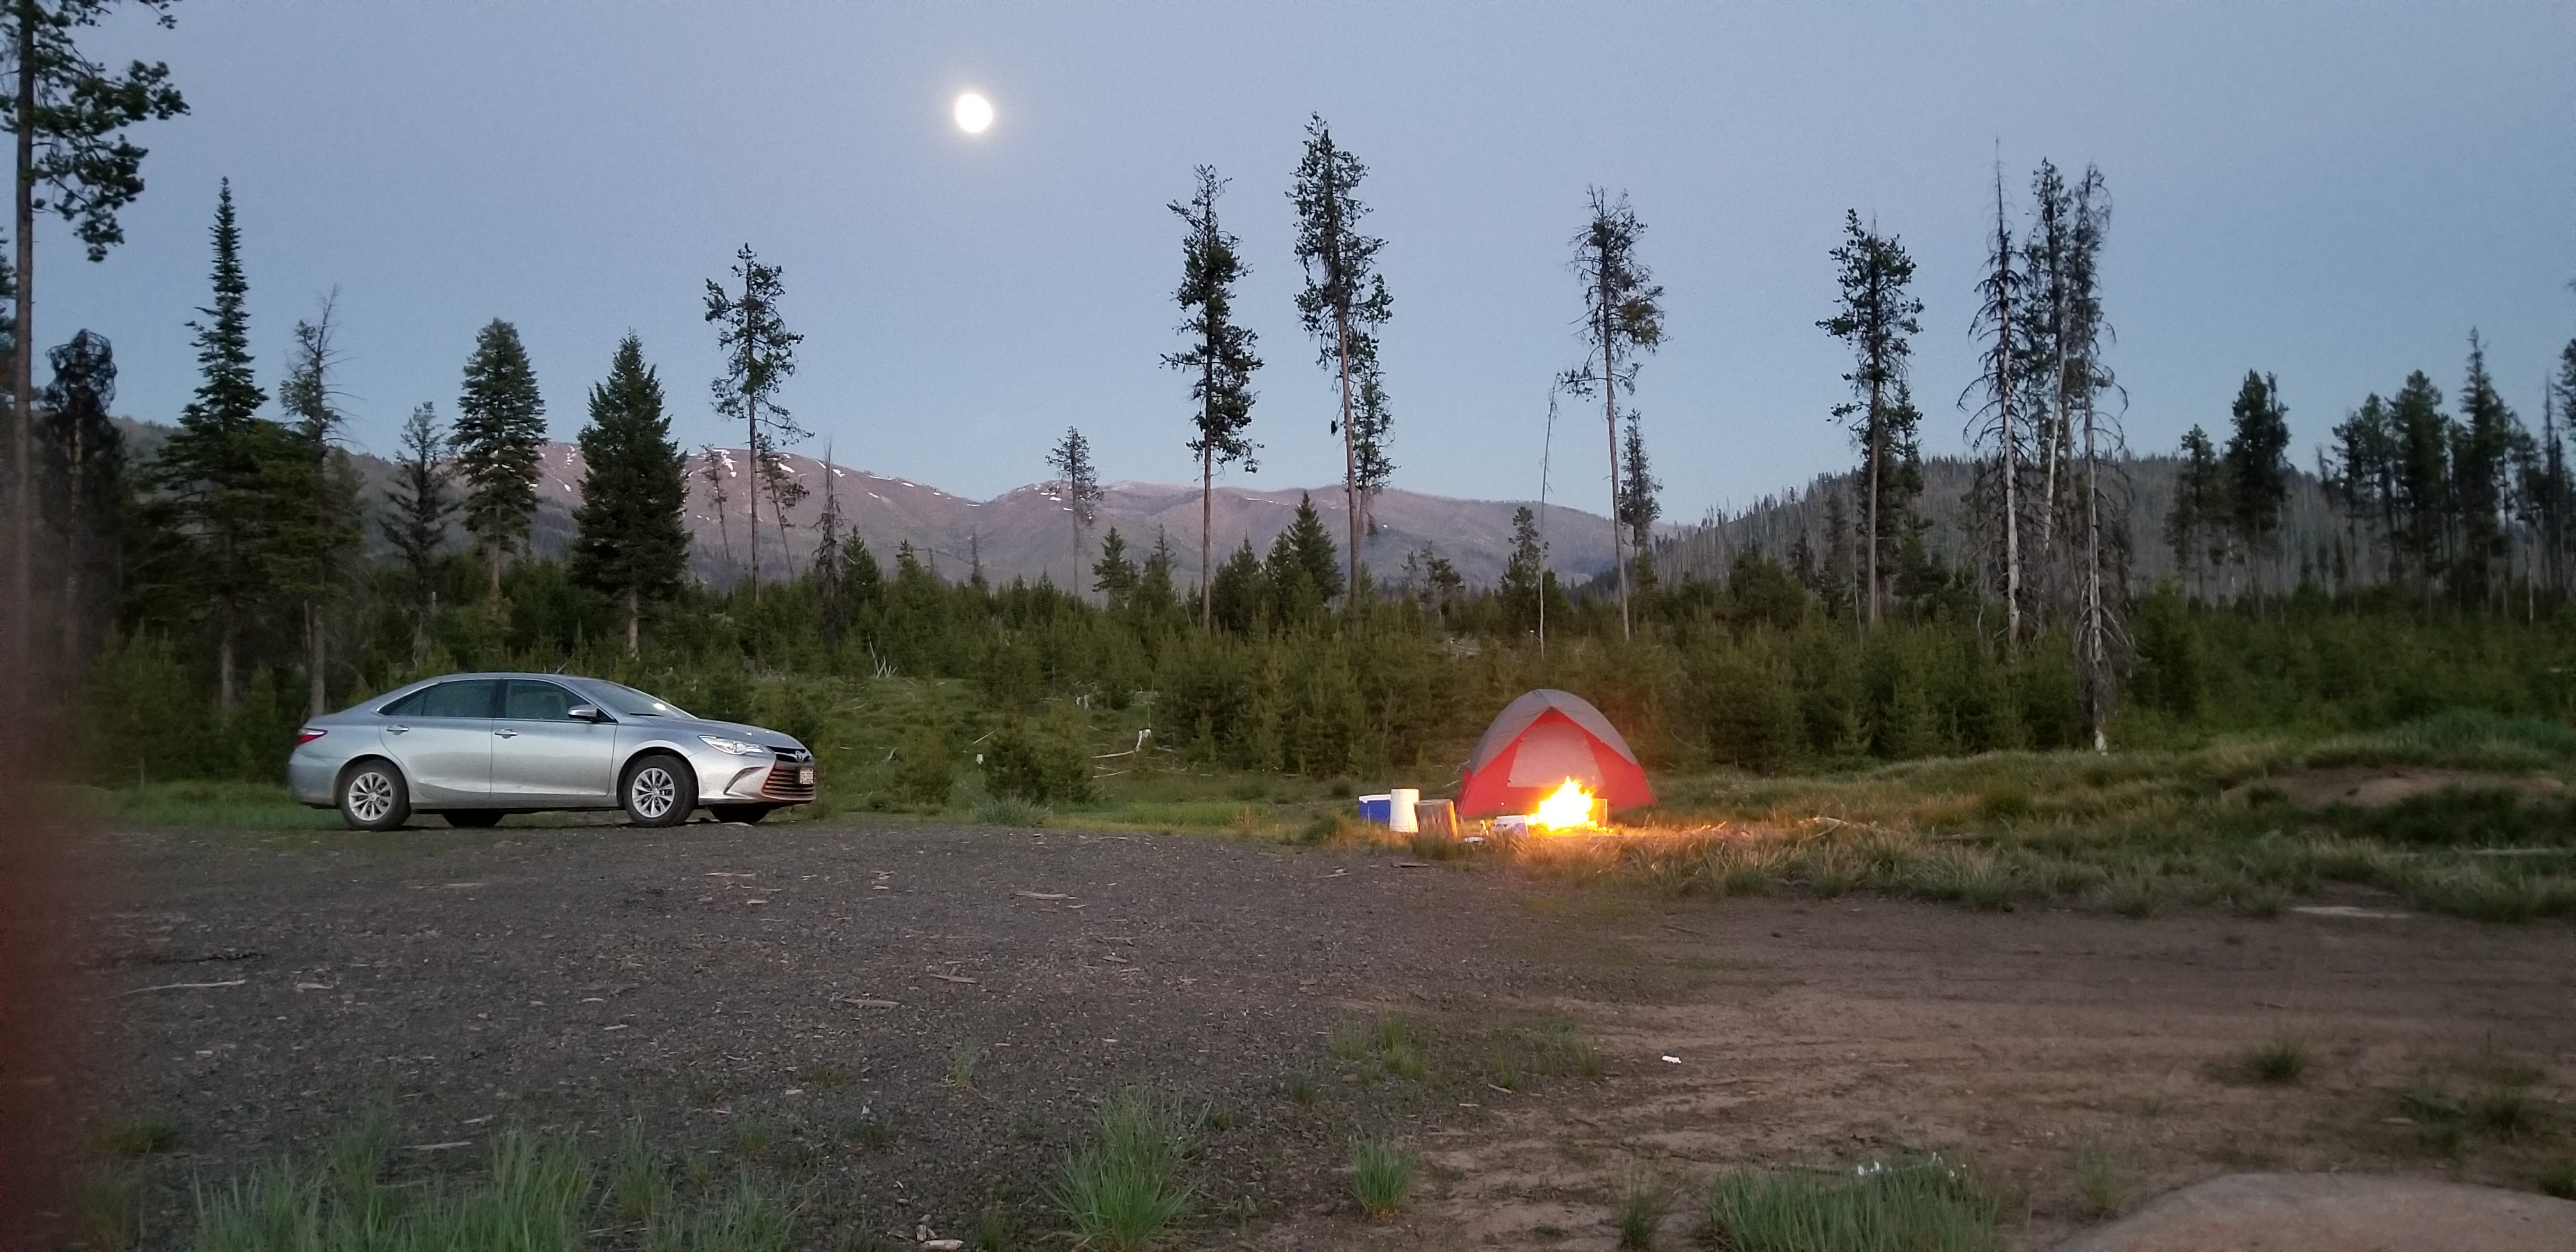
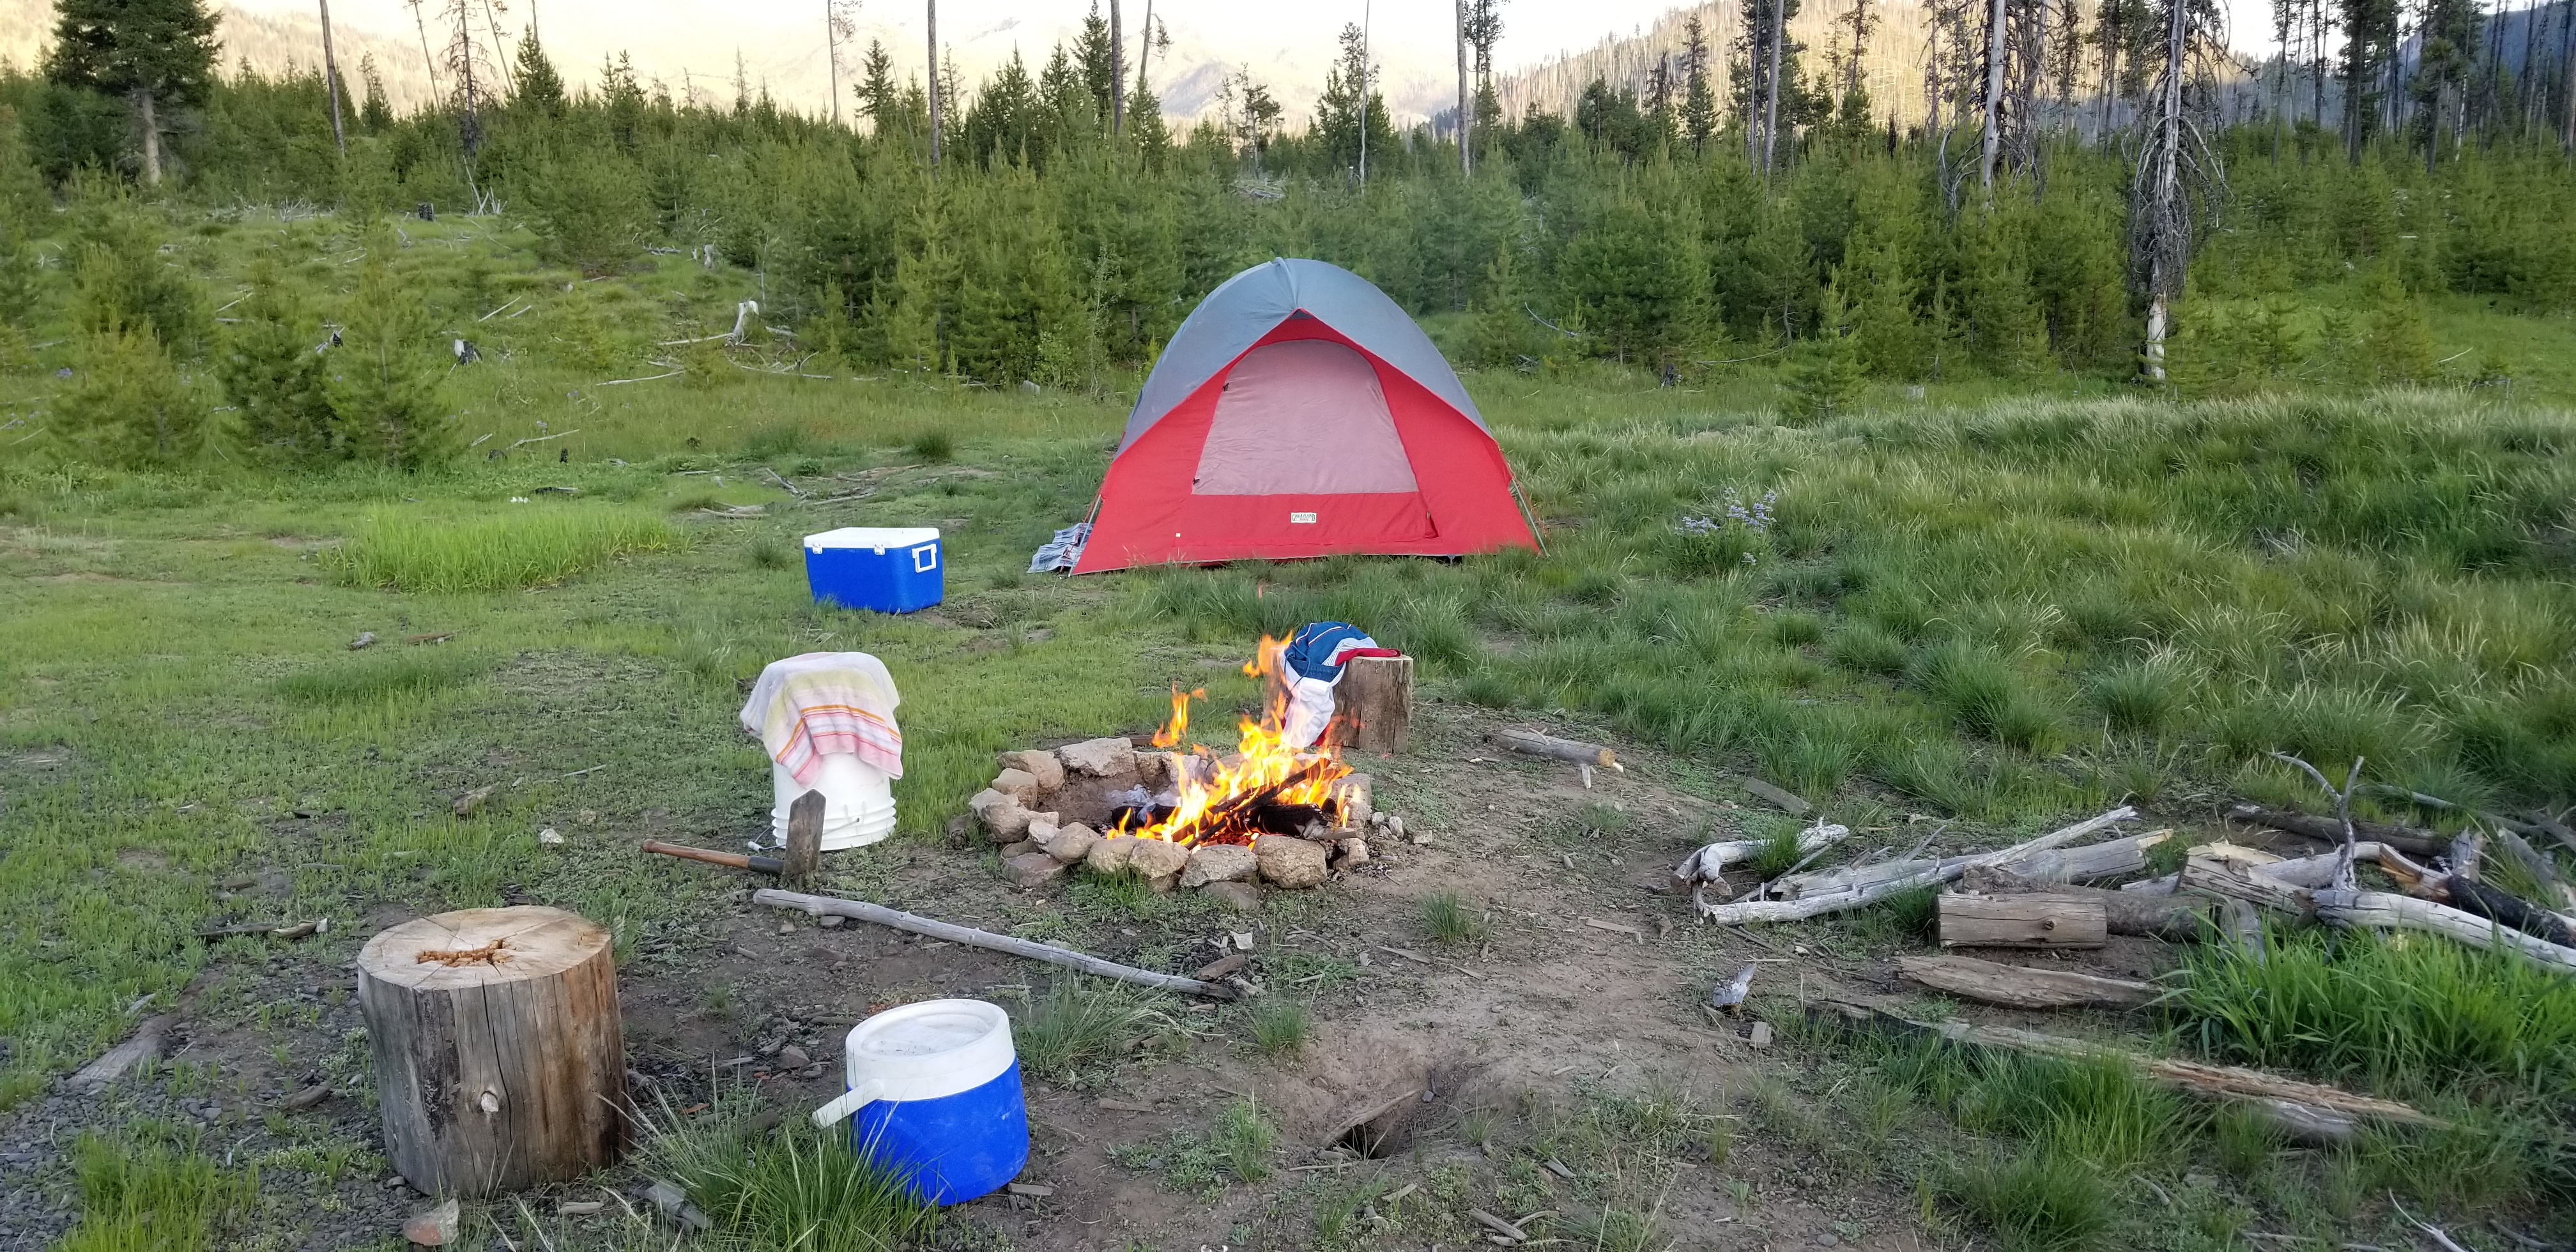
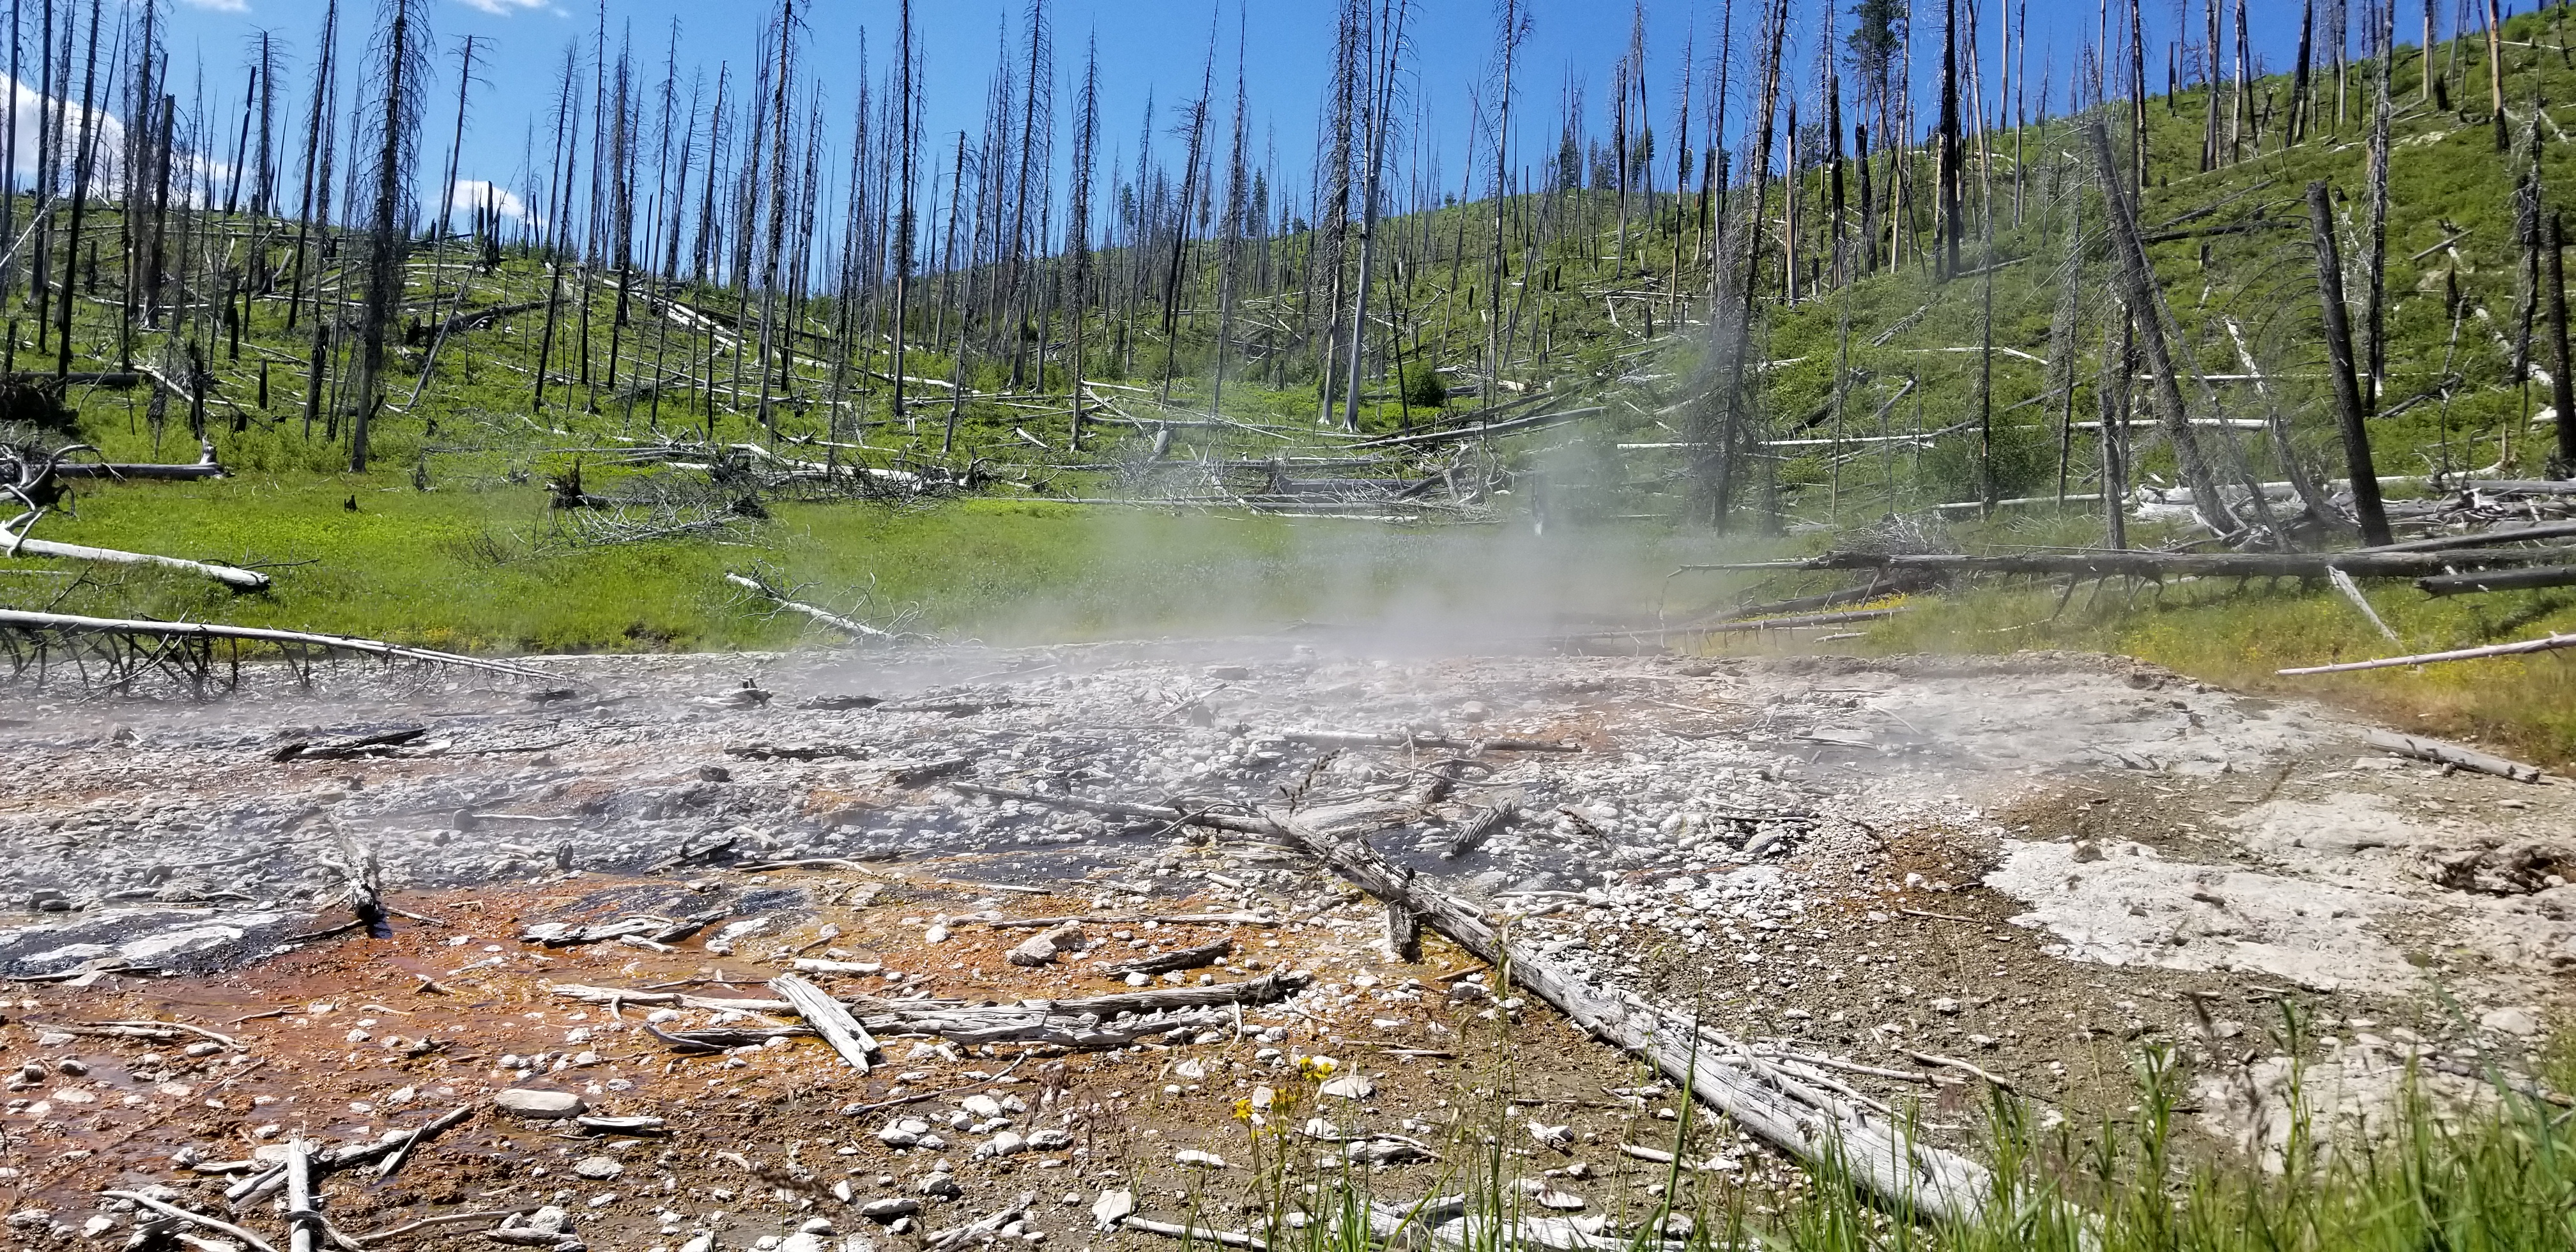
Also as a bonus, I went camping north of Boise this weekend to look at the hot springs near Warm lake and here are some pictures.
First week and a bit more
June 13th, 2019
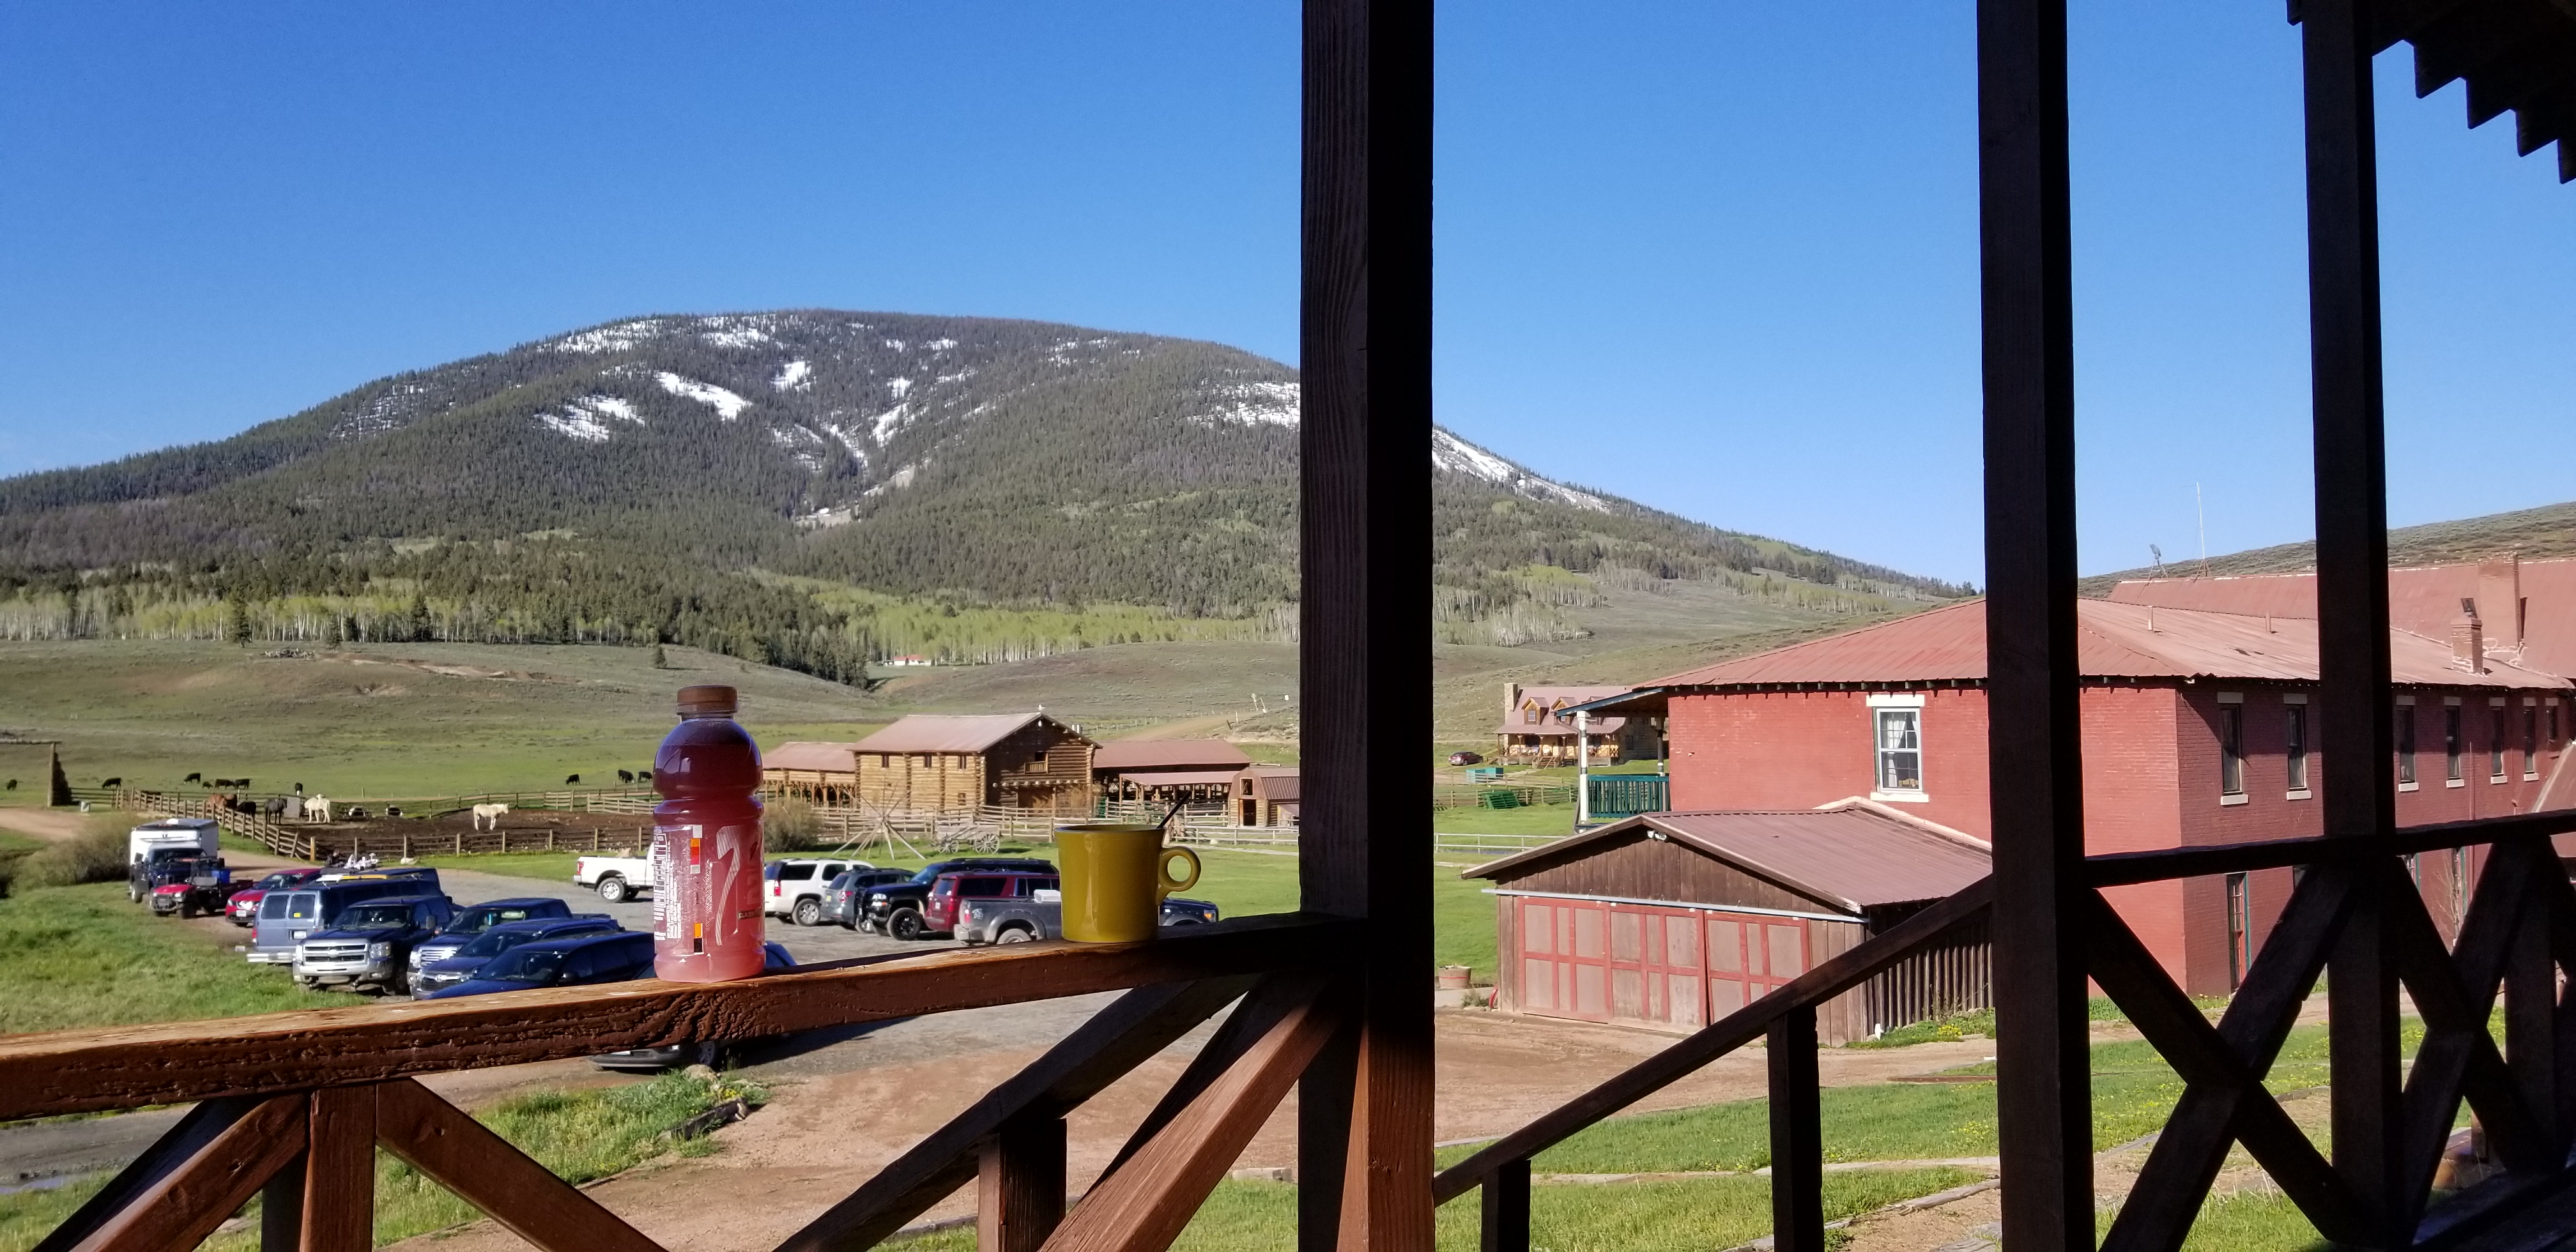
My first week and a half has been incredibly informative. I started out my internship by travelling to the Wauntina Dude Ranch Colorado with Dr. Liberty. It was a 12-hour car ride from Boise that took us through some very scenic parts of Utah and Colorado both. We stopped in Utah on our way there to take some resistivity surveys at a future research site of Dr. Liberty’s. The objective of this research site was to examine how carbon dioxide out gasses through fault systems. After getting back on the road we stayed in grand junction for the night before getting up early to continue on to the Wauntina ranch.
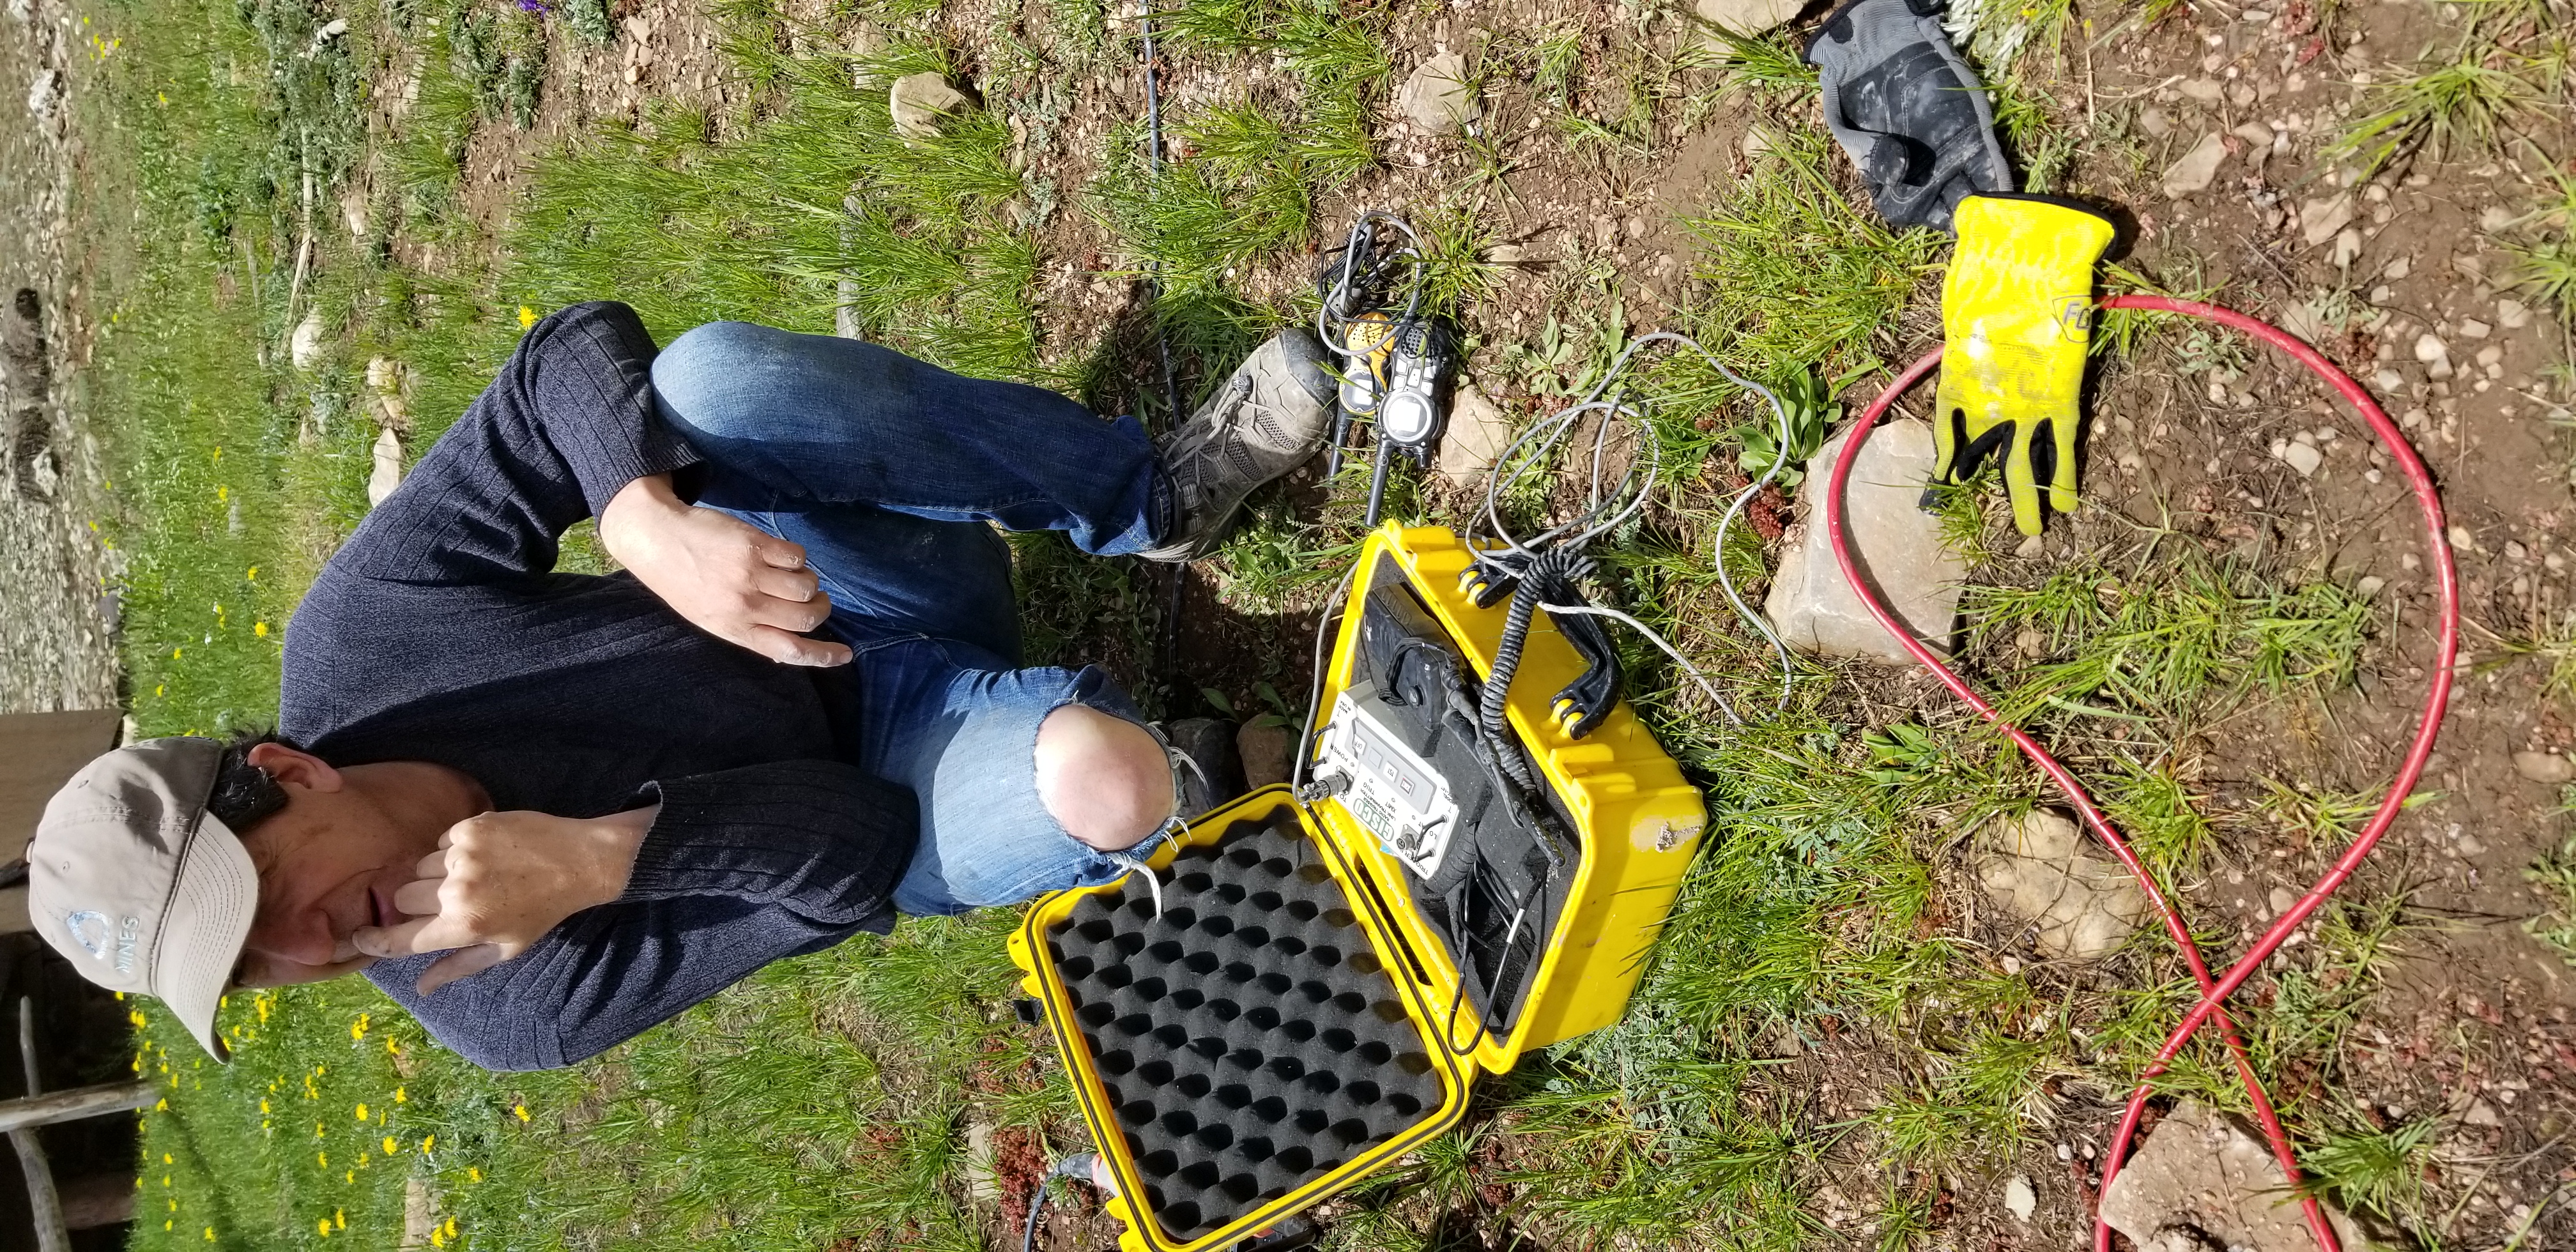
Once we arrived at the ranch we met with the owners to get a history of the ranch and the general layout of where the hot springs, that we would be studying, erupted on the property. After some quick initial discussion, we started laying down geophones and setting up resistivity surveys. For the rest of the week, it was similar jobs of setting up and tearing down seismic and resistivity surveys and discussing where to place the next one. The entire week was an invaluable window into how fieldwork was conducted and carried out. It was nice to have this primer before we head to Seattle to gather data.
Goals for the summer
First goals:
- Become more familiar with the layout of the city of Boise and the surrounding area. This includes going camping at least a few times.
- Start the graduate school application process this includes scheduling for the GRE and making a list of schools I would like to apply to.
- Continue to learn about the equipment used for seismic data collection. This includes not only set up and tear down but data acquisition into the computer as well.
- Increase my knowledge base on the Seattle fault via reading scientific papers and journal articles
Second goals:
- Become familiar with the data processing techniques that I will be using before I head to Seattle. This includes becoming more familiar with MATLAB.
- Network with other scientists and graduate students while collecting data in Seattle if possible
- Write my AGU abstract and work on my writing skills.
Third Goals:
- Process the data from Seattle in a timely fashion and compare the results to other relevant studies
- Start my draft poster for AGU.
- Finish and present my poster at AGU.
Edit 6/16/2019: added images for some reason I could not figure out how to rotate them tho...
