Anna Pfohl

Anna Pfohl is a student at Pacific Lutheran University currently completing her research at Saint Louis University under Dr. Linda Warren.
My research is focused on nonvolcanic tremors (NVT) along the North Anatolian Fault (NAF) in Turkey. Furthermore, I will be comparing the NAF to the San Andreas Fault because it has been studied much more extensively. For example, numerous studies have shown NVT occur along the SAF, sometimes in response to big earthquakes in other locations. I will be trying to correlate properties of the SAF with NAF in the hopes of gaining a better understanding of the processes occurring in this particular area of the world.
Final Post
August 3rd, 2012
Sorry I haven’t posted in a while! The past few weeks have become a mad dash to figure out what’s happening on the NAF.
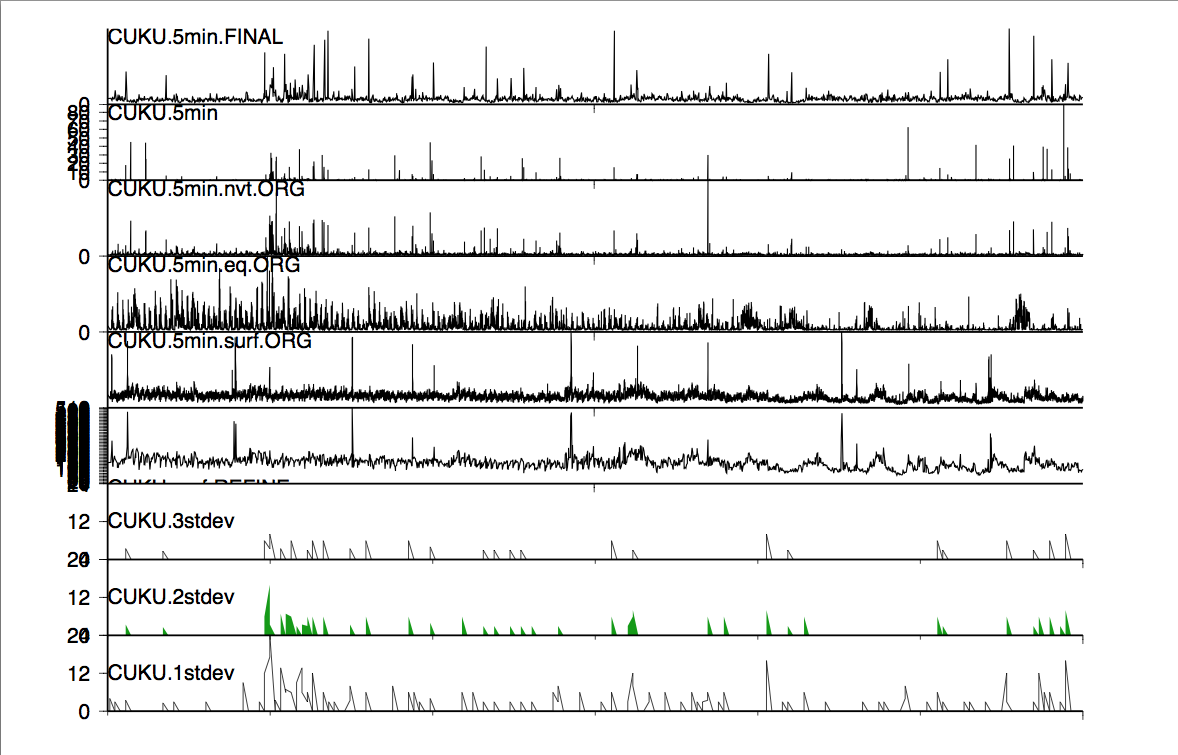
So to recap the last few weeks . . . I finished analyzing all the data for the 39 stations that were part of the NAF Passive Seismic Network. As I stated before, I’ve been looking for ambient tremor, as I turned up empty-handed in the search for triggered tremor. At first, the results of the filtered records for ambient tremor didn’t look that promising either. I’ve included a record from one of the stations (see below). I was looking for times when the amplitude in the tremor passband was elevated relative to the earthquake and surface waves passbands. December 2007 looked pretty promising for a few of the stations, and some of these stations were even placed decently close to the NAF itself or some of its major splays.

As you can tell in the figure, early December looks a little better than later in the month. I chose a day when there weren’t any earthquakes identified and then filtered the records. I was looking for a signal that resembled what had been seen in other regions, like the SAF. Fortunately, there was a time that looks a heck of a lot like tremor, and the signal can be seen at several stations. However, the tremor had peak amplitudes from 10-15 Hz, and earthquakes had significant energy in the 2-5 Hz passband. Like I’ve said before, the methods used were based on other studies, and the above methods were appropriate for those other areas. However, with these unexpected differences in tremor and earthquake energy, these methods need to be revised a little to make them more suitable to study tremor on the NAF.
So what does this mean for tremor on the NAF? I’ve probably identified tremor, but first changes need to be made to the methods before we can start characterizing it for this fault zone in particular. I’ve been talking to Dr. Warren, my advisor, about the possibility of continuing this research for my senior Capstone project that I’ll need to complete this year. This project could go in many different directions right now, so I’m not sure if I’ll be the one to try adapting the methods or if I’m going to look at something else. I need to talk to my advisor at school first. Regardless of what happens during the school year, I’m pretty happy with where I am ending things this summer.
Today’s my last day in St. Louis, and I just submitted my abstract! I’ve also begun working on my poster for AGU. I don’t have anything too concrete right now, I’m just deciding which figures most effectively demonstrate the results of my project and also am in the (very) preliminary stages of writing.
This summer has been a wonderful and incredibly rewarding experience. It’s amazing to think about how far I’ve come since my first day. I’m looking forward to meeting up with the other interns again in December to see what all their hard work looks like in poster form. Well, I should get back to work seeing as I only have a few more hours left. It’s crazy how fast the time has gone! That’s all I have for now. The rest will be at AGU.
Goals Revisited
July 16th, 2012
I figure with 3 weeks left of my internship it’s time to take a look at the goals I made at the beginning of the summer.
One of my main concerns my first week in St. Louis was my lack of programming experience. While I’m definitely no expert, I’m far from the novice I was back in June. Although there are still times when I need help, I’m now able to troubleshoot many problems on my own before asking for help. It’s quite encouraging to think of how much I’ve improved!
Another one of my goals was to become more adept at examining seismograms. In the past few weeks, I’ve become much better at recognizing the characteristic patterns that indicate “earthquake” and those that might be tremor (I’ll show some figures of what I’m talking about later in the week).
Much of my summer has been thinking about life after I graduate from PLU this coming May: graduate school. I haven’t quite figured out what area of the geosciences I want to be in, but there’s still a little time left to figure that out. Katie, our alumni mentor, gave an awesome presentation during the orientation week. She suggested thinking about where I’d want to be geographically, so I’m looking at schools in the Pacific Northwest, primarily. By the end of the summer I want to have a clear plan of the schools and specific programs to which I’ll be applying.
That’s all for now!
Week Five (already??)
July 6th, 2012
As I mentioned last week, I’ve been working with some new code that makes filtering data much easier. Because the SAC files I requested are so large, it takes around 12 hours to process a year’s worth of data for one station. I’m a pretty impatient person, so this has definitely been a growing experience for me. After more than a week of doing this, I’ve been able to analyze a decent number of stations. Unfortunately, I still haven’t been able to locate any tremor. I’ve included one of the plots for your perusal.

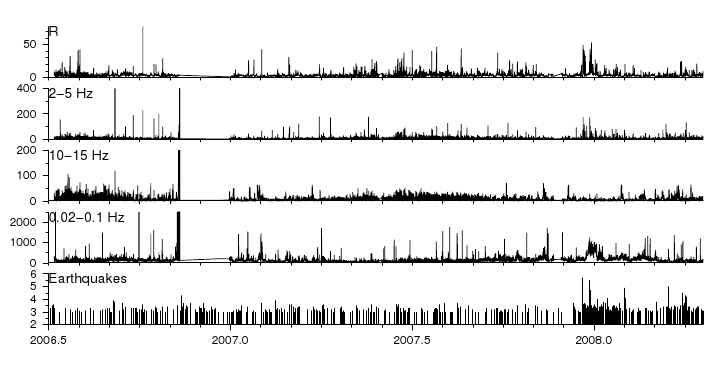
The third, fourth, and fifth lines are the most important. They show the filtered bandpasses for (what should be) tremor, earthquakes, and surface waves, respectively. The problem is that the peaks for tremor are at the same time as the earthquakes, showing that it’s likely just energy from the earthquake that’s causing the increase in energy.
Dr. Warren suggested that I take a little break from the computer work and write a little about the differences between the SAF and NAF, so I’ll be taking a little break from programming and data analysis for the next few days. By more closely examining the characteristics of each, I’ll have a better idea of why I haven’t been able to locate tremor yet. Thinking about all of this now is also going to help prepare me for writing my AGU abstract, which is a relief. I’m still going to continue to analyze some of the data from stations that are closest to the NAF, though. I guess that’s the good part about having the twelve-hour waiting period!
My free-time has primarily consisted of studying for the GRE and researching graduate schools. It’s a daunting process at this point, but I’m also really excited to see all the options I have available! That’s all for now!
Here comes the sun (and heat)
June 29th, 2012
This week I’ve been turning my attention away from triggered tremor and am now on the quest for ambient tremor. On Monday, I received some code that has made data analysis infinitely less complicated from Stefany at Miami University (she’s also a former IRIS intern!). I’ve primarily been downloading data from IRIS for the YL network so that I can analyze it all later. Let me tell you, this is a LOT of data. There are 39 stations in this particular network, and I now have data from when they were first installed (some in 2005, the rest in 2006) to when they were taken down in 2008.
Yesterday and today I have been working with the code Stefany gave me, and it takes quite a while to process. For example, the first script processes data for a given station an hour at a time. It takes about 12 hours to go through an entire year just for one station. Once that’s complete, I’m able to filter the seismograms, similar to what I was doing before, at three different frequency levels to differentiate earthquakes, surface waves, and of course tremor.
I’ll include figures next week after I’ve had the chance to go through more data.
Yesterday was a record-breaking day for St. Louis! Apparently with a high of 108 (!!!) this was the hottest day in the city in almost 60 years. Yikes. On the bright side (literally), today will be a slightly cooler 105. I’ve never been so thankful for air conditioning. That’s all for now!
Elusive tremor
June 25th, 2012
I spent a majority of last week looking at seismograms (so many seismograms that I swear the black squiggles are forever etched into mind, but that's the nature of working in seismology, so I'm more than okay with it), searching for tremor signals. As I explained in my last post, I was looking at different events in or around Turkey from 2005 to 2008 (from network YL) and then filtering the data from 2 to 8 Hz. This filtering interval was based on what many previous studies had done. However, we weren’t really seeing a whole lot. Dr. Warren suggested that we try filtering the data from 5 to 15 Hz instead, and the data was much more promising, so I ended up re-filtering everything. As it turns out, what we had originally thought was tremor was actually signal from other small earthquakes nearby.
I also downloaded more data from IRIS from a different temporary network that was in use from 1999 to 2001, called XG. Again, I filtered the data from 5 to 15 Hz, but this time around, things weren’t quite as clean as what they had been with the YL network. The XG network was located primarily along the North Anatolian Fault whereas the earlier one was farther east and south. The signal from many of these stations was not nearly as good, and there were too many inconsistencies among the different stations to determine a whole lot, at least for right now. We might come back to this data later on, though.
There have been numerous studies that have found tremor triggered by large (M>8) earthquakes in completely different parts of the globe. For example, the Chile earthquake in 2010 was shown to trigger tremor along the SAF. I spent part of the day on Thursday locating all large (M>8) earthquakes that had occurred from 1994 to present. We were hoping to use the data collected from station ANTO, a permanent borehole station located a little south of the NAF. Unfortunately, the signal was so large from these events, that tthe instrument response was not adequate enought to read them, making them unusable.
So where does that leave me for this week? I now know that tremor along the NAF isn't triggered by regional earthquakes, so I will be looking at ambient tremor, instead of triggered tremor. I’m waiting on some code right now that will make the analysis much easier. I’m anxious to see what the results are!
In other news, I’m pretty excited for this weekend. I’ll be heading to Chicago to see two of my friends and can’t wait to (hopefully) leave a little bit of this St. Louis heat and humidity for a few days. We’ll see if the weather works in my favor. That’s all for now!
Tremor Triggers and Seismograms
June 14th, 2012
This week has primarily consisted of article reading and a little data analysis. I’ve been doing quite a bit of reading about the SAF because it has been so heavily studied. I now have a better understanding of what tremor is and different ways to locate it, and I’ll be applying much of what has been done in studies on the SAF to the NAF.
Here’s a little of what I’ve learned about tremor this past week:
- Relatively new idea for tremor to occur on transform plate boundaries; traditionally believed to primarily occur at subduction zones
- Fluid movement is one of the proposed mechanisms that trigger tremor
-
Has been triggered by teleseismic waves from major earthquakes from different parts of the world
- One article showed evidence that the M 8.8 earthquake in Chile in 2010 triggered tremor in California along the SAF
With that in mind, I located 57 earthquakes that have occurred in or near Turkey since June 2005. IRIS had a temporary network set up for about 3 years, and I have been downloading data from specific events. I have looked at data from 9 different earthquakes thus far. Once I have the data, I use SAC (a program within UNIX) to filter the seismograms. I have been filtering the data from 2-8 Hz (these values are based on what I have seen in the literature). I’ve included two figures to help visualize everything. There was an earthquake in western Turkey on October 18. The first figure is the unfiltered, transverse data collected by five different stations, and the second consists of the same stations with the 2-8 Hz filter. My advisor is out of town until next week, so I’ll hopefully be able to provide some further insight next week!
I have been pleasantly surprised by how much easier the programming has gotten for me by this point. I feel much more comfortable with navigating my way through SAC and am able to figure out minor problems on my own. I’m definitely not even close to being an expert, but this has definitely been a huge relief for me. That's all for now!
.png)
Figure 1. Unfiltered seismogram
.png)
Figure 2. Filtered seismogram 2-8 Hz
Week One
June 7th, 2012
My first few days in St. Louis have been great so far. Before Monday, I really only had a vague sense of what I would be working on during the summer. Currently, I have yet to look at data, so as of now here’s the broad scope of my summer research:
I will be looking at nonvolcanic tremors along the North Anatolian Fault (NAF) in Turkey. Additionally, a large portion of my project will consist of comparing and contrasting the NAF to the San Andreas Fault.
Thus far, I have created a preliminary map of my study site and have been reading lots and lots of articles to gain a better understanding of the nature of tremor. I’m trying to answer questions about tremor (What does it look like? How big of a signal are we able to see? Is there a relationship between location of tremor in comparison with large earthquakes?) so I can possibly apply what I’ve seen in the literature to data from Turkey.
Prior to the orientation week, I had no prior experience using any kind of programming software, so I’m really hoping to become more proficient and efficient with these new resources that I have available. Furthermore, I also hope to be more adept at examining seismograms and determining what (if any) information they provide. Another programming-related goal, but I want to get better at using SAC (which will likely be inevitable because that’s how I’m processing much of my data--I think).
I’m enjoying my work so far. I think this summer will definitely have moments of frustration (see programming worries above), but it will also be incredibly rewarding. That’s all for now!


