This activity uses the Earthquake Machine, a mechanical model that illustrates the earthquake cycle, as a tool to investigate the behavior of fault systems. In the activity groups of students are presented with a claim about earthquakes. Using the Earthquake Machine, students design an investigation to collect data to either refute or support the claim they were presented with. After students have collected evidence they use this information to construct an argument regarding the claim. Next, students present their work to their knowledgeable peers for a skeptical review.
Students will be able to...
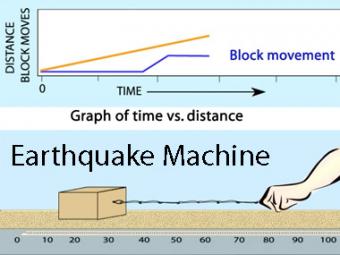
Animation of the single-block "Earthquake Machine", a mechanical model of the earthquake process using a wood block, sandpaper, and rubber bands. This model shows how "Forces, Faults, and Friction" interact as elastic energy is slowly stored when the rubber back stretches and then is rapidly released as the block jerks during an "earthquake".
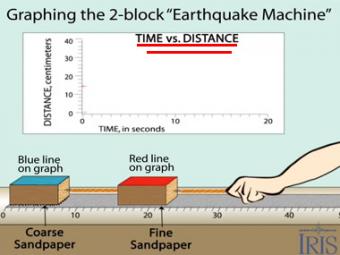
Graphing time vs. distance using the classic block-and-sandpaper "earthquake machine"
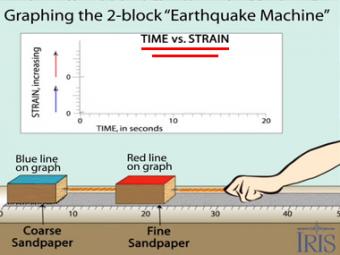
Graphing time vs. strain using the classic block-and-sandpaper "earthquake machine"
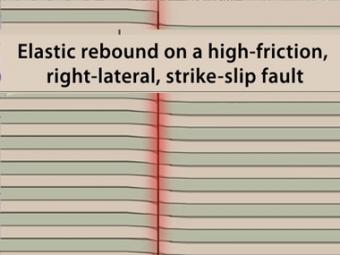
Animation shows the buildup of stress along the margin of two stuck plates that are trying to slide past one another. Stress and strain increase along the contact until the friction is overcome and rock breaks.
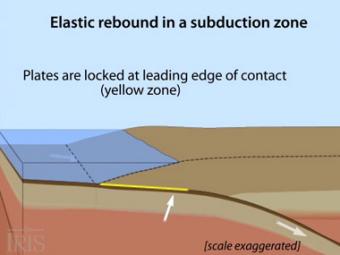
Oblique view of a highly generalized animation of a subduction zone where an oceanic plate is subducting beneath a continental plate. (See sketch below for parts.) This scenario can happen repeatedly on a 100-500 year cycle. The process which produces a mega-thrust earthquake would generate a tsunami, not depicted here.
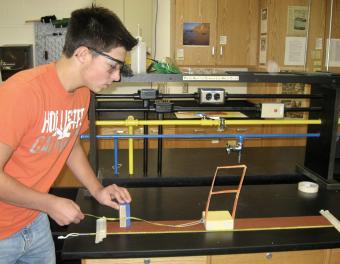
Using a block-and-sandpaper model, students collaborate in small groups to investigate how energy is stored elastically in rocks and released suddenly as an earthquake (the earthquake cycle). This activity emphasizes the role of mechanical models in understanding and testing ideas in science.
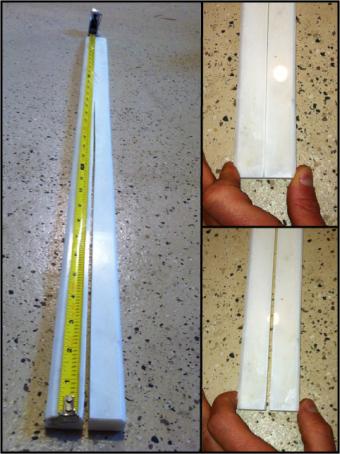
Through a demonstration lead by the teacher, the discrepant concept of rocks exhibiting elastic behavior is physically illustrated with an easily obtained, inexpensive model.
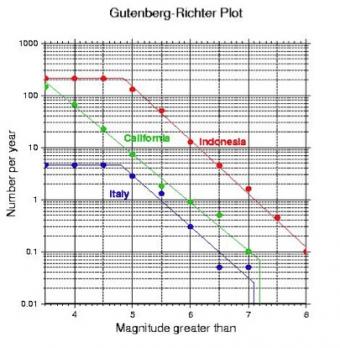
This activity allows the students to select a global region of interest and to interrogate the earthquake catalog to obtain quantitative data on the rate of occurrence of earthquakes of various magnitudes within their chosen region. Products lead to discussions of earthquake prediction and forcasting.
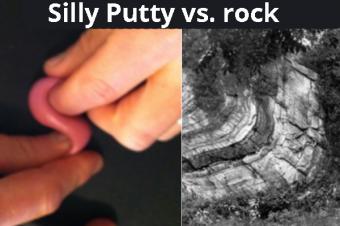
Using Silly Putty™ as an analogy, this activity extends student understanding of the deformation a rock undergoes as a result of stress, plus several factors that contribute to the behavior.
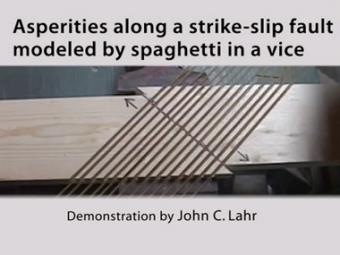
This demonstration, squeezing uncooked spaghetti noodles in a wood template set in a vise, effectively shows how asperities (stuck patches) on a fault rupture at different times.
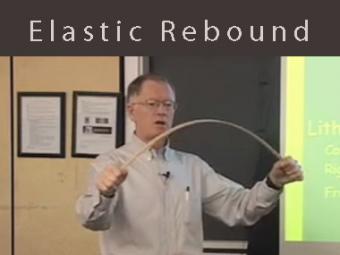
Video lecture about elastic rebound and brittle material in the crust using a yardstick as a mechanical analog. This demonstrates elasticity, brittle fracture, and why it is difficult to predict earthquakes.

This demonstration shows that rocks are elastic by squeezing a slit core of rock.
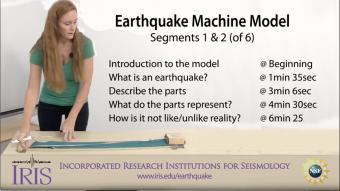
Earthquakes are associated with displacements on faults. In this lesson, learners work collaboratively in small groups to explore the earthquake cycle by using a mechanical model.
MenSegments 3–6 (separate video) expand on this demonstration to include collecting the data and plotting it on graphs.