4min 35s Novice Spanish
Why is ShakeAlert® useful to me?
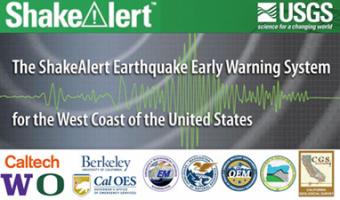
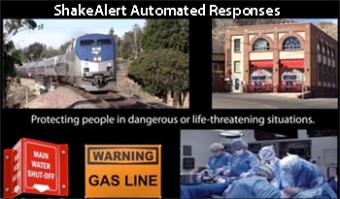
ShakeAlert® (www.ShakeAlert.org) is the U.S. Geological Survey (USGS) managed Earthquake Early Warning System for the West Coast of the United States. This animation demonstrates how the ShakeAlert System works starting with the detection of ground motion and moving data to a processing center where it is analyzed. If an earthquake fits a certain profile, a data package called a ShakeAlert Message is issued by the USGS and is made available to distribution partners who develop and deliver alerts that could prompt people to take a protective action such as Drop, Cover, and Hold On or trigger an automated action such as open a fire house door. Made in collaboration with the USGS and ShakeAlert partners in Washington, Oregon, and California.
CLOSED CAPTIONING: A .srt file is included with the download. Use an appropriate media player to utilize captioning.
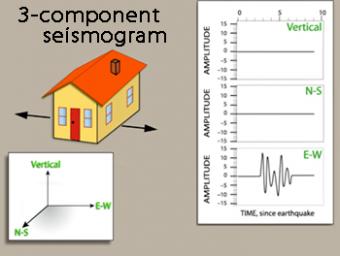
We use exaggerated motion of a building (seismic station) to show how the ground moves during an earthquake, and why it is important to measure seismic waves using 3 components: vertical, N-S, and E-W. Before showing an actual distant earthquake, we break down the three axes of movement to clarify the 3 seismograms.
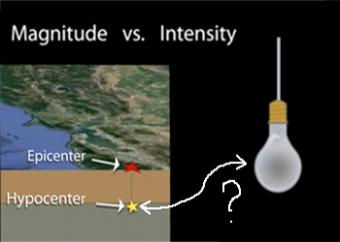
Earthquake intensity (what is felt during an earthquake at any given location) is often mistaken for earthquake magnitude (the instrumentally measured size of that earthquake). This animation describes the main factors that contribute to differing intensities using examples of earthquakes. Produced in collaboration with the U.S. Geological Survey.
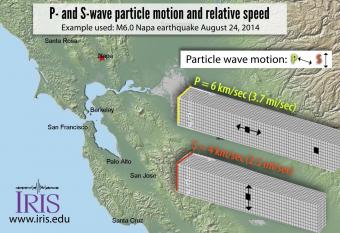
When an earthquake occurs, seismic waves, including P and S waves carry energy away from the hypocenter in all directions. This video explores how the difference in the P and S waves results in staggered arrivals that, in turn, provides information about how far away the earthquake was from the seismograph.
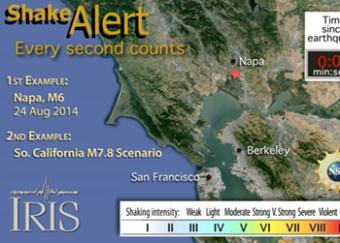
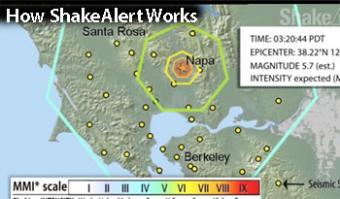
ShakeAlert (www.shakealert.org) is an experimental earthquake early warning system (EEW) being tested in the seismically vulnerable West Coast of the United States. This animation shows how ShakeAlert worked for the Napa earthquake, and how it could work for a large M7.8 hypothetical earthquake in Southern California.
The epicenter is the map location on Earth’s surface, above where earthquake began. An earthquake actually begins inside the earth at the hypocenter. Learn more!
Magnitude and intensity are both related to the size of an earthquake, but they each measure different aspects. One is measured using seismometers; the others is felt. Let's use a lightbulb as an analogy.
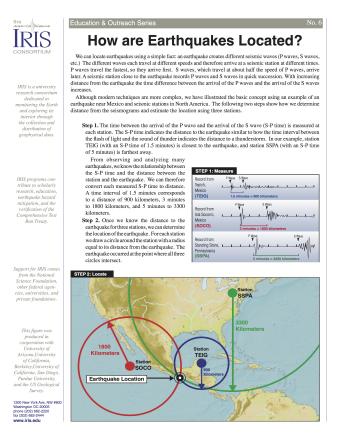
Knowing precisely where an earthquake occurred is an important piece of scientific information. It can help seismologists identify and map seismic hazards. It is also a fundamental piece of information necessary for facilitating studies of Earth's internal structures. This fact sheet provides an overview of the S-P process to locate an earthquake.
NOTE: Out of stock; self-printing only.
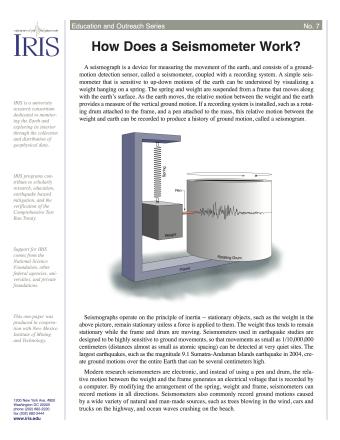
A seismograph is a device for measuring the movement of the earth, and consists of a ground-motion detection sensor, called a seismometer, coupled with a recording system. This fact sheet provides an overview of the basic components of a seismometer and physical science principles behind its operation.
NOTE: Out of Stock; self-printing only.
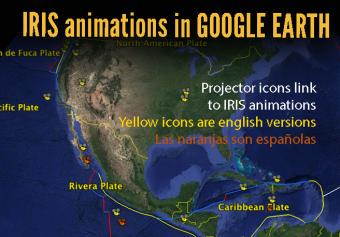
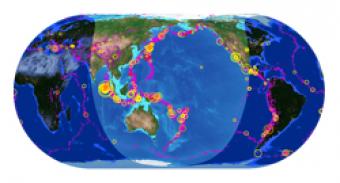
IRIS has developed a "World Series" of animations of seismically significant areas to address tectonic forces and the resulting earthquakes. These have been placed into Google Earth and exported as a kmz file.
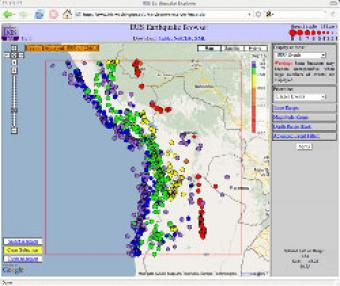
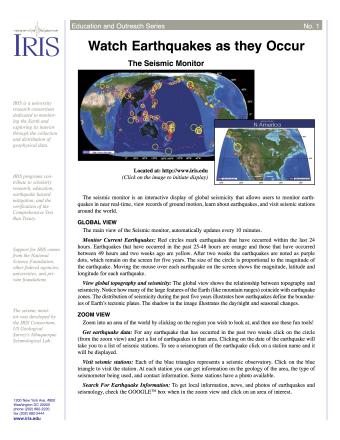
The IRIS Earthquake Browser (IEB) is an interactive tool for exploring millions of seismic event epicenters (normally earthquakes) on a map of the world. Selections of up to 5000 events can also be viewed in 3D and freely rotated with the 3D Viewer companion tool.