Use 3 seismic stations to locate earthquake epicenter
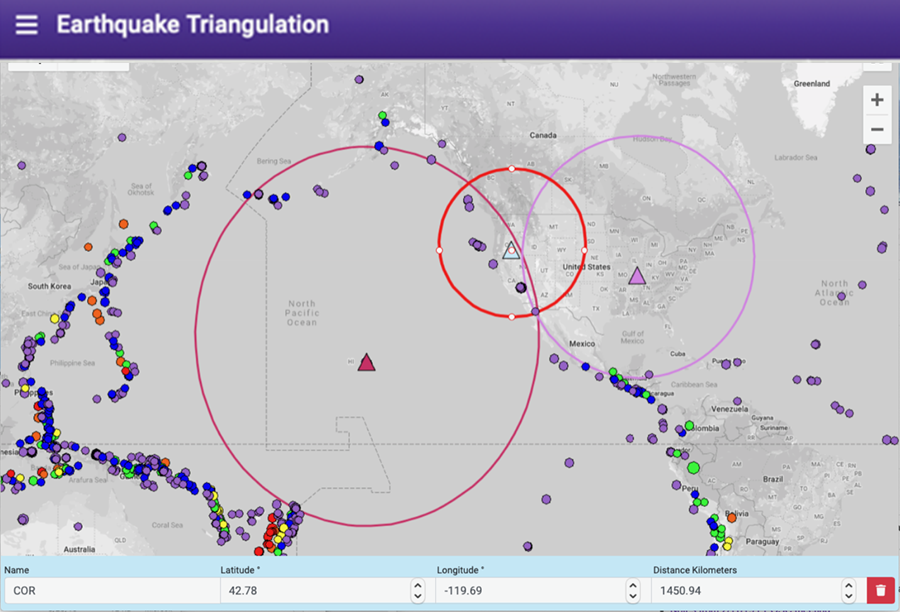
The Earthquake Triangulation app provides a simple interactive map where users can estimate the location of an earthquake using the distances between the earthquake and 3 or more seismic stations.
As an activity to locate an earthquake, students or instructors can estimate the location of an earthquake using seismograms from at least 3 different seismic stations. Earthquake-station distances need to be calculated separately by first picking P and S arrival times on seismograms, measuring the time difference between the P and S waves, and then using a P and S wave travel time graph to determine the distance. For example, see the activity "Locating an Earthquake with Seismic Data" in the "Lessons" tab above which includes 3 seismograms from the 2019 Ridgecrest earthquake. [Note: seismic stations and seismograms can also be found using the IRIS Station Monitor, see link in tab above. In the Station Monitor app, the P and S arrival times have already been marked, so your students will only need to determine the distance using a travel time curve.]
IF YOU HAVE SEISMOGRAMS AND WANT TO DETERMINE THE EARTHQUAKE EPICENTER:
Once you have the seismograms and have calculated the distance to the unknown earthquake, the application allows users to place their choice of seismic stations on the maps using the following steps:
Description
EqLocate is an interactive app that allows users to locate earthquakes using real seismic data from recent and historic events.
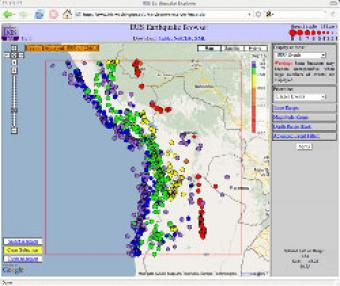
The IRIS Earthquake Browser (IEB) is an interactive tool for exploring millions of seismic event epicenters (normally earthquakes) on a map of the world. Selections of up to 5000 events can also be viewed in 3D and freely rotated with the 3D Viewer companion tool.
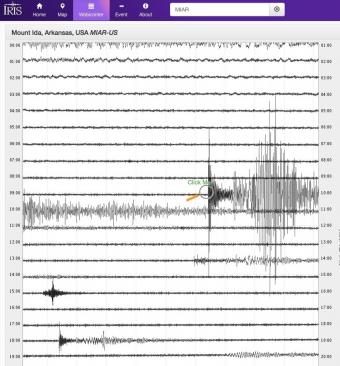
Explore earthquakes near you or from around the globe using the new IRIS Station Monitor app! Select from hundreds of seismic stations throughout the world. View up-to-the-minute recorded ground motions or see recordings from previous days and past events. Get information about recent events and choose to annotate wave arrivals.
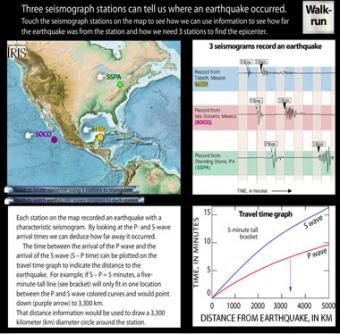
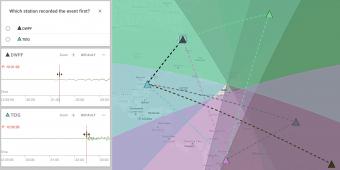
Each station on the interactive map recorded an earthquake with a characteristic seismogram. Roll over the stations to see the epicenter triangulated. Touch buttons to watch movie of seismic waves, or touch "Walk-run" button to see wave travel can be demonstrated with a class.
The arrival times of P and S waves are used to determine the distance to an earthquake using standard travel-time curves.
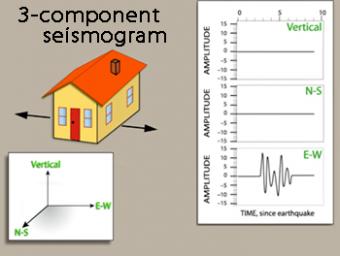
We use exaggerated motion of a building (seismic station) to show how the ground moves during an earthquake, and why it is important to measure seismic waves using 3 components: vertical, N-S, and E-W. Before showing an actual distant earthquake, we break down the three axes of movement to clarify the 3 seismograms.
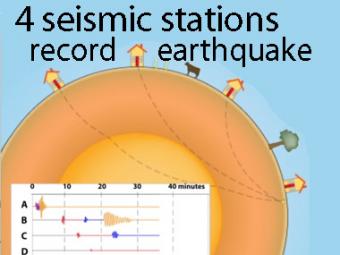
A cow and a tree in this narrated cartoon for fun and to emphasize that seismic waves traveling away from an earthquake occur everywhere, not just at seismic stations A, B, C, and D. A person would feel a large earthquake only at station A near the epicenter. Stations B, C, D, and the cow are too far from the earthquake to feel the seismic waves though sensitive equipment records their arrival.

To understand plate tectonic processes and hazards, and to better understand where future earthquakes are likely to occur, it is important to locate earthquakes as they occur. In this activity students use three-component seismic data from recent earthquakes to locate a global earthquake.
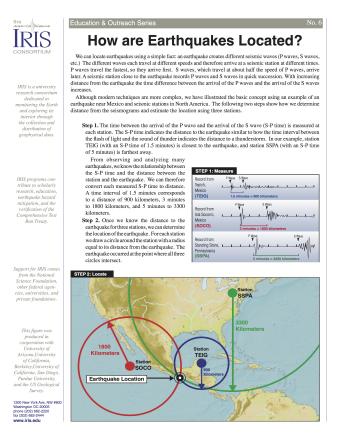
Knowing precisely where an earthquake occurred is an important piece of scientific information. It can help seismologists identify and map seismic hazards. It is also a fundamental piece of information necessary for facilitating studies of Earth's internal structures. This fact sheet provides an overview of the S-P process to locate an earthquake.
NOTE: Out of stock; self-printing only.