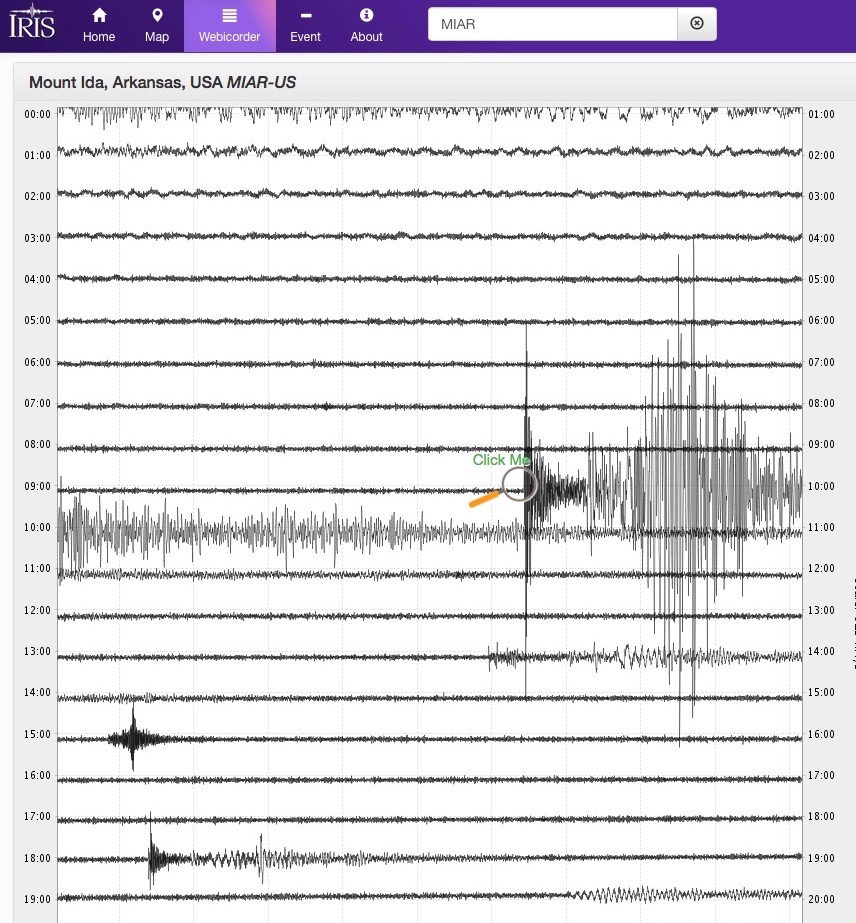
The Station Monitor, which is both mobile and desktop friendly, allows you to easily answer the question “Did the ground move near me?” You can quickly find a station near you or search a global station map to explore recent ground motions, learn about recent earthquakes, and see recordings from past large earthquakes. Station hosts and anyone else who has an interest in a particular station can view and compare daily recordings from their station.
This tool is also available as a downloadable app for phones and tablets.
To complement this app, sign up for our Recent Earthquake Teachable Moment presentations which are created by our group following earthquakes >M 7 worldwide. From pulldown menu, select "Education" and "Recent Earthquakes Teachable Moments"
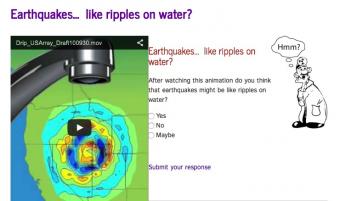
An interactive website, where one can investigate the classic Earth science analogy; "Seismic waves radiate outward from an earthquake's epicenter like ripples on water".
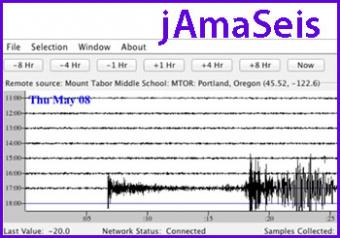
jAmaSeis is a free, java-based program that allows users to obtain and display seismic data in real-time from either a local instrument or from remote stations.
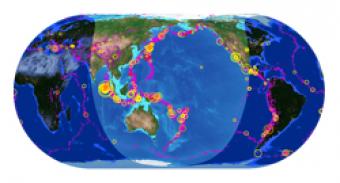

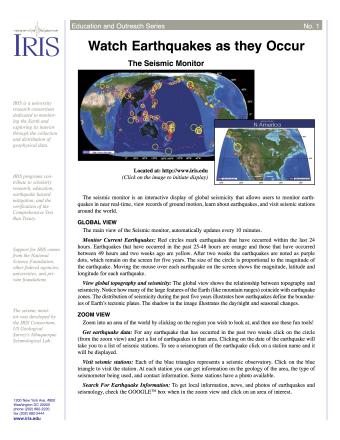
Explore earthquakes near you or from around the globe using the new IRIS Station Monitor app! Select from hundreds of seismic stations throughout the world. View up-to-the-minute recorded ground motions or see recordings from previous days and past events. Get information about recent events and choose to annotate wave arrivals.
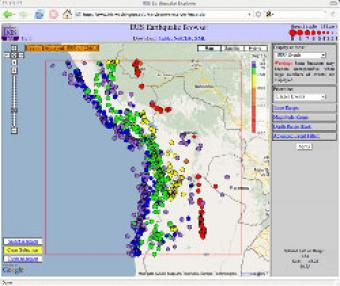
The IRIS Earthquake Browser (IEB) is an interactive tool for exploring millions of seismic event epicenters (normally earthquakes) on a map of the world. Selections of up to 5000 events can also be viewed in 3D and freely rotated with the 3D Viewer companion tool.
jAmaSeis is a free, java-based program that allows users to obtain and display seismic data in real-time from either a local instrument or from remote stations.
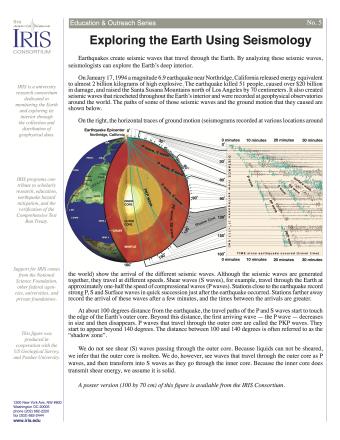
Earthquakes create seismic waves that travel through the Earth. By analyzing these seismic waves, seismologists can explore the Earth's deep interior. This fact sheet uses data from the 1994 magnitude 6.9 earthquake near Northridge, California to illustrate both this process and Earth's interior structure.
NOTE: Out of Stock; self-printing only.
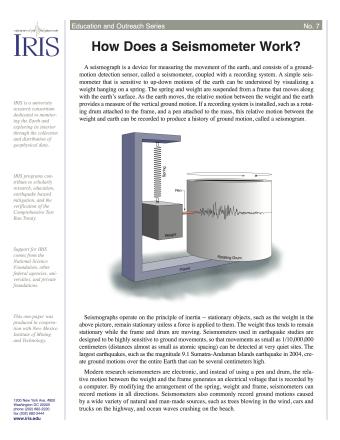
A seismograph is a device for measuring the movement of the earth, and consists of a ground-motion detection sensor, called a seismometer, coupled with a recording system. This fact sheet provides an overview of the basic components of a seismometer and physical science principles behind its operation.
NOTE: Out of Stock; self-printing only.
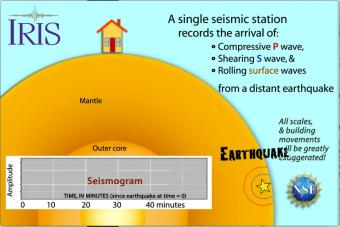
Seismic waves travel through the earth to a single seismic station. Scale and movement of the seismic station are greatly exaggerated to depict the relative motion recorded by the seismogram as P, S, and surface waves arrive.
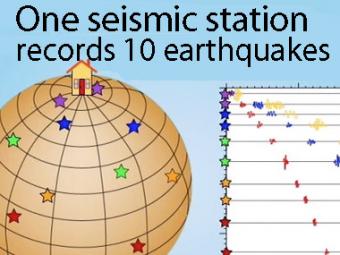
A gridded sphere is used to show:
1) the seismic stations don't need to be lined up longitudinally to create travel-time curves,
as they appear in the first animation, and
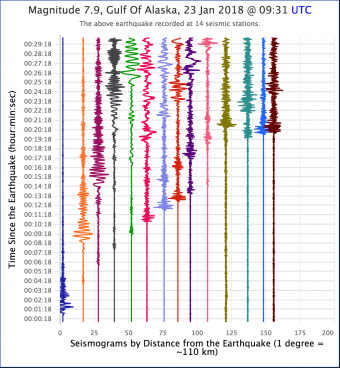
2) a single station records widely separated earthquakes that plot on the travel-time curves.
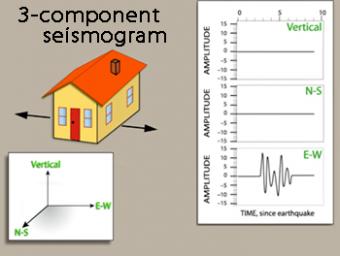
We use exaggerated motion of a building (seismic station) to show how the ground moves during an earthquake, and why it is important to measure seismic waves using 3 components: vertical, N-S, and E-W. Before showing an actual distant earthquake, we break down the three axes of movement to clarify the 3 seismograms.
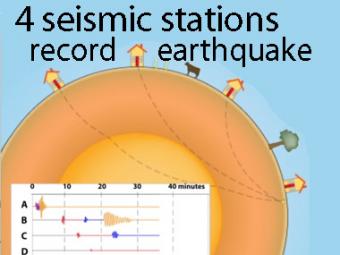
A cow and a tree in this narrated cartoon for fun and to emphasize that seismic waves traveling away from an earthquake occur everywhere, not just at seismic stations A, B, C, and D. A person would feel a large earthquake only at station A near the epicenter. Stations B, C, D, and the cow are too far from the earthquake to feel the seismic waves though sensitive equipment records their arrival.
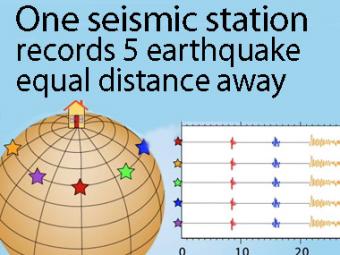
A gridded sphere is used to show a single station recording five equidistant earthquakes.
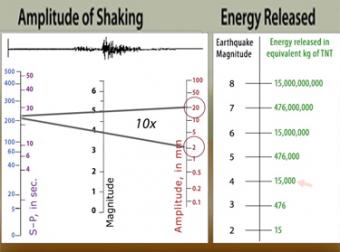
The "moment magnitude" scale has replaced the Richter scale for large earthquakes. Scientists have developed far-more sensitive seismometers that, with faster computers, have enabled them to record & interpret a broader spectrum of seismic signals than was possible in the 1930's, when the Richter magnitude was developed. Find out what scientists learn from seismograms.
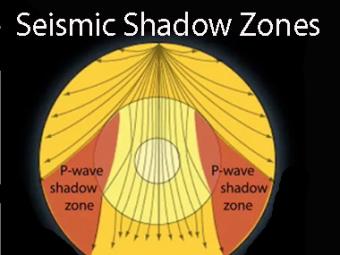
Seismic shadow zones have taught us much about the inside of the earth. This shows how P waves travel through solids and liquids, but S waves are stopped by the liquid outer core.
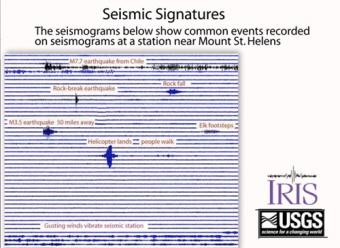
Seismograms of common events are compiled to show the different seismic signals recorded by ground-shaking events. Seismograms can record everything from nearby earthquakes to earthquakes on the other side of the world, plus anything that shakes the ground near the seismograph station like people walking, elk running, rocks falling and helicopters landing.
This USGS video provides a tutorial for anyone interested in interpreting the seismic records on public webicorder displays. Seismometers measure vibrations. More vibration… more wiggle. Some seismometers measure only up and down; some measure up-down, north-south, and east-west motion.
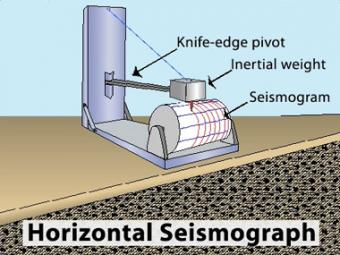
Animation of the principles of a drum-style horizontal seismograph station that records back- and-forth (N-S, E-W) movement.
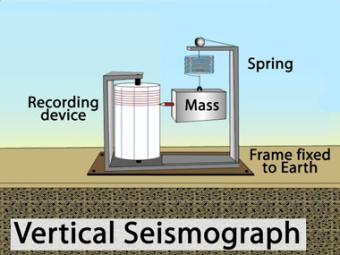
Animation of the principles of a drum-style vertical seismograph station that records up-and-down movement.
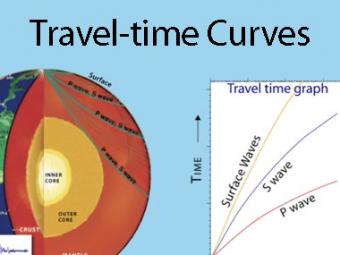
A travel time curve is a graph of the time that it takes for seismic waves to travel from the epicenter of an earthquake to the hundreds of seismograph stations around the world. The arrival times of P, S, and surface waves are shown to be predictable. This animates an IRIS poster linked with the animation.
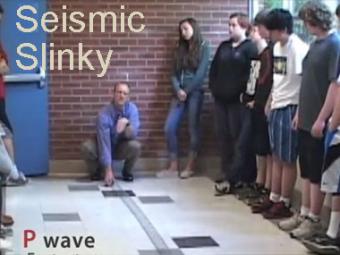
A video demonstration of how a slinky can be a good model for illustrating P & S seismic waves movement.
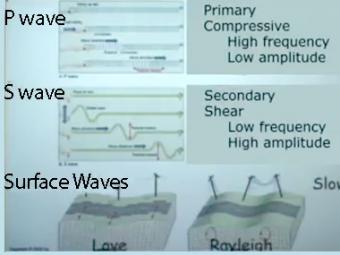
Video lecture on wave propagation and speeds of three fundamental kinds of seismic waves.
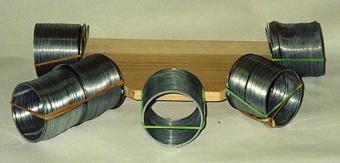
The slinky is an effective tool for the demonstration seismic wave characteristics and wave propagation. Slinkys can be used both individually and in various combinations to demonstration different concepts.

Working in both small groups and as a whole class, students investigate the classic Earth science analogy: "Seismic waves radiate outward from an earthquake's epicenter like ripples on water". A discrepant image connects the unfamiliar concept of the spreading out of seismic waves to the more familiar scenario of ripples on water radiating outwards in all directions after a droplet falls onto a pool.
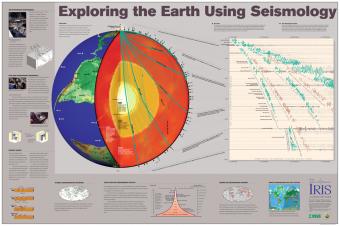
Seismic waves from earthquakes ricochet throughout Earth's interior and are recorded at geophysical observatories around the world. The paths of some of those seismic waves and the ground motion that they caused are used by seismologists to illuminate Earth's deep interior.