
By Alka Tripathy-Lang and Wendy Bohon
Wildfires will become more frequent—especially in the western United States—because of a combination of forest mismanagement and climate change, the latter of which lengthens fire season. As wildfires raze anything in their paths, they also leave behind additional hazards. In steep terrain, post-wildfire debris flows—fast moving, dangerous landslides—pose a substantial threat to life, property and infrastructure because fire turns stabilizing vegetation to soot and creates soil conditions that repel water.
On July 21, 2019, north of Flagstaff, Arizona, the Museum Fire burned about eight square kilometers of mountainous terrane previously blanketed in ponderosa pine forests. To explore what might trigger dangerous debris flows after fires blazed through, as well as ways to monitor such flows of rock in action, researchers from Northern Arizona University, led by Ryan Porter, deployed university-owned Nanometrics Meridian Post hole systems along with geophones from IRIS PASSCAL. Their initial findings, published in Frontiers in Earth Science, highlight how seismic signals, along with cameras and rainfall information, can assist scientists in post-wildfire debris flow monitoring and management. The data are publicly available from the IRIS DMC for further analysis.
 In early August of 2019, as soon as the smoldering fire cooled enough for scientists to safely access the burn area, Porter and his team deployed the first batch of instruments. The deployment lasted until November 2019, designed to overlap with Arizona’s monsoon season that annually brings intense rains to the otherwise parched region between July and September. The 2019 monsoon season, however, was the driest on record for Flagstaff, and only a few debris flows pitched and plummeted through the burn area.
The lack of rain—and large debris flows—meant that significant amounts of sediment still resided in the charred channels, so Porter and his team deployed another thirteen seismometers to the same area the following year, beginning in June and July of 2020. The second deployment lasted until October of 2020, with the 2020 monsoon season overtaking the previous year as the driest on record. Nevertheless, at least three small-magnitude debris flows occurred during a single storm on July 24, 2020, which dropped about 18 millimeters of water in just one hour.
In total, the two deployments caught eight debris flows during three rainfall events in the 2019 and 2020 monsoon seasons.
As debris flows fall downhill, tumbling rocks can generate seismic energy with each collision of rock with ground. Such flows tend to follow channels floored by either hard, solid bedrock or soft, unconsolidated sediments. Unsurprisingly, bedrock channels produce greater seismic energy when a debris flow clangs by.
By combining seismic data from several stations distributed relatively close to a debris flow, scientists can track the slides as they move. But installing seismic stations in appropriate locations can be tricky. Too close, and the instrumentation might be swept away in the cacophony. Too far, and the seismometers might not pick up the banging rocks. To protect the instruments from becoming entrained in a debris flow, Porter and his team installed seismometers in shallow holes near steep drainages, anchoring the digitizer boxes to trees to keep them from sliding downhill. The trees also provided protection to the instruments from errant downhill-directed debris and heli-mulching, where a helicopter drops mulch into regions at risk of erosion.
The trees, though useful for stability, posed a different problem related to power. Branches and leaves sheltered the solar panels from the sun, causing the stations to lose power in 2019. In 2020, the deployment included larger solar panels to account for the shade.
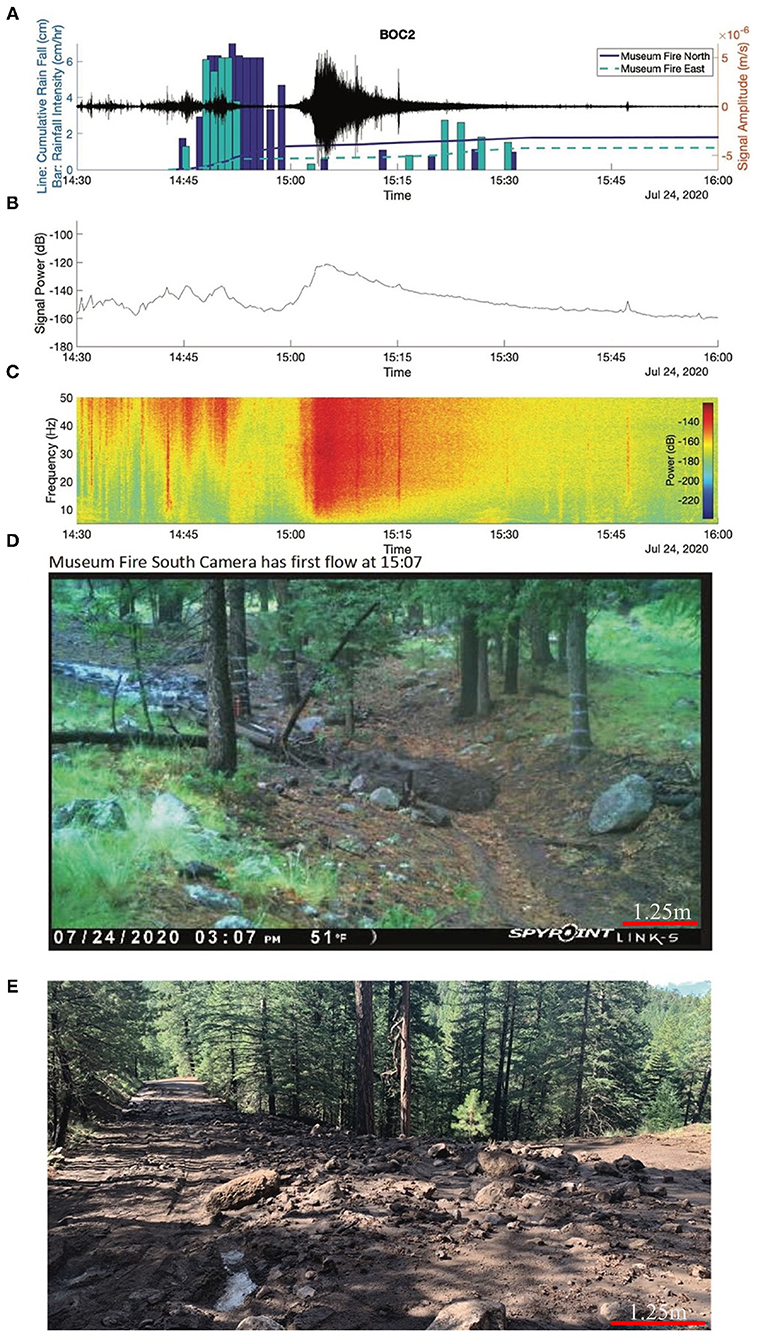
During the July 24, 2020 storm that occurred more than a year after the initial fire, rainfall concentrated in the northern portion of the burn area. The debris flows produced by the storm, later examined by Porter and his colleagues, contained meter-sized boulders and cobbles in the upper reaches and gravel-to-sand-sized material further downstream. Photographic evidence from one of the flows—caught on a wildlife camera—saw this grain size change in near-real-time, says Porter.
Turning to the seismic data, Porter’s team had to disentangle three components that, together, yield a seismogram. The first component, the source-time function, is the signal of interest, which, in this case, was caused by the debris flows as they crashed downward. Source-time functions, explains Porter, include any source of energy. This can include lightning, planes overhead, or even earthquakes, he says.
The second component is the Green’s function. “If I yell in a canyon,” says Porter, “my voice is the [source-time function, but] the echoes that come back are the result of the canyon’s shape and size.” Similarly, the Green’s function accounts for how the earth’s structure beneath the surface of a seismic station modifies the signal.
The third component to any seismogram, says Porter, “is how the instrument converts ground motion into a signal we can record and see.” This component is removed early during data processing, leaving the first two components to be disentangled from one another. Both the source-time function and Green’s function can also change as sediment is removed or deposited during a debris flow, making this a difficult problem to solve, and the subject of future work.
Porter’s team also noted that different frequencies recorded in the seismic signal pertain to different sources of seismicity. For example, high frequency noise prior to debris flows most likely resulted from the patter of rain. Impulsive signals that caused vibrations at many frequencies and correlated with lightning strikes most likely record crashes of thunder. Debris flows themselves excited a wide range of frequencies, and the 10 to 40 Hertz range appears to indicate whether giant boulders or murky mud is coursing by. Future work will need to confirm this.
The 2021 monsoon season was wetter than the previous two years, and results from that are forthcoming, says Porter.
Figure 1. (A) Ground velocity from seismic station BOC2 and rain gauge data from Museum Fire North and Museum Fire East gauges for debris flow on July 24, 2020. (B) Signal power. (C) Power spectral density plot. (D) Motion-activated game camera image of the mudflow arriving at camera location at 15:07, or 3:07 p.m. (E) Photo of upper-basin debris flow deposits from this event
Citation: Porter R, Joyal T, Beers R, Loverich J, LaPlante A, Spruell J, Youberg A, Schenk E, Robichaud PR and Springer AE (2021) Seismic Monitoring of Post-wildfire Debris Flows Following the 2019 Museum Fire, Arizona. Front. Earth Sci. 9:649938. doi: 10.3389/feart.2021.649938
