
by Dr. Wendy Bohon
Wind gusts are intense, short-lived, natural hazards that can damage forests and infrastructure and represent a threat to aviation safety. Despite their importance, they are undersampled by current meteorological networks. However, densely spaced, high-resolution seismic networks like the Transportable Array may provide an opportunity to detect and study wind gusts in more detail. Scientists have long known that atmospheric phenomena cause noise in seismic data, but until now there has been no dedicated effort to determine if wind gust occurrence and magnitude can be reliably extracted from seismic data.
A research team from Cornell University and the University of California San Diego are testing a potentially transformative concept originally proposed in Pryor et al. [2014]: Use of seismic data from the Transportable Array (TA) of the EarthScope program to detect, characterize and quantify extreme sustained wind events and wind gusts across the contiguous US. Using different types of data they are determining: 1) under what conditions high surface winds (both sustained winds and gusts) produce a signal in the seismometers, 2) the frequency of the signal, 3) and if it’s possible to generalize the relationship between wind gust size and seismic response. Their results so far indicate that they can accurately use seismometers to detect the presence of wind gusts across a range of geographical settings by using the variance of seismic data in the frequency range of 0.01 to 0.1 Hz [Hu et al. 2017a]. Further, using wavelet analysis and other statistical tools they have demonstrated that the variability of changes in the seismic data in this frequency range also gives important information about the size of wind gusts.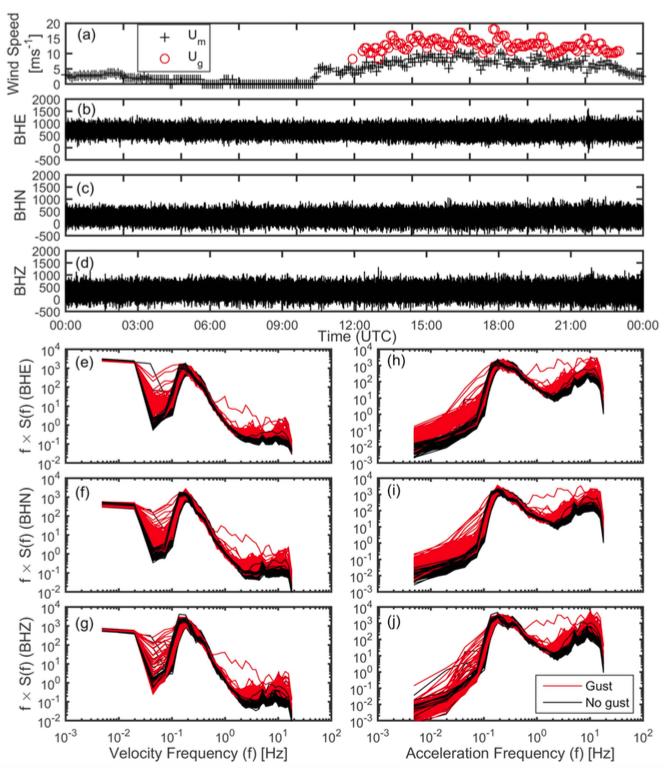
This project is funded by the National Science Foundation: Physical and Dynamical Meteorology program (Improved detection and quantification of wind gusts, PIs: Pryor (Cornell U), Barthelmie (Cornell U) and Vernon (UCSD))
Under seperate funding the Cornell team are also testing a related and equally potentially transformative concept - use of data from seismographs in condition (i.e. health) monitoring of wind turbines using seismometers from the PASSCAL center deployed at an operating wind farm in upstate New York [Hu et al. 2017b].
Project web site: http://www.geo.cornell.edu/eas/PeoplePlaces/Faculty/spryor/Gust/index.html
Figure: Record of wind speeds and seismic data at the TA-ASOS (Automated Weather Observing System) station pair H58A-KSLK on February 26, 2014 and power spectral analyses of wind speed. Red indicates gusts, black indicates no gusts. Um is mean wind speed and Ug is gust speed. (a) The 5 min mean wind speed from station KSLK; (b–d) time series of raw velocity data from the E, N and Z components, respectively, at the nearby TA station (H58A); (e–g) power spectra of velocity data of E, N, and Z; and (h–j) power spectra of acceleration of BHE, BHN, and BHZ, respectively (from Hu et al. 2017a).
Painting (cover): "The Gust of Wind" by Gustave Courbet, Oil on canvas, circa 1865
References:
Hu W., Pryor S.C., Letson F. and Barthelmie R.J. (2017b): Using seismic analyses for the wind energy industry. Journal of Solar Energy Engineering (SOL-17-1079, in press).
Hu W., Pryor S.C., Letson F., Tytell J., and Barthelmie R.J. (2017a): Investigation of gust-seismic relationships and applications to gust detection. Journal of Geophysical Research: Atmospheres 122 140-151.
Pryor S.C., Conrick R., Miller C.A., Tytell J. and Barthelmie R.J. (2014): Intense and extreme wind speeds observed by anemometer and seismic networks: An eastern U.S. case study. Journal of Applied Meteorology and Climatology 53 2417-2429
