
By: Alka Tripathy-Lang and Wendy Bohon
According to Greek lore, a place of darkness called Erebus lies between Earth and Hades, the ancient mythological underworld. Erebus’s namesakes include a vessel that participated in a 19th century Antarctic expedition led by Sir James Clark Ross, and Earth’s southernmost active volcano, dubbed after Sir James’s sturdy ship.
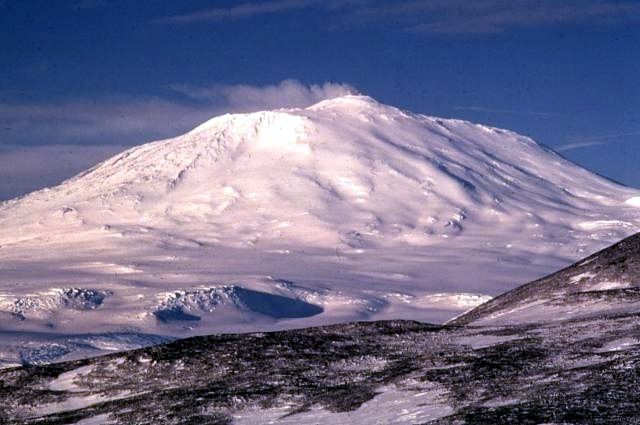 Mount Erebus towers more than 12,000 feet above an icy white landscape on Ross Island, cradling within its summit crater a persistent, active lava lake. Because of Mount Erebus’s near-constant state of eruption and proximity to the U.S. McMurdo Station and New Zealand Scott Base, scientists can carefully monitor the restive peak. But they’re not only tracking volcanic activity, but also the ice that blankets the island. In particular, the icy shell hosts numerous processes detectable by seismic sensors, including shallow shivers within the ice when it breaks—icequakes.
Because Mount Erebus perpetually erupts, differentiating between magma churning through the volcano’s underground tunnels versus seismic shudders encased wholly within the overlying ice can prove problematic. In a recent paper published in Seismological Research Letters, Chenyu Li, currently a postdoc at Earth Observatory of Singapore, and her coauthors show how to differentiate between the two similar signals, while also pinning certain increases in seismicity to stress changes imparted by distant earthquakes.
Seismic stations located on and around Mount Erebus have been listening to the sprightly crag since the 1980s. In recent years, temporary arrays have been deployed to capture the volcano’s plumbing in action as it pipes magma to the ever-present lava lake. In the current study, Li, who conducted this research during her doctoral studies at Georgia Institute for Technology under the advisement of Zhigang Peng, examined data from the permanent Mount Erebus Volcano Observatory stations (MEVO) and the Global Seismograph Network station IU.SBA, located near Scott Base. These data are available from the IRIS DMC.
With this wealth of information, collected between 2000 and 2017, they examined microseismicity—small-scale underground rumbles no greater than magnitude-4—to search for tiny tremors triggered by distant earthquakes.
 Li and her colleagues began by selecting 56 earthquakes with magnitudes greater than 7.0 that ruptured rock more than 1000 kilometers away from Mount Erebus. Specifically, they predicted that the surface waves produced by these earthquakes would have great stress changes (larger than one kPa) at station IU.SBA.
Of those 56 earthquakes, only 43 were detected by multiple stations located on Ross Island. By looking at data on the days before and after each earthquake, Li and her colleagues extracted seismic signals that could result mostly from either eruptions or icequakes.
Differentiating between volcano-tectonic earthquakes versus icequakes could theoretically be done by depth, which would distinguish between seismicity that began in ice versus the underlying substrate. However, because of the relatively sparse seismic network, depths are not well-constrained. Instead, they compared the time of detected microseismicity with an eruption catalog of nearly 3000 eruptions spanning 2003 to 2012. For 2013 and beyond, they identified eruptions by filtering for signals that most closely matched lava lake eruptions, called the “boomer” signal that was derived from 18 eruption events during 2006.
Additionally, locations of seismicity that fell atop the crater suggested that those were eruptive earthquakes, whereas events on the sides of the mountain likely reflect the trembling of icequakes. In part, this is because the ongoing eruption constantly releases volcanic gasses to the atmosphere, presenting an obstacle for stress to increase to the point of rupturing rock.
Li and colleagues detected 7,390 events one day before and after the origin time, and 213 events during the surface wave window for those 43 far-off earthquakes. The preceding quakes provide the background signal to test whether the post-quake tremblings could be triggered, or not.
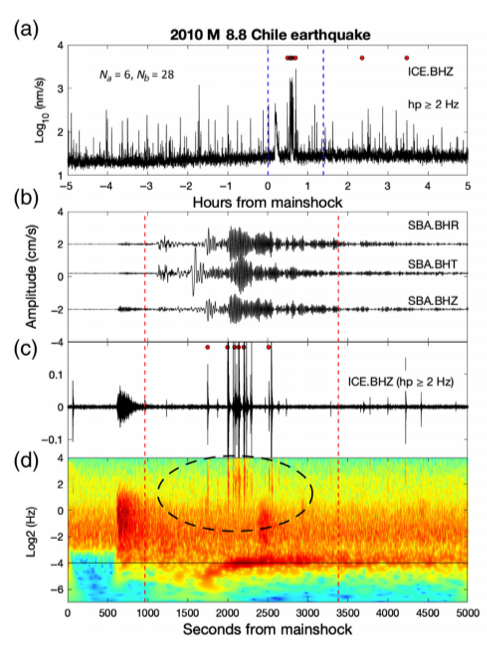 The most robust evidence of triggered seismicity at Mount Erebus occurred during the magnitude-8.8 Maule earthquake in Chile that struck on Feb. 27, 2010. During and after the Rayleigh waves passed by, local seismic signals spiked, Li found.
Though the magnitude-8.6 Indian Ocean earthquake of April 11, 2021 didn’t exhibit as clear a signal as the Maule earthquake, Li again observed that local, high frequency energy spiked as Rayleigh waves from the big quake rolled through.
In addition to these two notable events, another 30 of the 43 earthquakes may have triggered local seismicity, with at least one event appearing during each Rayleigh wave window. In particular, four large earthquakes—the magnitude-8.0 and magnitude-7.8 Solomon Islands earthquakes that occurred on February 6, 2013 and December 8, 2016, respectively, the magnitude-8.0 Tonga earthquake on May 3, 2006, and the magnitude-9.1 Sumatra earthquake on December 26, 2004—have no clear evidence of triggering, but need a closer look.
Triggered icequakes tended to occur in the austral spring, summer and fall, with oddly active icequake spikes rending glaciers during the Antarctic winter (May to October). However, Li and her coauthors point out that wind-related noise can mask small seismic signals, making such triggering difficult to identify.
Further observations immediately following large magnitude earthquakes from beyond 1000 kilometers would help scientists understand how, where and when icequakes occur. Alternatively, smaller, nearer earthquakes might also have triggered icequakes in the white cloak of Mount Erebus. Continued seismic monitoring of both this and other ice-bound land will help scientists understand how stress triggers movement in Earth’s rapidly changing cryosphere.
Figure 1. Mt. Erebus. Photo by Richard Waitt, U.S. Geological Survey
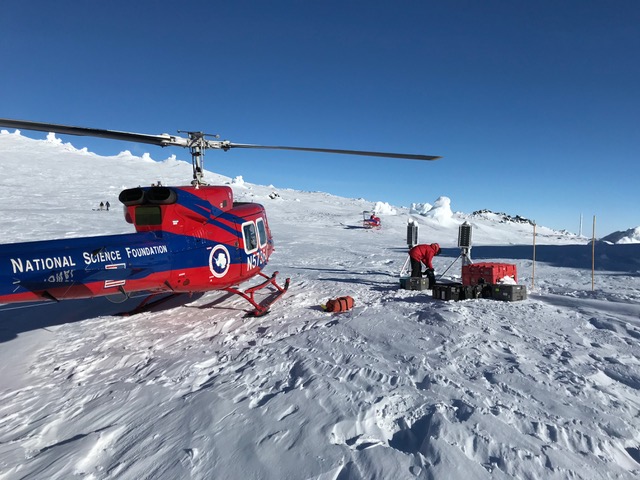
Figure 2. Installing seismometers on Mt. Erebus. Photo by Robert Woodward, IRIS.
Figure 3. (a) 2 Hertz high-pass-filtered envelope function obtained using the Hilbert transform for 5 hours before and after the 27 February 2010 magnitude-8.8 Maule, Chile, mainshock at station ICE. Red circles mark the events detected and located in this study, dashed blue lines are the zoom-in time window in panels (b)–(d). (b) Unfiltered three-component waveforms in SBA during the Maule mainshock. (c) High-pass-filtered waveform and (d) continuous wavelet transform of the vertical component showing both long-period signals from the Maule mainshock and local high-frequency signals. We have circled the high-frequency signals for readers to find them easily. The gliding signal starting around 1700 seconds corresponds to the dispersive surface wave of the mainshock. The black line in (d) marks the period of 16 seconds.
Cover Photo. Mt. Erebus. Photo by Robert Woodward, IRIS.
Li, C., Z. Peng, J. A. Chaput, J. I. Walter, and R. C. Aster (2021). Remote Triggering of Icequakes at Mt. Erebus, Antarctica by Large Teleseismic Earthquakes, Seismol. Res. Lett., 1–10, doi: 10.1785/ 0220210027
