
by Dr. Wendy Bohon
The 2014 Mw 6.0 South Napa earthquake occurred on the West Napa Fault Zone (WNFZ) and caused damage in and around the City of Napa. Observed surface rupture from the earthquake extended over a broad zone and was approximately 12-km long; however, the rupture may have been longer as marshland to the south would not have preserved evidence of surface faulting.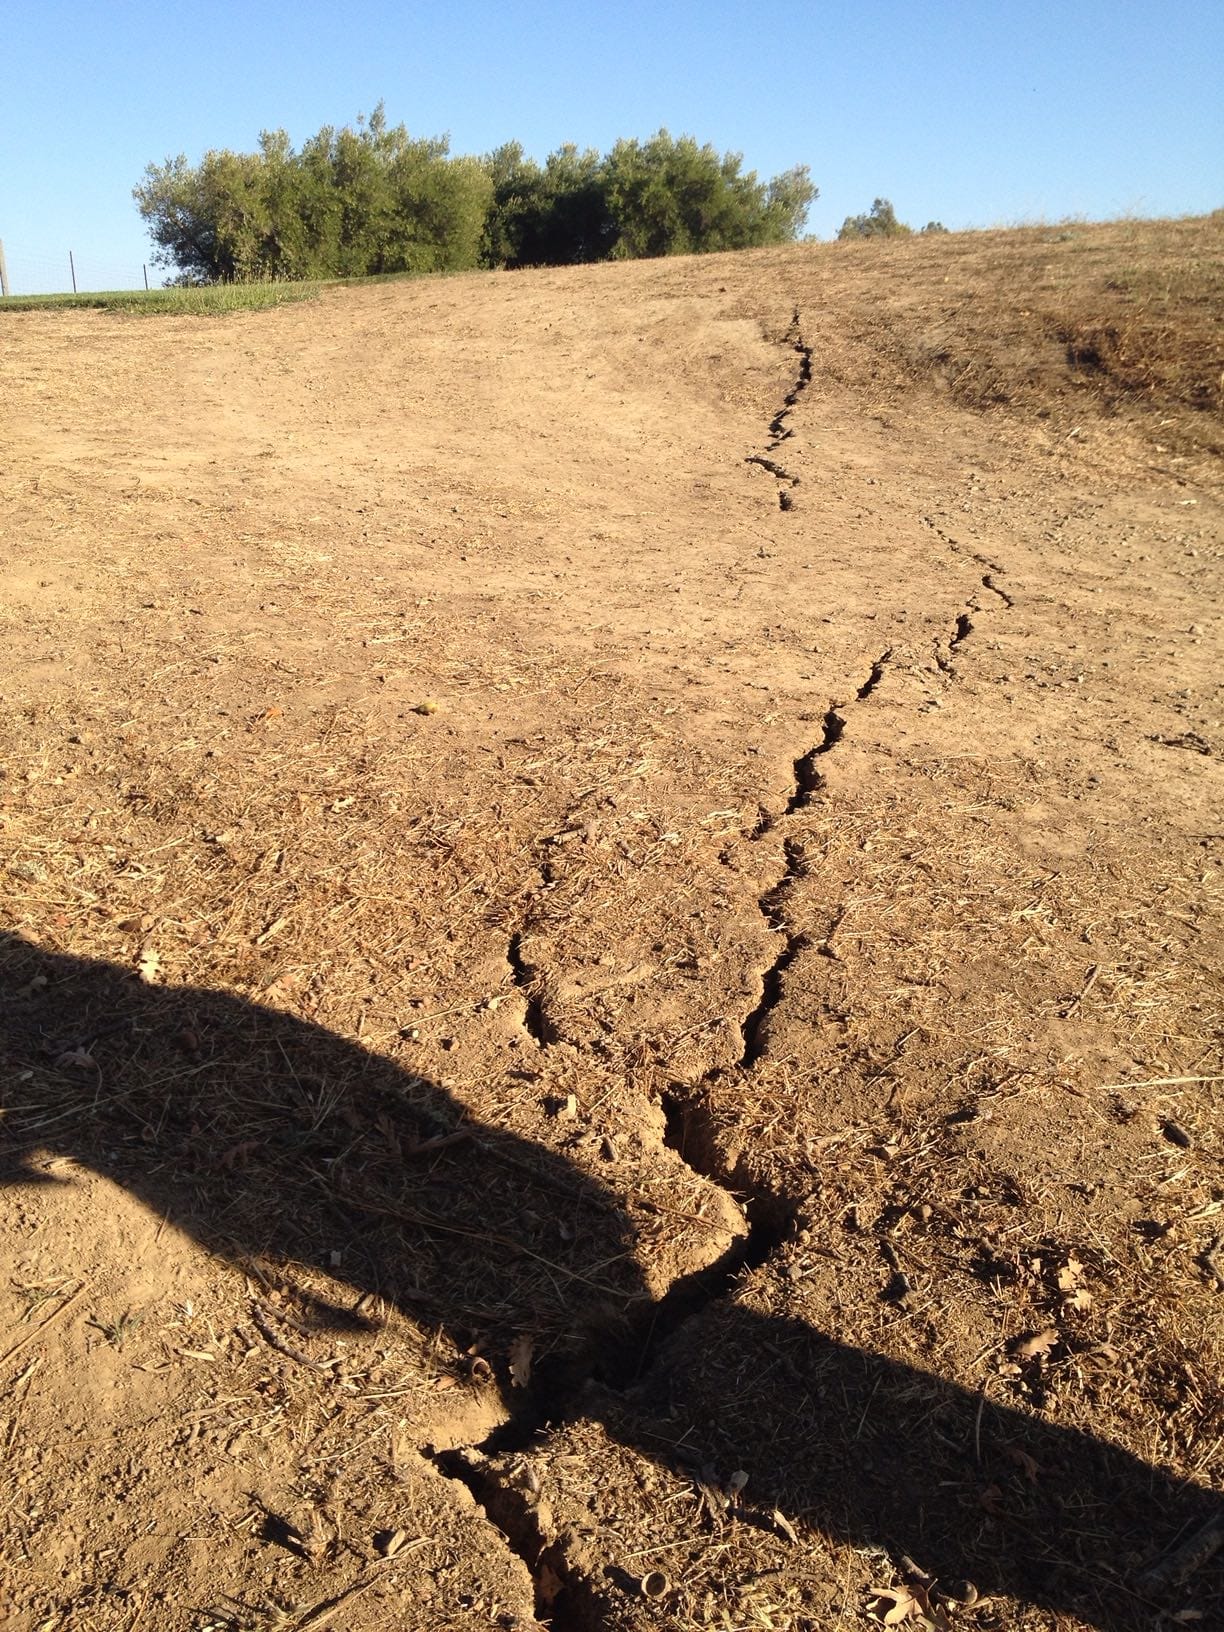
In order to more accurately determine the length and continuity of the WNFZ and other nearby faults, US Geological Survey researchers deployed three arrays of seismometers, provided by IRIS PASSCAL, across the WNFZ. These seismometers recorded high amplitude guided waves produced by earthquakes generated within the WNFZ . Because guided waves only travel within fault zones that are connected to the fault that generated a particular earthquake, the presence of guided waves in other nearby fault zones demonstrates that the faults are connected.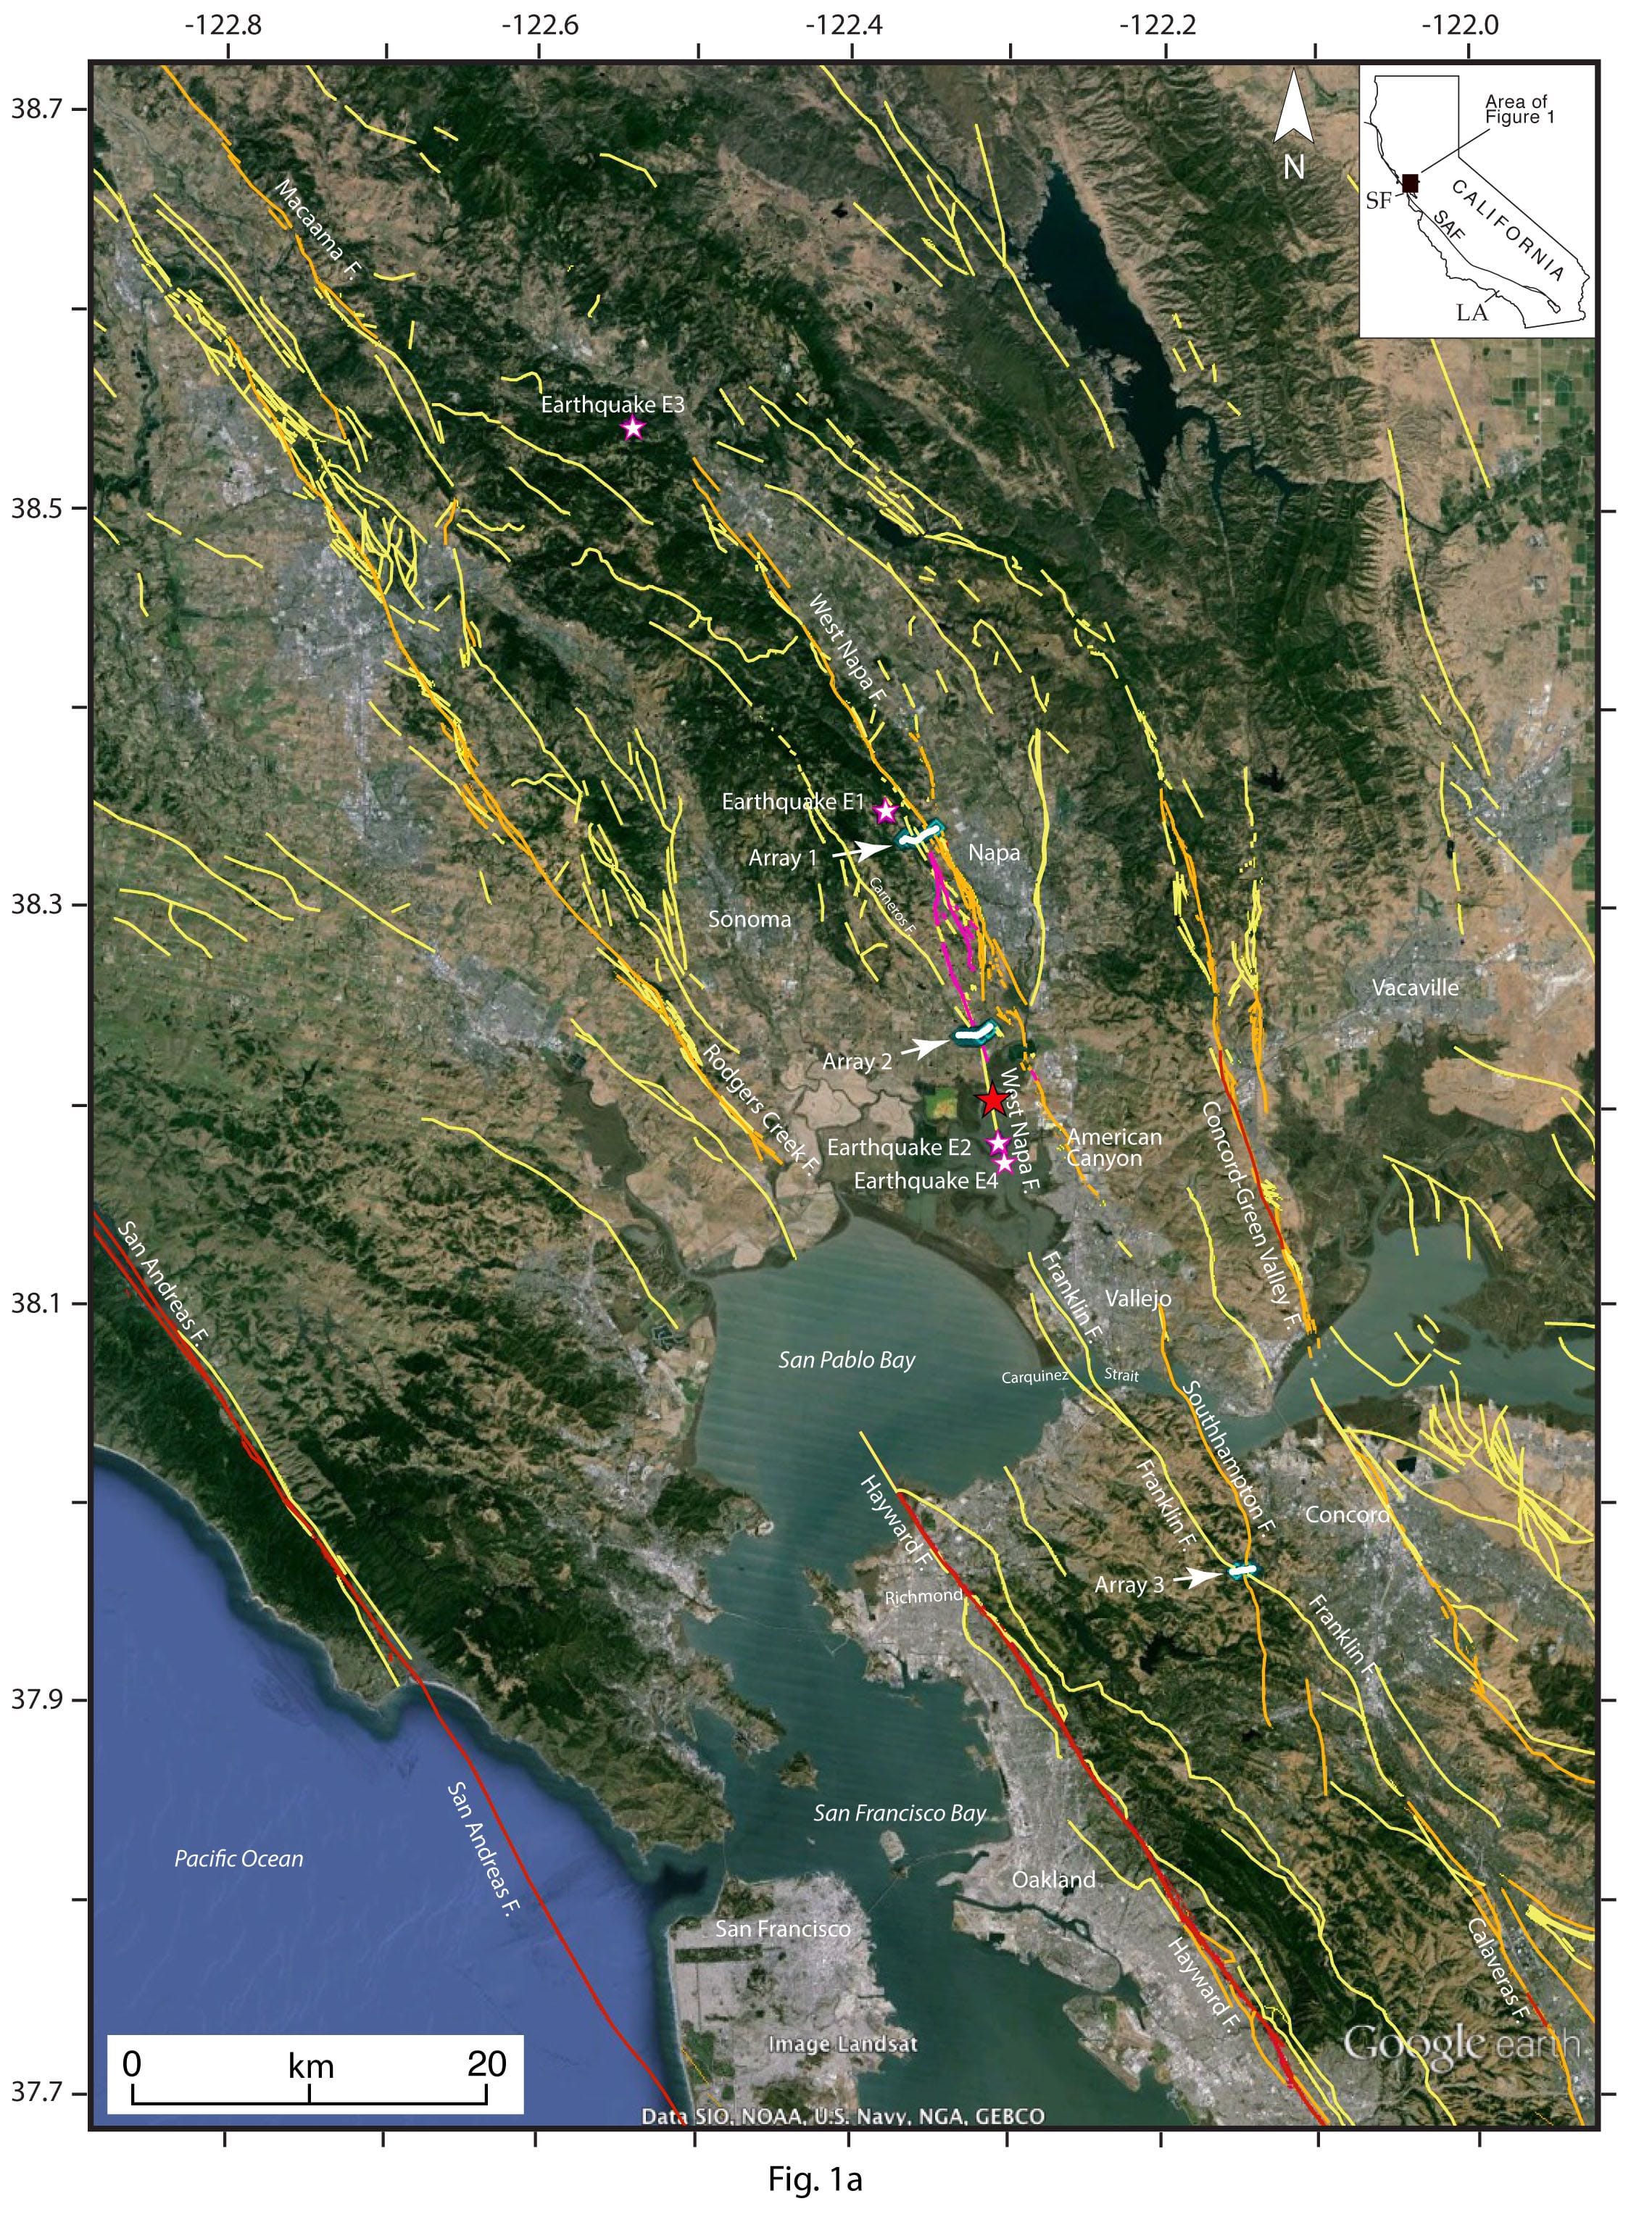
Using seismic data collected from the array deployment, as well as fault structure and gravity data, the researchers were able to surmise that the WNFZ and the nearby Franklin Fault are linked and form one continuous fault zone that is more than 75-km long. Other researchers have previously linked the WNFZ with the Maacama Fault to the north. Similarly, data suggest that the Franklin Fault is also linked to the Calaveras Fault to the south. The combined length of these four faults is >300 km, which is similar in length to the San Andreas Fault in the San Francisco Bay area, and may be capable of producing M7.5 or greater earthquakes if all fault segments were to rupture together. Additionally, the authors found that guided wave seismic energy traveling along the WNFZ was highly amplified. This seismic wave amplification could cause concentrated damage to population centers within the broad fault zones of this region and may account for the pattern of damage observed around Napa after the 2014 event.
Photograph (Cover) - Seismic instrument deployement along the WNFZ. (Photo from Dr. Rufus Catchings)
Photograph (Top) - Surface rupture from the 2014 Mw 6.0 South Napa earthquake. (Photo from Dr. Rufus Catchings)
Figure 1 (left) - Google earth image showing the northern San Francisco Bay area, recording arrays (A1, A2, and A3 in white with blue background), analyzed earthquakes (white stars with magenta outline), the Mw 6.0 mainshock (red star), various cities, and faults. The magenta lines show the surface rupture associated with the Mw 6.0 mainshock, the red lines show historically active faults, the brown lines show Holocene faults, and the yellow lines show Quaternary faults. The inset shows the San Andreas Fault (SAF) and the study area within the State of California, relative to the cites of San Francisco (SF) and Los Angeles (LA).
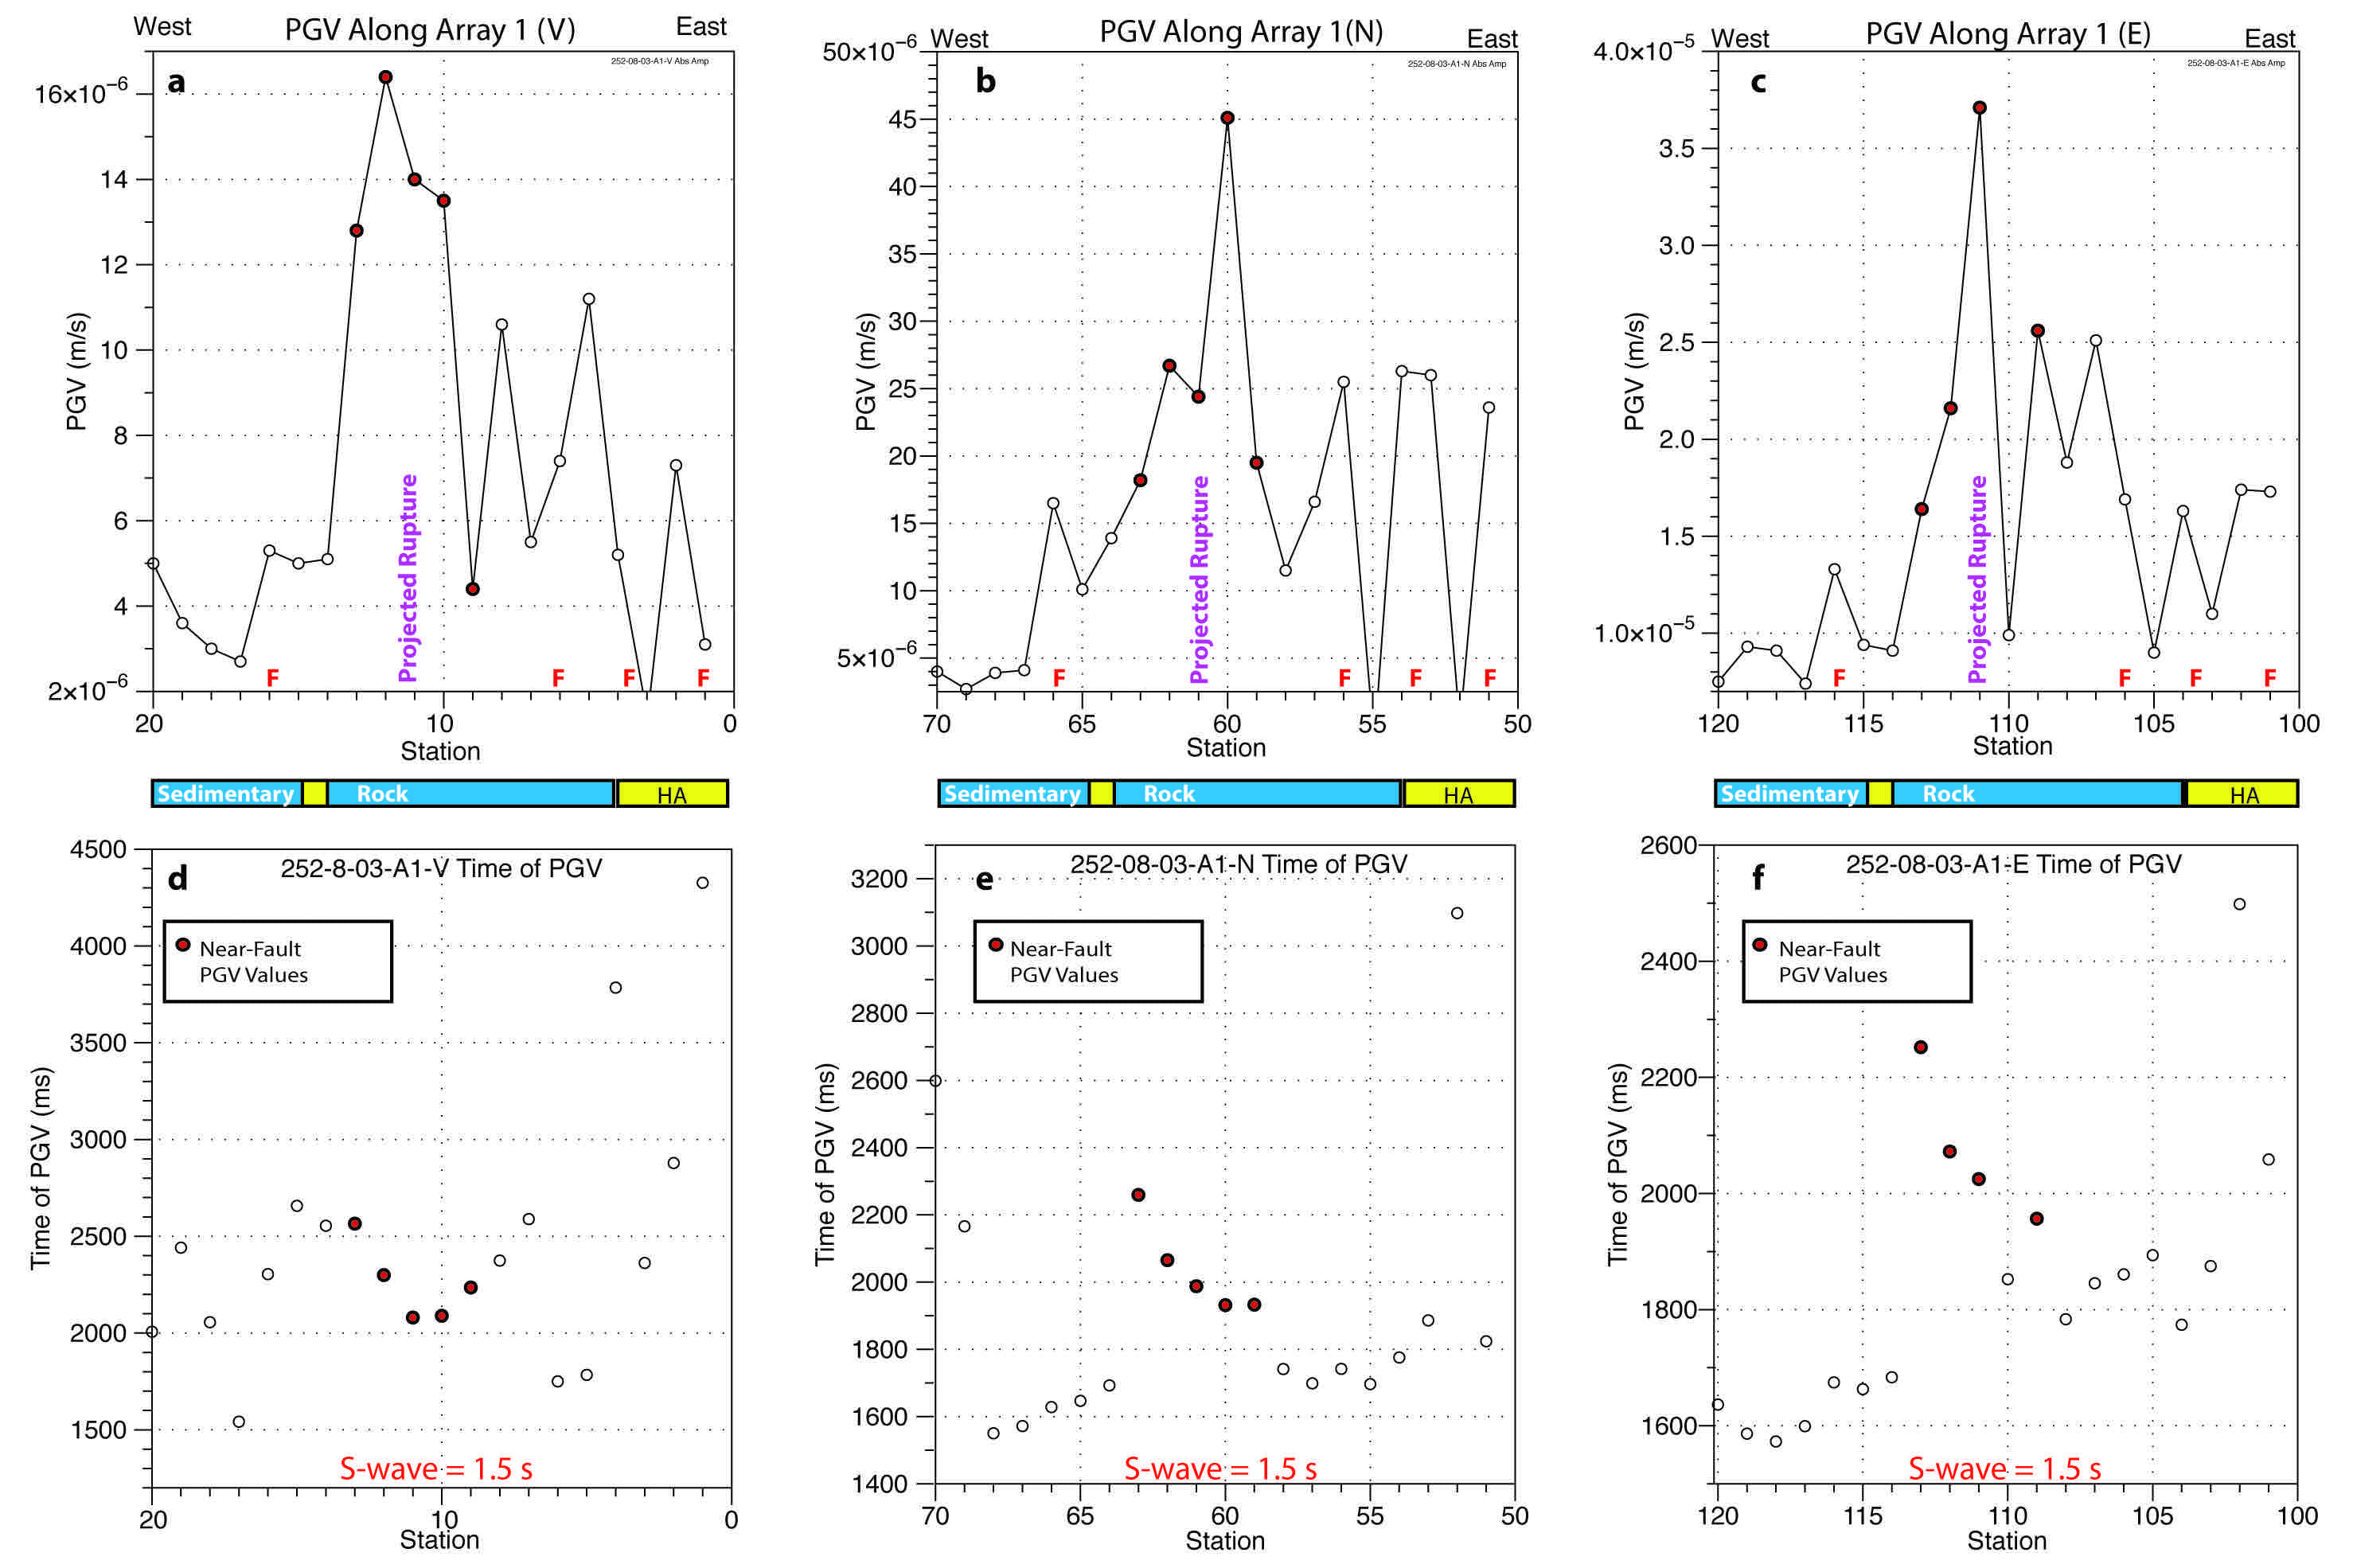
Figure 2 (above) - Example of high amplitudes (peak ground velocity, PGV, in m/s) from guided waves recorded on an array of recording stations deployed across the West Napa Fault zone. PGV for (a) vertical-, (b) north-, and (c) east-component seismograms are shown. “F” shows the locations of mapped faults along the array. “Projected Rupture” refers to the northward projection of the 2014 surface rupture. High-amplitude seismic energy does not correlate with soft sediments (HA = Holocene alluvium) along the array (bars below PGV plots). Travel time of PGV for guided waves recorded on (d) vertical-, (e) north-, and (f ) east-component seismograms. The slower, high-amplitude guided waves travel slower than the S-wave.
Publication:
Catchings, R.D., Goldman, M.R., Li, Y.G. and Chan, J.H., 2016. Continuity of the West Napa–Franklin Fault Zone Inferred from Guided Waves Generated by Earthquakes Following the 24 August 2014 Mw 6.0 South Napa Earthquake. Bulletin of the Seismological Society of America. 106(6) 2721-2746; doi: 10.1785/0120160154
**Companion paper
Li, Y., Catchings, R.D., Goldman, M.R., 2016. Subsurface Fault Damage Zone of the 2014 Mw 6.0 South Napa, California, Earthquake Viewed from Fault‐Zone Trapped Waves, Bulletin of the Seismological Society of America. 106 (6) 2747-2763; DOI: 10.1785/0120160039
Additional information
Scientists Deploy Seismographs in Napa Valley (USGS)
Aftershock Deployment in Wine Country (IRIS Passcal)
