by Dr Alka Tripathy-Lang
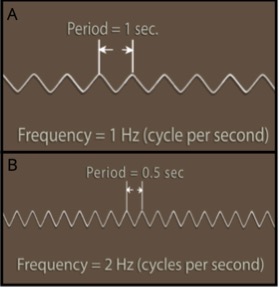
Seismology is the study of earthquakes and the resulting seismic waves that move both through and around Earth. Modern seismometers measure these waves as 3 separate components – up-down, north-south, and east-west. The ability of these seismometers to measure seismic waves produced by small earthquakes is limited by background noise that is often broadband in nature. Here, broadband noise means that high frequency (5-15 Hz), intermediate-period (1-20 s periods) and long-period (> 20 s) signals are all affected. As a reminder, Hertz (Hz) is a measure of frequency, and is the inverse of period, which is the time it takes to complete a cycle. 1 Hz is 1 cycle/second; 2 Hz has a higher frequency and shorter period and wavelength than 1 Hz (Figure 1). Wind-induced noise is a particular problem in seismology because wind can couple with the ground, causing the ground to tilt. This tilt is on the scale of nanometers. To put that in perspective, a human hair is 80,000 nanometers thick. Such seemingly insignificant movements of the ground can drown out a seismic signal across a wide bandwidth.

To address the problem of wind-related seismic noise at small spatial scales, undergraduate Sydney Dybing worked with Dr. Adam Ringler and other scientists at the Albuquerque Seismological Laboratory (ASL), part of the USGS, from June-August of 2018 as part of the 2018 IRIS Summer Internship Program. This research culminated in the publication of Dybing et al., (2019) in the Bulletin of the Seismological Society of America. In this work, they coupled closely spaced weather sensors (~100 m) with data from nearby seismometers to understand how wind-induced noise changes between closely spaced seismometers.
The first part of this project involved setting up the array itself. Dybing and her ASL mentors installed a second weather sensor ~100 m away from one that was already there. This allowed them to examine whether barometric pressure and wind-induced noise are directly related, as is often assumed. In addition to four seismometers installed on granite bedrock at varying depths and in different styles at this location, they installed a fifth seismometer in unconsolidated sediment. This configuration allowed them to test the spatial variation associated with style of installation (borehole versus vault), depth (shallow versus deep), and substrate (unconsolidated sediment versus granite bedrock).
Let’s begin by breaking down each of these tests. When seismologists talk about installation, they are usually talking about either a borehole or a vault. For borehole installation, they drill down into the Earth to some depth and place the seismometer securely inside. For vault installation, which is commonly used for temporary seismometers, the seismometer is installed within a cavity, which could be anything from a cave to something that the installer has to construct. The goal is to protect the instrument from flooding and vandalism. Depth typically relates to borehole installation. Ideally, a borehole can be drilled through the sediment layer and into bedrock. The deeper the borehole, the less likely surficial seismic noise will affect the data. Substrate is the final variable that this study addresses, and in this case means granite bedrock versus unconsolidated sediment (e.g. broken up granite that is essentially sand). A goal for seismic studies is to install the seismometer deep into bedrock, but this is not always possible.
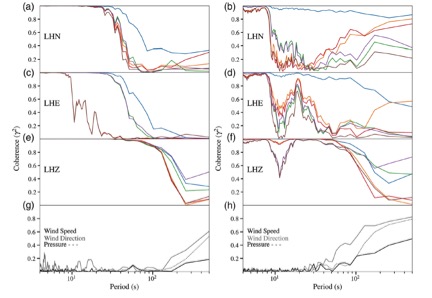
To compare data from the different instruments, Dybing et al. used coherence (Figure 2), which is a way to quantify the similarity of two waveforms. Dybing explains that for two waveforms, “a coherence of 0 means they are completely different, and a coherence of 1 means they are exactly the same.” A high coherence, however, does not imply causality, but it's an effective way to determine if two waves are the same. If two closely spaced seismometers have incoherent signals, there must be a reason that they are recording different motions. For example, in Figure 2, the blue trace comprises the coherence between two seismometers that are installed next to one another where installation style, substrate and depth are all the same. For such a pair, we would expect coherence to be high in most situations; indeed, in Figure 2 a-f, where this pair is compared, coherence is generally much higher than the remaining seismometer pairs.
To break down the overall results of this study, we first discuss the horizontal signals - the east-west and north-south components – because the wind-induced ground tilt should affect the horizontal component much more than the vertical component. We further simplify the horizontal component discussion by describing long period results first, and then high frequency results.
For both horizontal components, Dybing et al. found that high wind speeds increase local seismic noise at longer periods (>20s). This means that at higher wind speeds, the ground is moving more in the east-west and north-south directions at relatively long wavelengths than it does at lower wind speeds. Additionally, the coherence between most seismometer pairs shown in Figure 2 drops off (Figure 2 b, d), which tells us that the tilt of the ground produced by these high wind speeds changes between seismometers. The exception is the blue trace, which we discussed above.
However, because the remaining seismometer pairs have different characteristics (e.g. installation style, depth and substrate), Dybing et al. explored their data further.
They found that for the deepest seismometer (145m), there was a low correlation between high wind speed and seismic velocity because it is shielded from the ground tilt at the surface caused by the high winds. The next 3 seismometers, which are not nearly as deep (~3m), exhibit stronger correlations between high wind speed and seismic noise. This tells us that depth is important.The highest correlation between wind speed and horizontal seismic noise was recorded in the seismic vault. This is because at high wind speed, the entire vault tilts. This tells us that style of installation is important. Interestingly, with regard to the high frequency (5-15 Hz) seismic noise, they suggest it may not be the result of wind, but rather anthropogenic (man-made) cultural noise.
Seismologists commonly assume that the vertical component is less affected by wind than the horizontal components because it is less sensitive to tilting of the ground. Dybing et al.’s observations support this, although the seismometer installed in unconsolidated sediment showed a noticeable increase in noise in the vertical component compared to the other seismometers. This tells us that substrate matters. In fact, they find that the effect of substrate may cancel out the benefits of depth. This means that even if a seismometer is installed in a borehole at depth, if the substrate is unconsolidated sediment, the noise may be amplified, thereby reducing or eliminating the benefits associated with borehole installation.
Another key observation is the low coherence between the two meteorological stations for all like measurements (e.g. wind speed, wind direction, pressure) until very long periods (100s) for both slow and fast wind speeds (Figure 2 g, h). This observation calls into question the value of using weather station data to correct seismic noise, even at such small spatial scales (~100 m), for much of the range of broadband seismic data. In short, wind is turbulent, and wind characteristics at a weather sensor may be very different than those at the nearest seismometer, which makes correcting for wind-induced noise difficult.
Overall, Dybing and her coauthors’ work underscores the importance of proper characterization of local noise sources if successful corrections are to be applied to seismic data. Noise, whatever the cause, provides the lower limit of resolution for a given seismometer, and that limit is dependent on depth, substrate and installation style, at the very least. Below this limit, small seismic waves cannot be confidently measured.
Perhaps an even more important result of this work is how Dybing, an undergraduate at Washington University, has been inspired to continue her pursuit of research in geophysics. She describes her experience as “unparalleled” and says “my internship really helped me figure out what I wanted to do with my future.” She will be starting next fall in the PhD program at the University of Oregon with other members of the 2018 IRIS Summer Internship Program.

Figure 1 (Top): (a) Wave with a period of 1 second and a frequency of 1 Hz, or 1 cycle per second. Compare with (b), a wave with a period of 0.5 seconds and a frequency of 2 Hz, or 2 cycles per second. Period is the inverse of frequency. Note the difference in wavelength, or the distance between two crests, or high points, of the wave. The wavelength of (a) is greater than the wavelength of (b). Thus, short period, high frequency waves have short wavelengths, whereas long period, low frequency waves have long wavelengths. Sketch modified from IRIS animation.
Figure 2 (Bottom): Plots of coherence (γ2) between all broadband seismometers used in this experiment for the (a, b) north-south, (c, d) east-west, and (e, f) vertical seismic components during a time period of low wind speed (left panel) and high wind speed (right panel) from 4-500s period. ASL8 00 is a borehole seismometer installed in granite 3 m below the surface. ASL9 00 is also a borehole seismometer installed in granite 3 m below the surface. ASL9 10 is a vault seismometer, installed on granite at the surface. ENG5 60 is a borehole seismometer installed ~3 m below the surface in unconsolidated sediment. Coherence of wind speed, wind direction and barometric pressure between the two weather sensors was also plotted for low (g) and high (h) wind speeds. ANMO and FBA1 are the 2 weather station names, and LWS is wind speed, LDO is wind pressure, and LWD is wind direction. The number in parenthesis between each pair indicates relative distance from one another.
Citation
Sydney N. Dybing, Adam T. Ringler, David C. Wilson, Robert E. Anthony; Characteristics and Spatial Variability of Wind Noise on Near‐Surface Broadband Seismometers. Bulletin of the Seismological Society of America doi: https://doi.org/10.1785/0120180227