
By Dr. Alka Tripathy-Lang and Dr. Wendy Bohon
In the Tasman Sea southeast of Australia sits a pair of islands stranded in the ocean. The North and South Islands of New Zealand are the emergent parts of a piece of continental crust at the edge of the Australian tectonic plate. The Pacific oceanic plate began its ongoing dive beneath the North Island more than 20 million years ago, which caused a swath of volcanoes to erupt and reshape the surface. Several million years ago, the region that hosts these volcanoes began to tear apart, even as the subduction of the Pacific plate continued.
 Today, the aptly titled “intra-arc rift” sits within the Taupo Volcanic Zone, which scientists subdivide into a northern, central and southern section (Figure 1). The central section has literally burst with supervolcanic activity in the recent past, which requires voluminous crustal magma storage. The comparatively less explosive northern and southern sections appear to store less magma. However, the offshore northern section lacks detailed information about the structures beneath the seafloor, and what relationship, if any, they have to the melting of rocks that fuel active magmatic systems.
In a paper published in the November 2019 issue of Geophysical Research Letters, researchers led by University of Texas at Austin doctoral student Andrew Gase used seismic waves from man-made sources in the Bay of Plenty to create detailed images of the crust and mantle spanning the underwater northern section of the Taupo Volcanic Zone. By peering into the subsurface below the water, they found evidence of a positive feedback relationship between magmatic intrusion and crustal extension.
Seismologists use earthquakes much in the same way a flashlight illuminates a dark room, explains Gase. “With a flashlight, light energy travels through the air, reflects off surfaces, and is received by your eyes. Your brain then creates an image,” he says. But instead of a flashlight, seismologists often use earthquakes. Any time an earthquake strikes, seismic waves travel through the earth, bouncing off some features and careening through others. Seismographs detect these signals. Scientists use computers to crunch to data, which results in an image of the inner structure of our planet, Gase says.
However, the crust only makes up about 1% of the earth's volume, so features confined to this outermost layer, like magma chambers, faults, and sediments, are small targets compared to the size of waves produced by natural earthquakes, says Gase. In other words, these waves cannot always “see" small features in the crust. To get around this, scientists must make their own quakes.
In Gase’s project, which is part of project SHIRE (Seismogenesis at Hikurangi Integrated Research Experiment), he explains that during the first of two field campaigns, they used airguns towed behind a ship in the Bay of Plenty “to create precise, small [man-made] earthquakes with compressed air.” When the airguns released their pressurized charge, a “boom” reverberated through the seawater. “The sound,” Gase says, “travels down through the water column, into the earth where it becomes seismic waves.”
Gase and his colleagues recorded these seismic waves on three different types of instruments. More than 1000 hydrophones streamed behind the ship, like microphones recording sound waves in the water. Ocean bottom seismographs, which are sensors placed on the seafloor to record waves traveling through either the water on top or the earth below, were dropped off the side of the ship and left for several days to collect seismic data. Onshore, New Zealand’s scientists already buried 45 IRIS/PASSCAL seismographs in hopes of recording waves produced by the airgun shots.
For the second field campaign, Gase and colleagues conducted their experiments onshore with the help of 583 IRIS/PASSCAL Texan seismographs. On solid ground, they used explosive sources to create controlled earthquakes as a means to image the transition from rifted to unrifted northern Taupo Volcanic Zone.
Below the seafloor of the Bay of Plenty, Gase and colleagues identified basins filled with sediment (Figure 2). The boundaries of these basins are normal faults, which result from rifting. By comparing onshore and offshore images, Gase calculates the crust’s initial heft has thinned by more than 7 kilometers. Some normal faults, particularly those on the east side of the bay, penetrate into the middle crust, occasionally reaching into sheets of magma, called sills, tucked between layers of bedrock.
 In particular, three features—movement on the faults, amount of sediment fill, and presence of magmatic sills—are more abundant on the east side of the bay than the west. The east side of the Bay of Plenty also hosts more active volcanic and hydrothermal systems. These coincidences may be best explained by “magmatically assisted rifting,” says Gase. In this process, he explains, as crust stretches, magma moves upward to fill the space, which heats and further weakens the crust, driving more rifting.
The Taupo Volcanic Zone is littered with active volcanoes whose characteristics change by location. When supervolcanoes like those of the central Taupo Volcanic Zone erupt, says Gase, they seem to require voluminous mantle-sourced magma chambers in the crust that feed the volcanoes. To ‘see' magma sources, Gase says, "seismologists often use the speed of seismic waves through the mantle as an indicator for magma volume—slower wavespeeds correspond with more magma.” In the central Taupo Volcanic Zone, he says, previous studies show high volumes of mantle-sourced magma.
In the northern Taupo Volcanic Zone, where Gase and colleagues’ study was located, he says "we observe higher mantle seismic velocities, and there is little evidence of supereruptions.” Why this might be, Gase says, is not fully understood. However, the northern section still hosts deadly volcanoes, including Whakaari (White Island), site of a relatively minor, yet violent and powerful eruption in December of 2019 that saw 21 people lose their lives. The hazard potential of the faults Gase and colleagues found, and the details of the associated volcanic systems have yet to be explored, so additional studies are critical for constraining geologic hazards in this part of New Zealand.
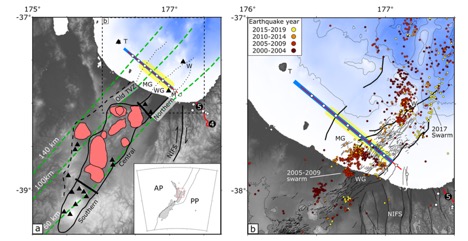
Figure 1: Maps of (a) the Taupo Volcanic Zone (TVZ) and (b) Bay of Plenty. Blue line is the path the ship took while shooting airguns and measuring waves propagating through the water with hydrophones. The red line atop the blue one marks a second pass of the ship's airguns, for recording by ocean bottom seismographs (offshore white circles). Onshore, white circles mark seismographs, and the red line indicates the locations of IRIS/PASSCAL Texan Seismographs from the second field campaign(s). The numbered black circles onshore indicate location of controlled man-made explosions. (a) Map of the Taupo Volcanic Zone with southern, central, and northern segment boundaries shown as solid black lines. Black triangles show volcanoes. Pink blobs indicate caldera locations, which in some cases produced supereruptions. (b) Thin black lines trace active faults in the northern Taupo Volcanic Zone. Major offshore faults are thicker. Earthquakes are shown as small color-coded circles where color indicates timing of the event. NIFS = North Island Fault System; M = Moutohora (Whale Island); W = Whakaari (White Island); WG = Whakatane Graben; MG = Motiti Graben; T = Tuhua (Mayor Island). Credit: Gase et al. (2019)
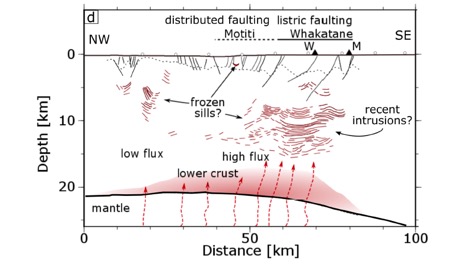
Figure 2: Interpretation of seismic data through the Bay of Plenty. The basement underlying the underwater basins is indicated by a dotted line. Faults are black solid lines. Magmatic sills are dark red lines. The red shading indicates the magmatic lower crust. The amount of mantle-sourced melt that percolates through the crust is indicated by the red dashed arrows, with higher flux on the east side of the Bay of Plenty feeding the magmatic sills. W = projected location of Whakaari along this profile, M = projected location of Moutohora, another volcano in the Bay of Plenty, along this profile. Credit: Gase et al. (2019).
Citation: Gase, A. C., Van Avendonk, H. J. A., Bangs, N. L., Luckie, T. W., Barker, D. H. N., Henrys, S. A., et al. (2019). Seismic evidence of magmatic rifting in the offshore Taupo Volcanic Zone, New Zealand. Geophysical Research Letters, 46, 12,949–12,957. https://doi.org/10.1029/2019GL085269.
