
 by Dr. Wendy Bohon
On September 3, 2017, the government of the Democratic People’s Republic of Korea (North Korea) claimed they successfully detonated a hydrogen bomb, which was its sixth nuclear test. Seismometers worldwide recorded the event. In the following days, several additional seismic events were recorded, including one that was 8.5 minutes after the test itself, two on September 23, and one on October 12. Using seismic data from the IRIS Data Management Center, the China Earthquake Data Center and several other networks, Tian et al. (2018) were able to determine locations and probable causes for these additional seismic events.
Detailed analysis of the seismic event that occurred 8.5 minutes after the test shows that it was the result of a nearly vertical collapse 440 ±260 m northwest of the nuclear test site (Figure 1). This collapse likely happened within the elastic deformation zone generated by the nuclear test. A comprehensive analysis of the three events that transpired on September 23 and October 12 indicates that an earthquake swarm occurred 8.4 ±1.7 km from the test site. The location, depth (at least 2.4 km) and magnitude (M2.9-M3.6) of these earthquakes, as well as the lack of seismicity prior to these events in the area, imply that they are most likely earthquakes triggered by the nuclear test.
Because of the high likelihood that collapse occurred within the deformation zone of the detonated bomb, and in the direction of the cavity, there is serious concern for leakage of radioactive material. Tian et al. (2018) call for careful continued monitoring of the test site.
Cover Figure (from Dr. Andy Frassetto): The 2017 M6.3 seismic event (nuclear/H-bomb? explosion) in North Korea recorded at nearby seismometer compared to their last nuclear test (M5.3) in 2016.
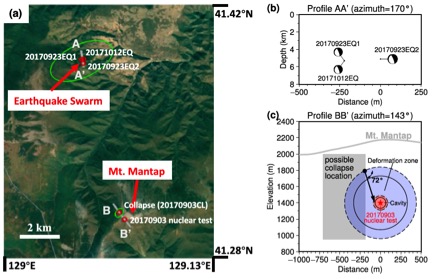
Figure (above): (a) Google Earth map showing the locations of North Korea’s 2017 nuclear test, site collapse (labeled as 20170903CL), and earthquake swarm (20170923EQ1, 20170923EQ2, and 20171012EQ). The green ellipses show the uncertainties of the locations of the events 20170903CL and 20170923EQ2. (b) Cross sectional view of the location and focal mechanisms of earthquakes along profile A-A’ in Figure 1a. c) A cross section along profile B-B’ in Figure 1a, showing zone of possible collapse location (gray box), center of the nuclear explosion (red star), estimated cavity (red circle) and elastic deformation zone (blue circle). The solid and dashed circles represent estimated cavity and elastic deformation zone based on a nuclear test yield of 105 and 250 kilotons, respectively. The arrow shows the direction of the collapse.
Citation
Tian, D., Yao, J., & Wen, L. (2018). Collapse and earthquake swarm after North Korea’s 3 September 2017 nuclear test. Geophysical Research Letters, 45. https://doi.org/10.1029/2018GL077649
