
by Dr. Alka Tripathy-Lang and Dr. Wendy Bohon
Hidden amidst the tumult of seismic data generated by earthquakes, explosions and other earth-shaking phenomena is a relatively quiet hum. Discovered relatively recently, this hum is Earth’s background noise, and it originates within the oceans. A short period noise (3- to 20-s), referred to as microseismic noise, is due to ordinary ocean waves pounding the seafloor, generally near the shore, and is relatively well understood. The longer period part of Earth’s hum (50- to 300-s) is caused by gravity-driven waves called "infragravity waves” that couple with the seafloor, but the details of infragravity-driven hum generation are enigmatic. The long-period hum of the Earth is the subject of the analysis in Maurya et al. (2019).
Seismologists have determined that earthquakes or large-scale tectonics do not cause the long period hum because it has seasonal variations; it is most pronounced in the winter months. It is also unrelated to local weather near seismic stations. What might be the cause?
The theory on which Maurya et al. (2019) focus their efforts considers a 2-step process for hum generation. First, wind-generated ocean surface waves turn into longer-period infragravity waves by colliding with each other. Then, the infragravity waves interact with the ocean floor to excite seismic waves, resulting in the hum. However, the regions of the seafloor that interact with infragravity waves to produce the hum is unknown. Mapping the hum’s seafloor source areas would help researchers understand how the hum is generated, and also provide another source of information for studies that image the earth’s interior.
Maurya et al. (2019) chose to investigate two massive, infragravity wave-producing ocean storms that occurred during a seismically “quiet” 7-day period in December of 2015, defined as having no earthquakes greater than Mw 5.6 anywhere in the world. Both storms originated in the western Pacific and moved across the northern Pacific Ocean basin. The first storm, Cascadia-1, includes a smaller tail, Cascadia-2 (C1 and C2). The second storm took a more northerly path after working its way across the Pacific, and is called Alaska (A3).
The storm paths are most clearly shown in the first columns of Figures 1 and 2 (days 344-346, and 347-348, respectively), where the locations of the storms are indicated via wave height, as measured by satellites. Storm C1 and C2 are fairly obvious in all rows of Figure 1, and storm C2 is labeled in all rows of Figure 2. In Figure 1c, the development of storm A3 can be seen near Japan. By Figure 1h, storm A3 has developed into a substantial disturbance (unlabeled red blob) based solely on wave height, and continues to dominate the wave height data in column 1 of Figure 2.
The second column of both figures shows the results of a model that predicts where infragravity waves might travel once they have been created. In Figure 1 (column 2), it shows the predicted infragravity waves that result from storm C1 interacting with the western coast of North America. In Figure 2 (column 2), the infragravity wave prediction is dominated by C2 until Figure 2e. At this point, infragravity waves resulting from storm A3 are predicted in the vicinity of the Aleutian Islands and the Bering Sea.
The third and fourth columns in Figure 1 and 2 show the results of Maurya et al.’s analysis of seismic array data from USArray sites in the continental US and Alaska, as well as other seismic networks worldwide. They discovered that the production and distribution of the infragravity waves and subsequent hum strongly depends upon the angle at which the storm approaches the coast and the seafloor topography of the coastline.
Storms C1 and C2 moved eastward across the Pacific and directly hit the west coast of North America, and their impacts produced infragravity waves that generated seismic hum (e.g. Figure 1 a-h). In Figure 1 (columns 3 an 4), the hum from storm C1 appears to be channeled north and west along the coast, all the way up to Alaska and the Aleutians (Figure 1 c and e), which is notably absent from the predictions in column 2. Interestingly, the long-period seismic data in column 4 also indicates that, to produce the hum, long-period infragravity waves must propagate outward toward the ocean basin, as opposed to remaining trapped in the coastal regions.
On the other hand, storm A3 generated only a brief hum near the coast of Alaska (Figure 2 e-h, columns 3 and 4; the burst of seismic energy in Figure 2g is attributed to C2). Storms C1 and A3 were of similar size and duration – in fact, A3 affected a larger area of the ocean - so why did they produce such different seismic hums? Storm A3 took a more northerly route and approached the coast obliquely. Dr. Barbara Romanowicz, a co-author of this study, explains that because the generation of infragravity waves depends on ocean surface waves traveling in different directions, reflection of the storm waves off the coast helps produce the necessary opposing waves. In the case of an oblique impact like storm A3, few infragravity waves will be generated because of the lack of ocean surface waves traveling in opposing directions. She continues explaining that “whatever [infragravity wave] is generated does not create much hum locally because of the deep ocean floor,” which highlights the importance of the near-shore seafloor topography (bathymetry) along the coastline.
These findings regarding the generation and distribution of the earth’s long period hum through space and time will help quantify the physical mechanism responsible. This information is important particularly for deep earth studies that assume, erroneously, a uniform distribution of seismic hum sources.
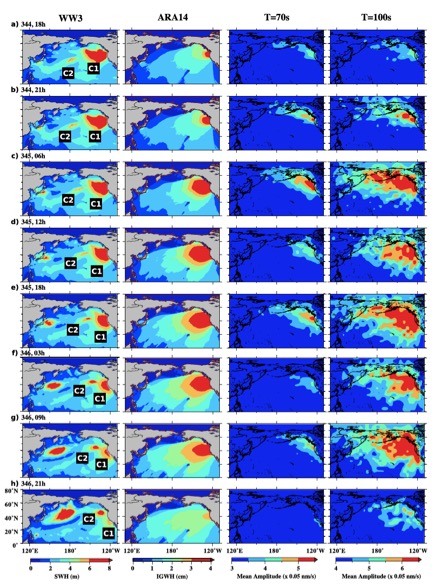
Figure 1.(a–h) Time snapshots on days 344 to 346 of 2015 for (left to right): significant wave height (SWH) showing the progression of Cascadia‐1 (C1) and Cascadia‐2 (C2) storms; infragravity model prediction; and spatial distribution of seismic sources obtained by backprojection using seismic data at periods 70 s (column 3) and 100 s (column 4). WW3 = WaveWatch‐III. ARA14 = infragravity wave model used for predictions. SWH = substantial wave height. IGWH = infragravity wave height.
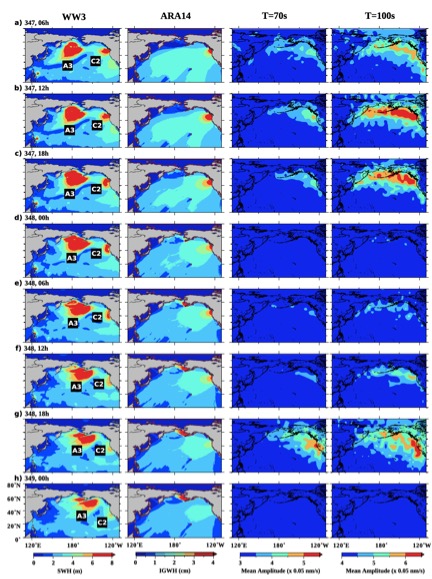
Figure 2. Same as Figure 1 for days 347 to 349 of 2015, showing the arrival of the Cascadia‐2 (C2) storm on the West Coast of North America and the propagation of the Alaska (A3) storm along the Aleutian Islands.
Citation: Maurya, S., Taira, T., & Romanowicz, B. (2019). Location of seismic “hum” sources following storms in the North Pacific Ocean. Geochemistry, Geophysics, Geosystems, 20. https://doi.org/10.1029/2018GC008112.
Cover Photo: Photograph by James P. Blair, National Geographic
