
 by Dr. Alka Tripathy-Lang
In the western Pacific Ocean, massive tropical cyclones akin to the hurricanes of the Atlantic occur throughout the year. Called typhoons in the northwestern Pacific, these intense storms are renowned for their damaging winds and devastating floods. Although typhoons are not as famous for their seismic signature, Retailleau and Gualtieri (2019) show that seismology can be used to track and measure tropical cyclones as they churn through the ocean because they create “secondary microseisms.”
Secondary microseisms are measured as background seismic signals, or noise, of the Earth at periods between 2 and 9 seconds. They occur when a storm generates strong wind, which in turn generates ocean waves that move in all directions. As a storm moves, it continues its wave-making action, and these new waves overrun those that have already been made in the wake of the tropical cyclone. As these waves interact behind the storm, they create distinct wave groups that couple with the seafloor to generate secondary microseisms.
Dr. Retailleau explains that while the storm-based generation mechanism of the secondary microseism, described above, is fairly well understood, the local generation of the seismic waves at the source (location, frequency content, wave type, etc.) is less well constrained. Further complicating the study of the secondary microseism is that those generated by tropical cyclones have previously only been observed either when there were no other major storms, when the storm was particularly strong or fast, or at narrow seismic periods of around 5 seconds.
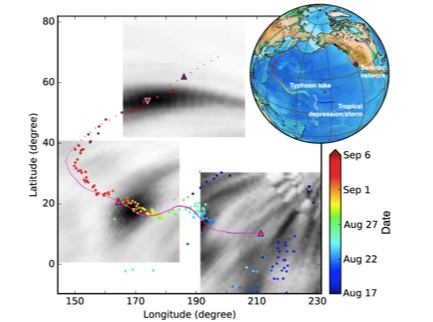
Retailleau and Gualtieri (2019) focus their efforts on the 2006 Typhoon Ioke, which was the most intense hurricane ever recorded in the Central Pacific. In Figure 1, the track of Typhoon Ioke was recorded from satellite data every 6 hours (magenta dots). Data from satellites also provide information about storm size and intensity, which is related to the wind speed.
To test if seismic data could have tracked this storm over its lifetime, Retailleau and Gualtieri use backprojection of seismic waveforms downloaded from the IRIS DMC and other sources. Typically, backprojection, a classic method for locating seismic sources, works by using the direction of incoming seismic waves to point to the source. However, Retailleau and Gualtieri use a novel twist on this method that directly searches for the source locations by examining particular body-wave phases, which are more localized than surface waves (see here for an illustration of body waves versus surface waves). This new method allows for a more precise source location.
Over the lifetime of Typhoon Ioke, which occurred in August and September of 2006 in the Pacific Ocean, Retailleau and Gualtieri locate seismic sources, which generally follow in the wake of the storm as expected. In Figure 1, along the magenta-dotted storm track, multi-colored larger dots mark the locations of seismic sources determined every 3 hours using the 4-6 s period band. The right-side up magenta triangles indicate the location of the storm at three different storm stages, as determined by satellite data - tropical depression, typhoon, and extratropical storm. The upside-down triangles show the seismic source locations at the same time as the magenta triangles.
With the first pair of triangles, the dark blue upside-down triangle appears unrelated to the storm, as it is nowhere near the magenta triangle. This seismic source was recorded during the tropical depression stage, when the storm was likely too weak to produce the pattern of interacting ocean waves required to generate its own seismic sources. Retailleau and Gualtieri suggest that this may be related to how the atmosphere and the ocean interact. If the process of wind-generated wave growth is too slow, then storm-related seismic sources may not be generated prior to the typhoon stage.
During the typhoon stage, the orange upside-down triangle demonstrates that this backprojection method is capable of identifying the expected seismic sources, which always follow the storm event and thus should always lag behind the satellite-based storm location. Interestingly, during the typhoon stage of the storm, Retailleau and Gualtieri identify seismic sources with a 3-hour resolution and observethat the distance between the seismic sources and the storm itself is nearly constant.
In the final extratropical storm stage, Ioke can still be tracked using this method even though the storm has weakened, as evidenced by the northernmost paired triangles - the magenta triangle and lagging upside-down dark magenta triangle. This is a peculiar difference from the beginning of the storm, when it was too weak to be accurately tracked using seismic data.
Although the 4-6 second period secondary microseism robustly followed the storm track from the typhoon stage and beyond (Figure 1), the 6-9 second period secondary microseisms are only generated toward the end of the storm, after it has moved into the extratropical stage. Retailleau and Gualtieri explain that there is a link between the speed at which the storm moves across the ocean, and its ability to generate seismic sources in its wake. A storm must move fast enough to override its own waves for the required wave-wave interaction trailing behind it. This process, they say, is also linked to the period of the waves. As the storm speeds up during the transition from tropical to extratropical, it produces long-period secondary microseisms, in addition to the short-period ones it was already producing. This may also explain why Ioke did not produce any secondary microseisms during the initial slow-moving tropical depression stage - it was simply too weak and slow to generate and override its waves.
With their backprojection method, Retailleau and Gualtieri were able to overcome challenges faced by previous researchers in order to detect seismic sources throughout the life of a storm that corresponds to the storm track.
The typical method of storm tracking involves following storms with satellites, but Dr. Gualtieri explains that satellite data were not always collected for every ocean basin, particularly in the southern hemisphere. This means we do not have an unbroken satellite-based record of such weather everywhere. The new backprojection method may help researchers revisit poorly-characterized storms. Seismometers record continuously, and easily accessible data from global arrays reach back several decades. Dr. Gualtieri continues that even today, with vastly improved satellite coverage, “this method can be seen as complementary to the satellite-based tracking by providing unique information about the energy exchange between the atmosphere, the ocean, and the solid Earth.”
Citation: Retailleau, L., & Gualtieri, L. (2019). Toward high-resolution period-dependent seismic monitoring of tropical cyclones. Geophysical Research Letters, 46, 1329–1337. https://doi.org/10.1029/2018GL080785.
Figure 1. Track of Typhoon Ioke from satellite data (magenta small dots) compared to the corresponding seismic sources in the 4- to 6-s period band over time (big colored dots, color-coded by date). The dots in dark magenta at the end of the track represent the extrapolation of the track when Ioke was an extratropical storm, and the eye was no longer easily followed using satellite data. The three grayscale snapshots show example results from the backprojection analysis at three different times. Upward (downward) triangle marks the typhoon location (the seismic source) at these times (see text for more detail). The inset on the top right corner of the figure shows the geographic location of the seismic stations used in this study and the typhoon track (color scale).
Cover photo: Hurricane Ioke at peak intensity west of the Hawaiian Islands on August 24; Image from US Navy, NASA
