
by Dr. Alka Tripathy-Lang
Numerous tectonic processes shape the ocean floor off the coast of northern California, Oregon and Washington. Basaltic lavas erupt at disparate ocean spreading centers, forming the Pacific plate on the west side and the Juan de Fuca plate on the east. Fracture zones separate these spreading centers, juxtaposing the two plates along transform faults. The Juan de Fuca plate plunges to its death in the mantle as it subducts below North America at the Cascadia trench.
 To monitor these ever-moving, ever-changing features, scientists periodically place seismometers on the ocean floor that are specifically designed to record Earth’s underwater movements. Called ocean bottom seismometers, these sensitive instruments can hear more than just earthquakes. They also record the songs of fin whales, the second largest cetacean in the world. In previous studies, scientists have been able to use seismology to study these great creatures of the sea, but in a recently published Science paper, seismologists Václav Kuna and John Nábělek instead used fin whales’ music to image different layers of oceanic crust by examining how the songs’ acoustic waves bounced and bent at crustal structures below the ocean.
Fin whales live in polar regions and equatorial waters alike, and are endangered, with an estimated global population of 100,000 animals. They typically sing when swimming no deeper than 20 meters below the ocean’s surface. Their calls, among the strongest in the ocean, reach up to 189 decibels — comparable to the nosiest of ships rumbling through the water. In detail, a song from a single fin whale consists of short, one-second calls repeated every seven to 40 seconds. These songs can last for hours, punctuated by pauses approximately every 15 minutes when the whale surfaces to breathe.
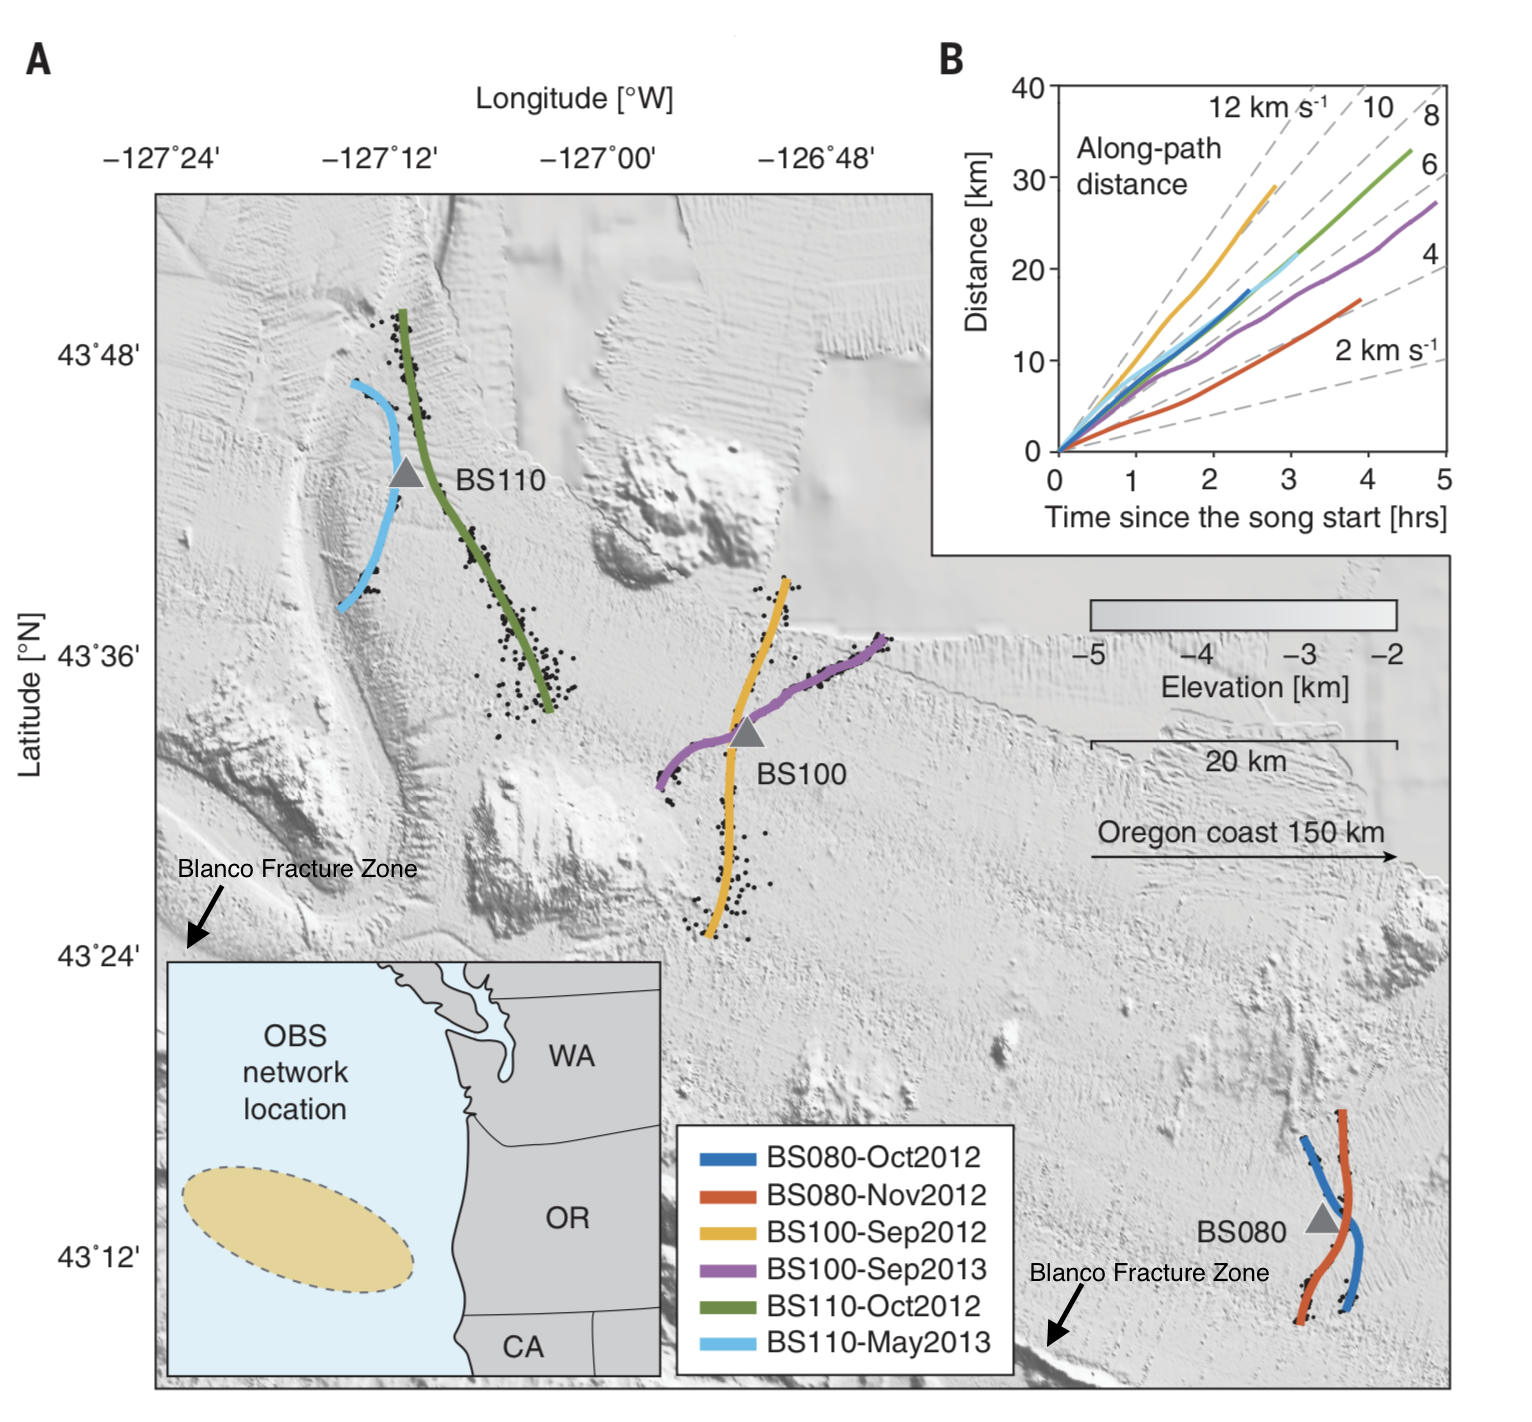
Between 2012 and 2013, seismologists deployed ocean bottom seismometers to study the Blanco Fracture Zone, which is a transform fault connecting two spreading centers — the southerly Gorda Ridge and the Juan de Fuca Ridge to the north (Figure 1). These ocean bottom seismometers contain a sensor that records vibrations at or below 50 Hz; low-frequency fin-whale songs (20 Hz), fall well within this range. These data are available from the IRIS DMC under network code X9.
During this deployment, three ocean bottom seismometers recorded numerous songs. Kuna and Nabelek focused on six of them, with each solo performance lasting between 2.5 to nearly five hours, and containing between 212 to 593 calls. When a whale’s signal travels exclusively through the water, it sometimes travels directly to the sensor, but can also bounce between the ocean surface and ocean floor, says Kuna. From these two two types of waves, he explains, they can determine the distance between the fin whale — the seismic source — and the station. Numerous such measurements result in a map of the whale’s route.
However, when a fin whale call impinges on the seafloor instead of traveling straight to the seismometer, “part of the call energy is transmitted into the ground as a seismic wave,” say Kuna and Nabaleck in their paper. Just as any other seismic wave behaves as it travels through different compositional layers within the earth, these whale-sourced waves can bounce, or reflect, off structures while also bending, or refracting, into deeper crustal layers before rebounding back up again (Figure 2).
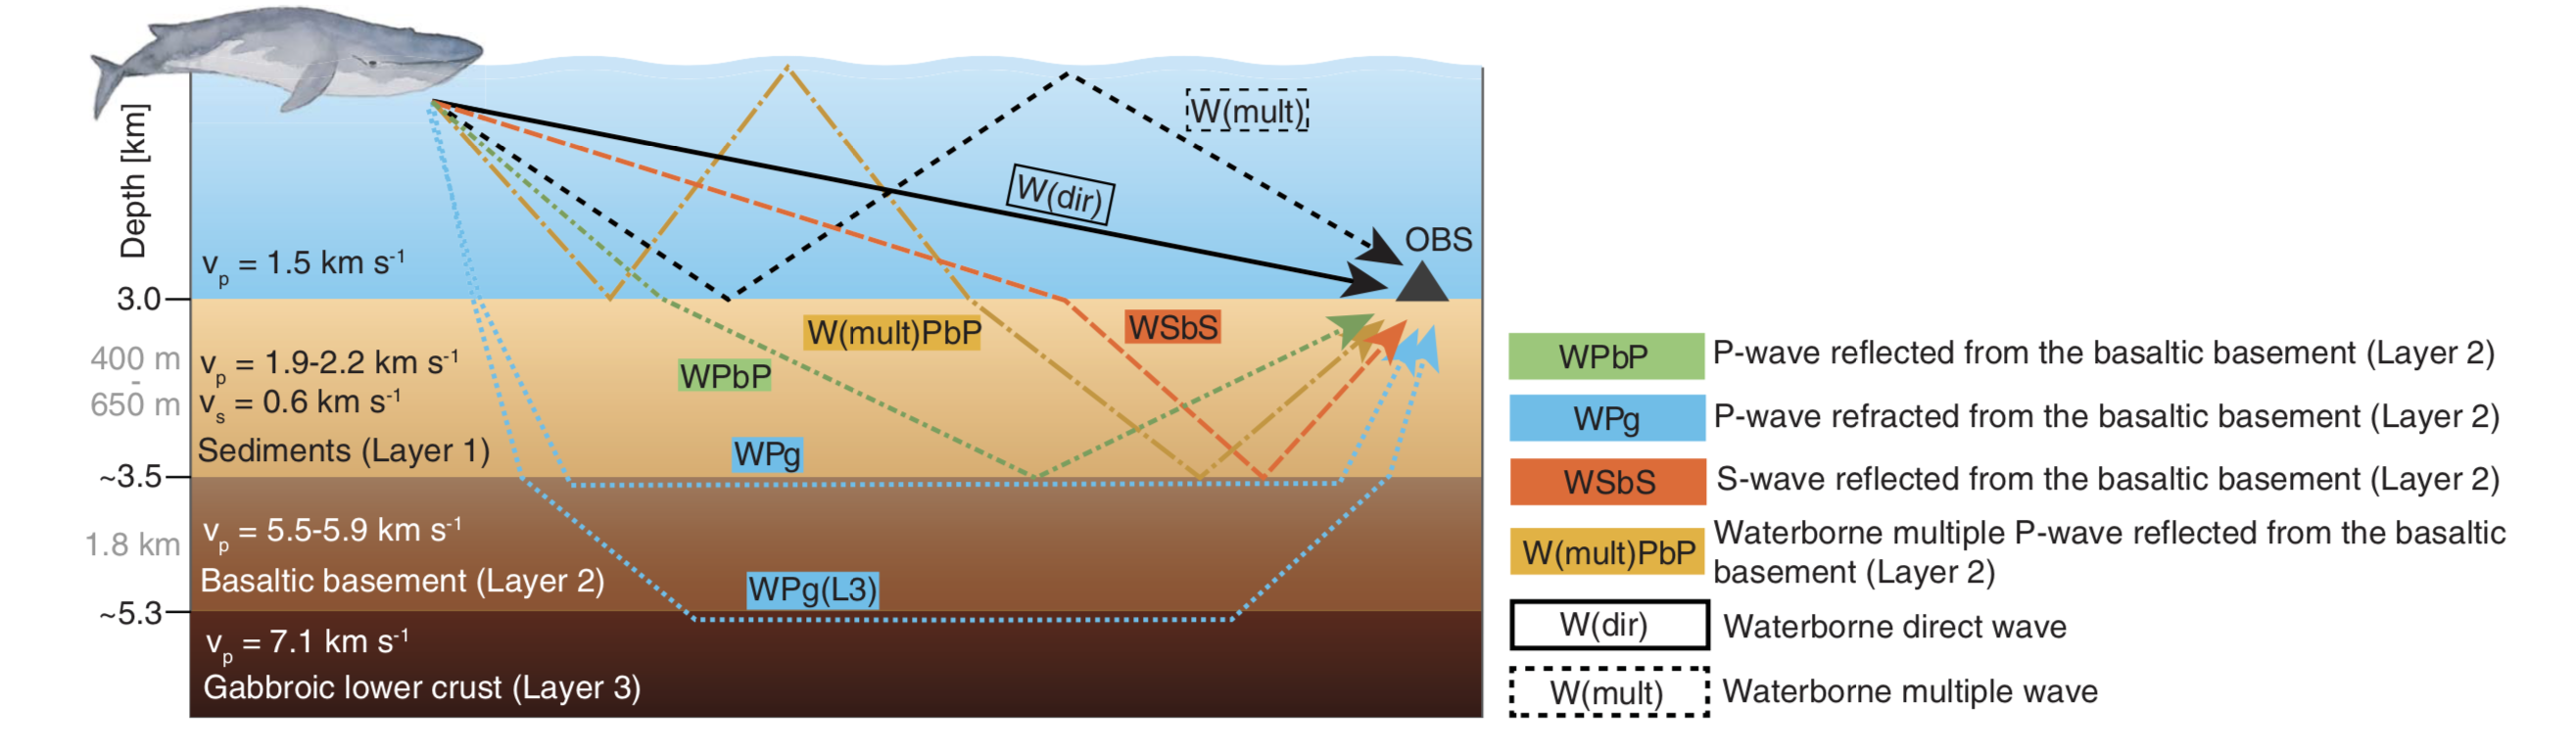
Typical oceanic crust consists of basalt that erupts into the cold deep oceans, and a lower layer of gabbros that cools slowly beneath the basalt. The composition of basalt and gabbros are roughly equivalent to one another. Near the eroding continents, a sediment layer often caps the basalt. At the study site, a layer of sediment sits atop basalts erupted from the Juan de Fuca spreading ridge between five and seven million years ago.
As whale calls ricocheted their way through the layers of oceanic crust, the stationary ocean bottom seismometer measured all these various phases. This acoustic game of pinball results in numerous measurements at a single station. These measurements form a "song gather” for each individual song, with the most prominent signals coming from the acoustic waves that exclusively traveled through the water, including those that bounced between the ocean bottom and surface (Figure 3).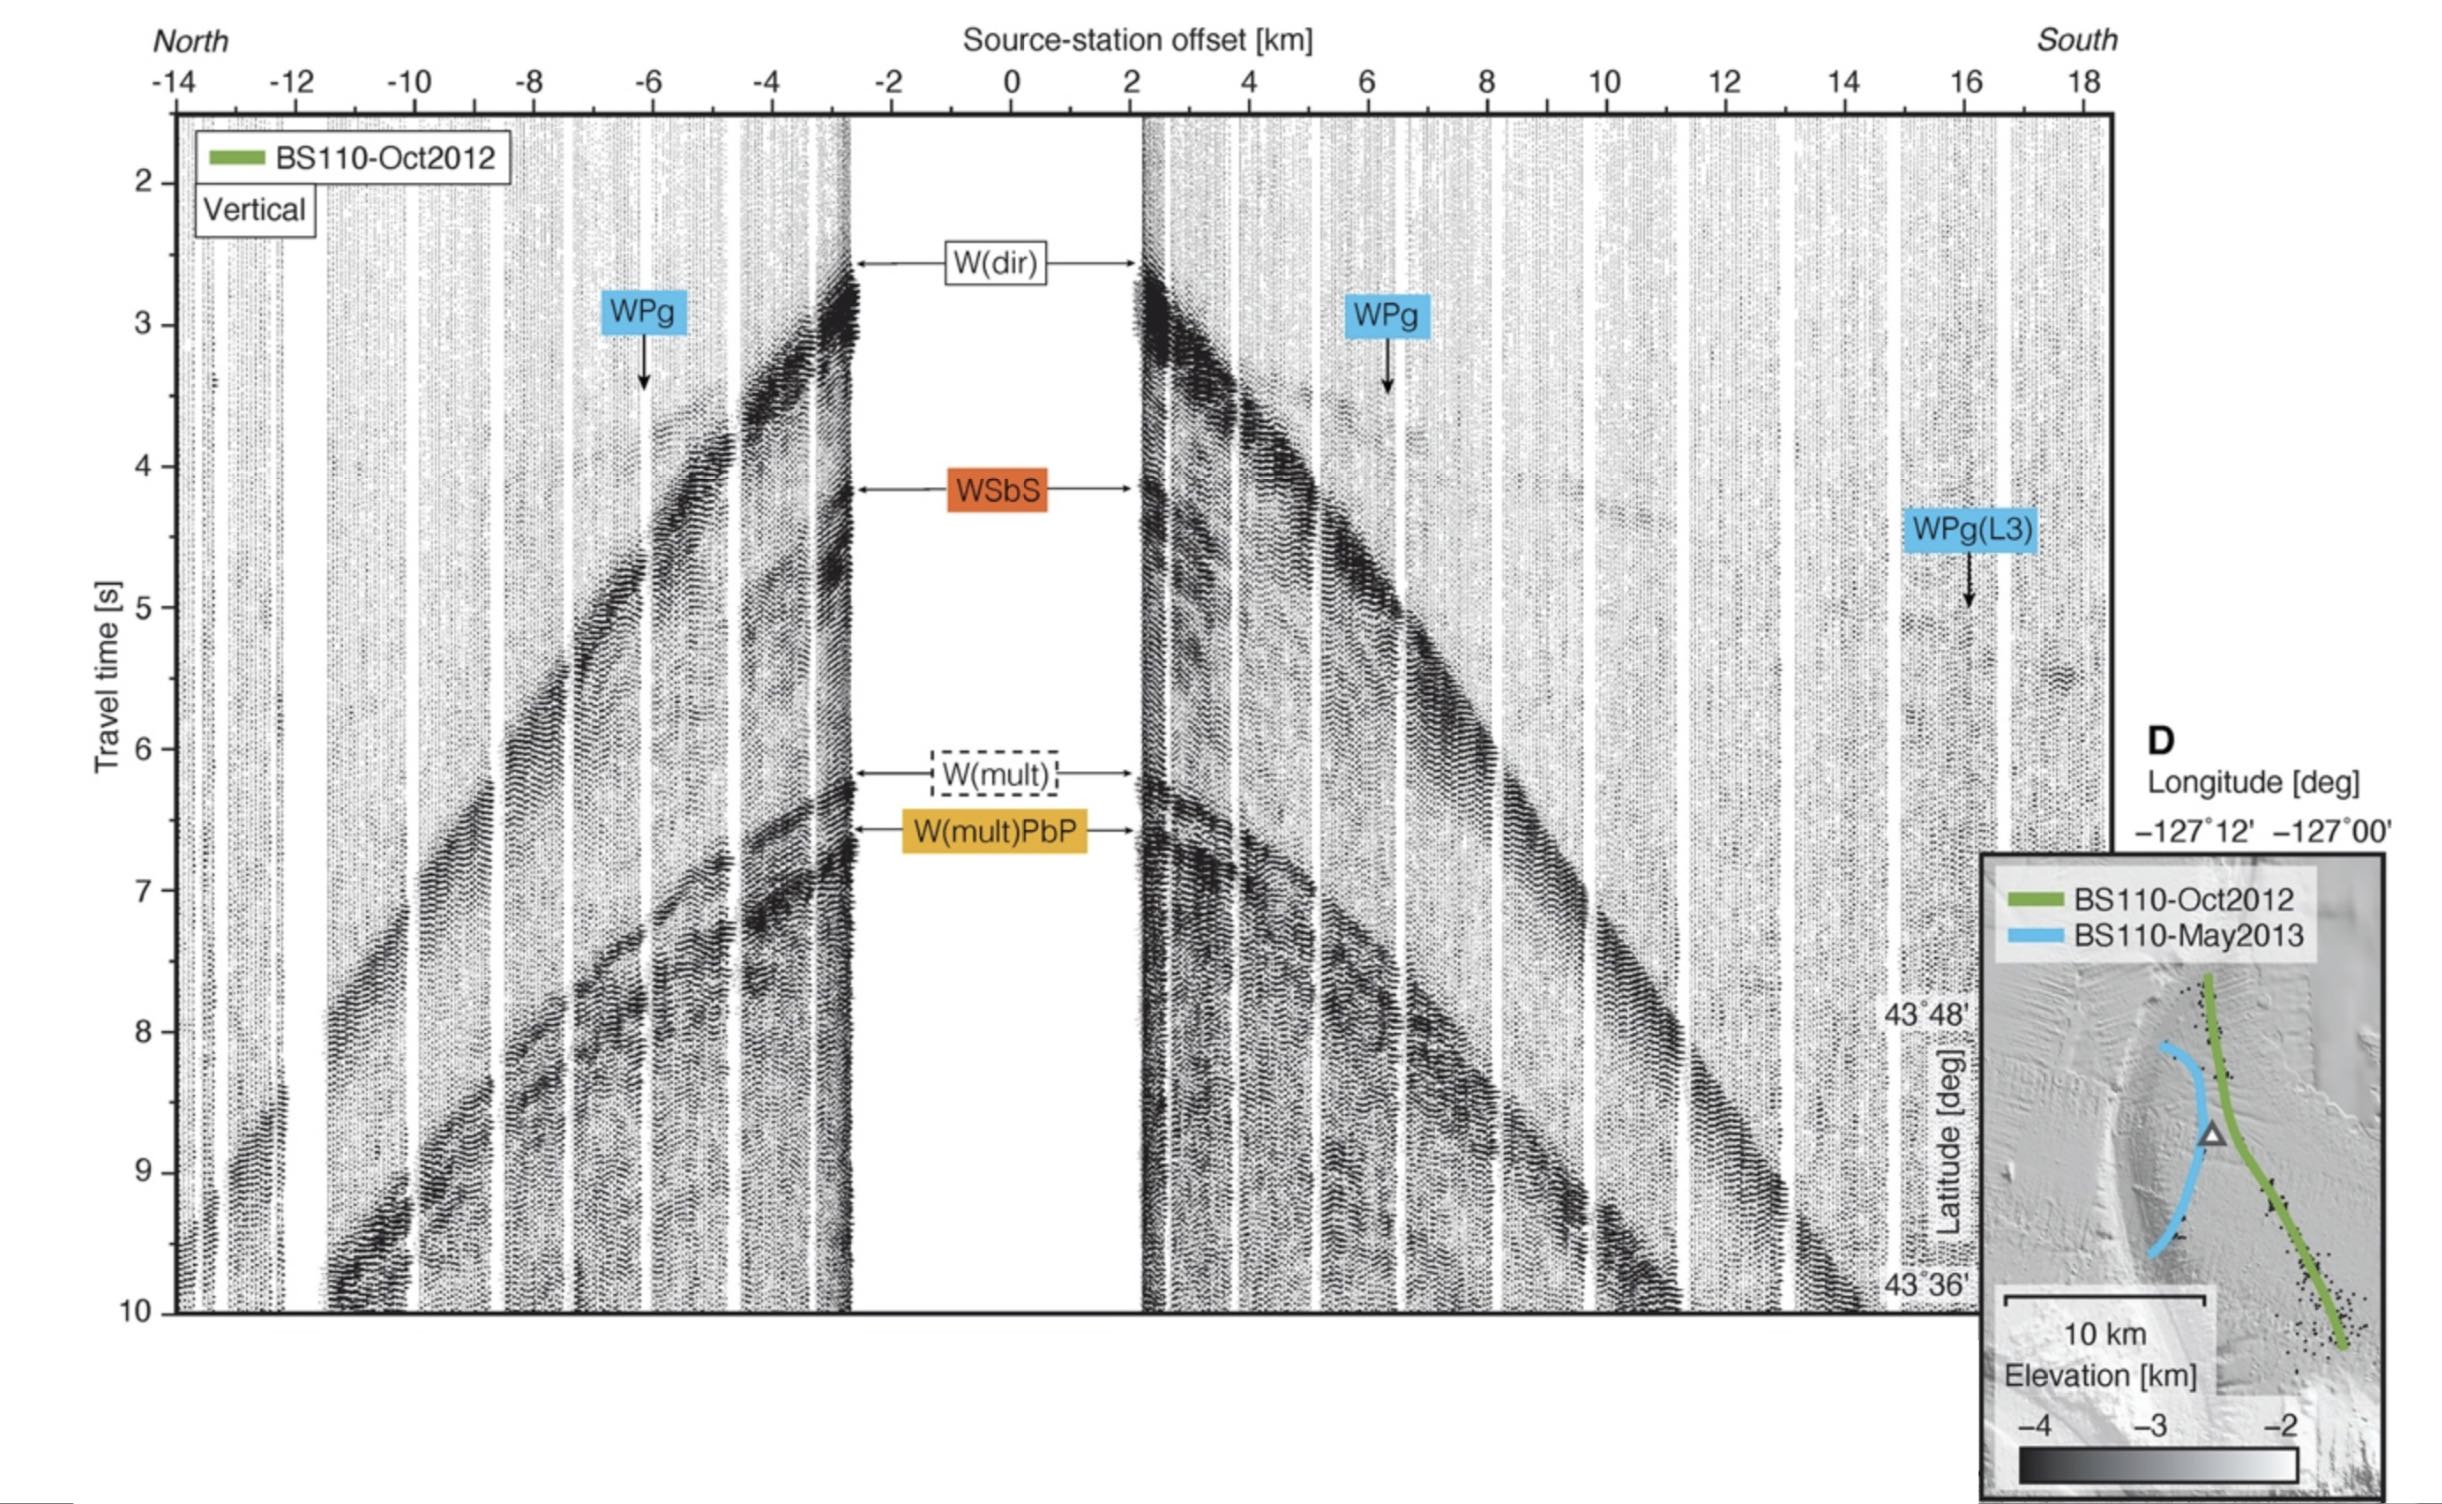
However, the song gathers also show converted phases — those that bent their way deeper into the earth before bouncing back. Based on seismic velocities extracted from these phases in the song gathers, Kuna and Nábělek confirmed the expected structure of oceanic crust for this region: a gabboric lower crust overlain by extrusive basalts, capped by a layer of unconsolidated, water-logged sediment. They constrained the thickness of the sediment to 400 meters, and the basalt to 1.8 kilometers.
The sediment layer appears thinner than sites further to the north, which Kuna and Nábělek suggest results from distance between the study area and possible sediment sources like the Columbia River estuary and the Juan de Fuca Strait. Geophysical properties of the sediment layer indicate overcompaction, which means the layer has less pore space than expected. The culprit for overcompaction, Kuna and Nábělek say, is the nearby Blanco Fault, whose repeated earthquakes may cause the loose sediment to decrease in volume by decreasing porosity.
Fin whale songs cannot replace air-gun signals that span a wide range of frequencies, they say. However, other higher pitched whale vocalizations, like sperm whale songs might be useful. Nevertheless, that these songs can be used to study not only the fin whales, but also their environment, demonstrates the value of examining whale calls with seismic data.
Figure 1: A. Seafloor bathymetry, station location and paths the whales traveled for the songs analyzed in this study. Black dots indicate location of individual calls recorded by seismic stations, represented by gray triangles. Colored lines approximate the each whale’s path. The Black Fracture Zone, located under the insets, has been labeled. Inset map indicates study location off coastal Oregon. B. Source-station offset as a function time, where slope gives velocity. Credit: Kuna and Nábělek, 2021
Figure 2. Model of the upper oceanic crust, with seismic velocities of each layer and possible ray paths from source (whale) to station. Model depth is not to scale. Credit: Kuna and Nábělek, 2021
Figure 3. Whale calls recorded during one song shown as a “song gather.” Individual phase arrivals (the arrows from Figure 2) appear as high-amplitude signals. Credit: Kuna and Nábělek, 2021
