
by Alka Tripathy-Lang and Wendy Bohon
Global seismographic networks like the Global Seismographic Network (GSN), GEOSCOPE (France), and GEOFON (Germany) involve seismic stations set up everywhere from Albuquerque to Antarctica, Sainte Marie aux Mines, France to the Kerguelen Islands in the south Indian Ocean. Such data can facilitate studies ranging from Earth's deep-seated structures to interactions between the solid Earth and atmosphere.
In a recently published paper in Reviews of Geophysics, written by 17 scientists from around the world, the experts tell the tales of these global networks and the myriad studies facilitated by such expansive datasets. In the first installment of this two-part science highlight series, we chronicled the history of these webs of seismic stations. Here, we dive into some of the applications and studies that underscore the impact and influence of such data.
One of the most commonly known uses of global seismograph networks is the near-instantaneous global monitoring of earthquakes and other phenomena that can shake the ground. This information helps mitigate societal impacts from earthquakes through reducing loss of life and infrastructure, says lead author Adam Ringler of the U.S. Geological Survey. Remote stations around the world, connected to earthquake scientists’ monitoring systems via the internet or satellites, quickly sense and transmit information in places that often lack other scientific observations related to earthquakes. This information results in more accurate locations and magnitude estimates.
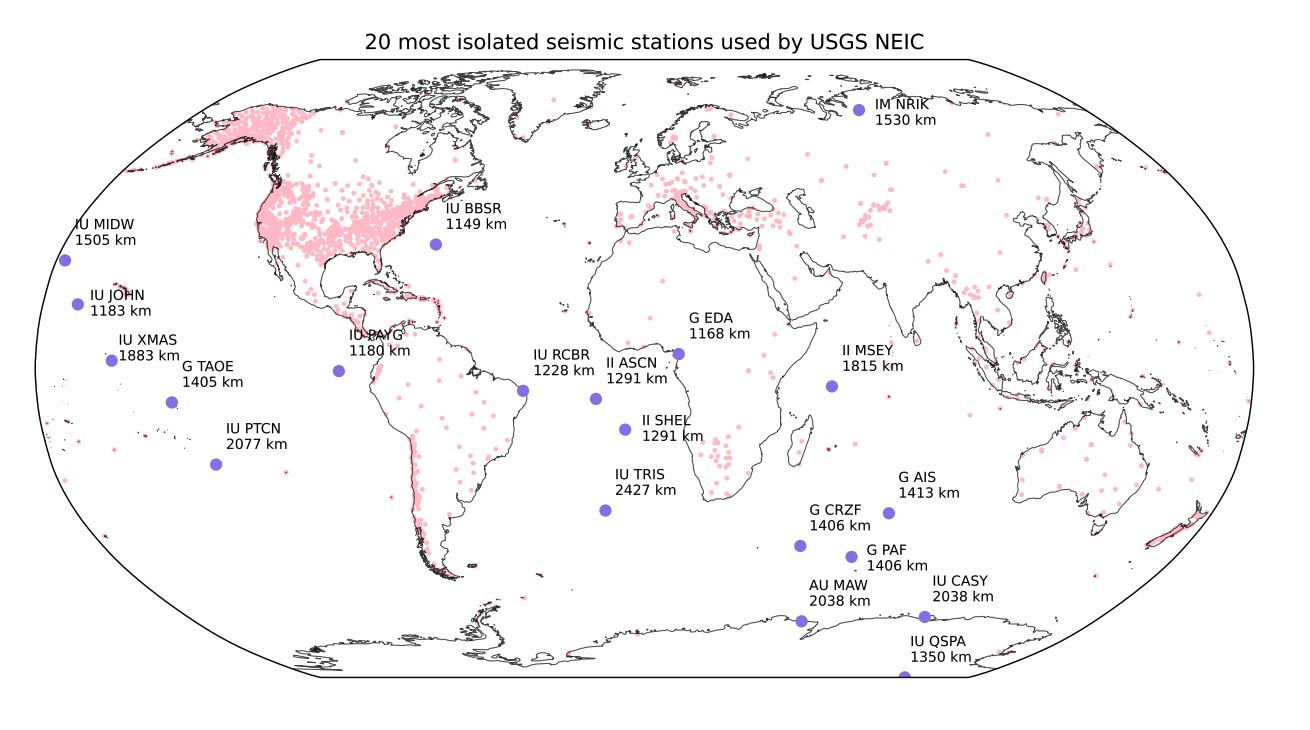
However, when it comes to hazard monitoring systems, different organizations make use of these networks for varied purposes. For example, for the U.S. Tsunami Warning System, tasked with monitoring the incoming waves of the many thousands of miles of coastline, the GSN provides location and magnitude within five minutes of any earthquake around the world that could produce a tsunami. In a different but complementary application, the USGS National Earthquake Information Center (NEIC) provides rapid information to the emergency response community, such as earthquake location, magnitude, and type (specifically, the focal mechanism). The NEIC also maintains a global catalog of earthquakes above magnitude-4.5, and for this, they use about 2,100 seismic stations that include the GEOSCOPE and GEOFON networks, as well as GSN. These networks operate many remote stations that the NEIC uses for automatically detecting earthquakes and are especially important for rapidly characterizing earthquakes that occur under the oceans, where seismic data (and stations) are sparse (Figure 1).
The largest earthquakes that strike our planet—greater than magnitude-8—typically occur at timescales of tens to hundreds of years. Considering that seismographs have only been available for the past 120 years or so, records of such events are limited compared to their smaller-magnitude siblings.
Since 1900, two temporal clusters of great earthquakes have occurred—from 1950-1965, and 2004-2011 (though once aftershocks are considered, the degree to which the earthquakes cluster is less certain). Caught by the WWSSN, the first cluster includes the great magnitude-9.5 Valdivia earthquake of 1960 in Chile and the magnitude-9.2 Alaska earthquake of 1964. As mentioned in Part I of this Science Highlight series, very broadband seismology was developed in the 1970s, and not part of the WWSSN. Thus, seismologists collected the first extensive very broadband ground motion data for the second cluster of earthquakes, which included the magnitude 9.1-9.3 2004 Sumatra earthquake and the magnitude-9.1 2011 Tohoku earthquake.
An important finding from the second spate of great earthquakes is the existence of a very long-period (low frequency, long wavelength) seismic wave that begins to arrive at about the same time as the P-wave—the W-phase. Certain earthquakes—often the great ones—have long, slow ruptures that don’t radiate the typical high frequency seismic waves. In such cases, the earthquake's potential to generate tsunamis can be underestimated by relying on the high-frequency signal. As it turns out, the W-phase helps to quickly identify such large events to issue a tsunami warning in a timely manner, says Ringler, about 15 to 20 minutes after we know we have an earthquake.
Some seismic waves travel through Earth's interior, called body waves. These are the familiar P-waves and S-waves. Other waves travel around Earth’s outermost shell. These are surface waves, like the rolling Rayleigh waves and the rippling Love waves.
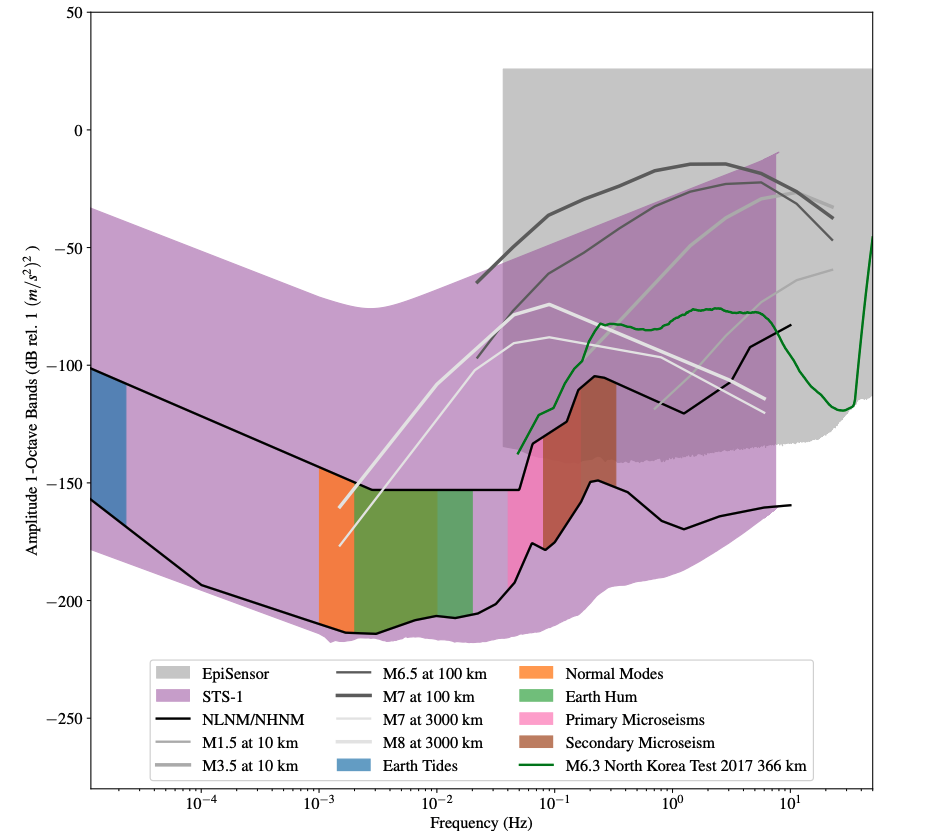
Periods shorter than about one hour but longer than 100 seconds showcase Earth's normal modes (Figure 2), in which the entire Earth rings after large earthquakes, like a bell. Such signals—distinct from higher frequency surface and body waves—are only discernible at stations with exceptionally low noise—often GSN or GEOSCOPE stations. These signals can detect variations in density and rigidity, among other characteristics, at a variety of depths.
The above-mentioned magnitude-9.5 1960 Valdivia earthquake released so much energy that the normal modes—detected by WWSSN seismic stations as well as others around the world—facilitated scientists’ discovery that Earth’s internal lateral structure varied at a given depth. For example, the boundary between the upper and lower mantle isn't a sphere, but rather varies with depth.
Studies exploiting normal modes have helped refine broad structures of the mantle and core, in part because normal modes are globally observed, and are less sensitive to geographic data coverage than body or surface waves. In the mantle, normal modes are sensitive to density changes—important when considering mantle movements, and for estimating Earth’s density profile. Several normal modes specifically probe the core-mantle boundary and could help determine what light elements hide within Earth's iron-nickel center.
Studies that combine these different signals—body, surface and normal modes—can further illuminate Earth's large-scale structures. Early, one-dimensional global Earth models, like the Preliminary Reference Earth Model, or PREM, used body waves and normal modes. Thanks in part to long-term data collected from around the world by both global and regional networks, new generations of global, three-dimensional Earth models, like GLAD-M25, use body and surface waves, matching the data squiggle by squiggle, says Ringler, in what's called full-waveform inversion. Such intensive computations have been possible because of advances in computational abilities as well as innovations in algorithms.
On July 16, 1945, the U.S. detonated the first nuclear device south of Los Alamos, New Mexico. Dubbed the Trinity test, it sparked a new use for seismic data. Since the U.S. bombed Japan’s Hiroshima and Nagasaki, seven other countries have acknowledged their own nuclear tests—the Soviet Union, the United Kingdom, France, China, India, Pakistan, and North Korea.
In 1970, the Non-Proliferation of Nuclear Weapons Treaty, or NPT, evolved to impede the spread of weapons between countries, and is linked to the Comprehensive Test Ban Treaty, or CTBT. As of March, 2022, 191 countries had ratified the NPT, more than any other treaty. The CTBT has been signed by 186 countries as of August 2022.
Beginning in 1996, extensive monitoring efforts began to ensure compliance. This includes the International Monitoring System, or IMS, which comprises seismic stations used to track potential nuclear tests. Of the 170 stations that the IMS uses, 48 are part of either the GSN or GEOSCOPE. It is imperative that the IMS collect high quality data to accurately pinpoint the locations of seismic events that might be explosions because of strict parameters specifying the area in which a formal on-site inspection can occur.
Before 1996, more than 2,000 nuclear test explosions were monitored using far flung seismic stations. Adding regional stations to the IMS improved monitoring capabilities, but GSN data have continued to provide important information to ensure that potentially problematic events are properly understood. In other words, GSN data can, and have, helped differentiate between earthquake versus explosion, but there is no single measure that can discriminate between the two.
Today, seismology is helping to tackle a variety of questions that pertain to signals not within the solid Earth. For example, many stations also contain magnetotelluric sensors, and by combining magnetotelluric information with seismic signals, scientists can see high-latitude geomagnetic storms that stem from the sun. Studies focusing on longer period signals, like the microseisms, which were long considered undesired noise in seismograms, now help scientists unravel the tracks of typhoons. Seismic stations can even trace the movement of ice, in a relatively nascent field of study called cryoseismology.
These global networks of seismographs have succeeded at several tasks, including imaging Earth’s interior, quantifying plate boundaries, and reducing impacts of geological hazards, says Ringler. The future of seismology is full of fascinating topics, and the global seismographic networks—GSN, GEOSCOPE, and others—will be there watching, listening, and collecting, for as long as we maintain them.
Citations:
Ringler, A. T., Anthony, R. E., Aster, R. C., Ammon, C. J., Arrowsmith, S., Benz, H., ... & Yeck, W. (2022). Achievements and Prospects of Global Broadband Seismographic Networks after 30 Years of Continuous Geophysical Observations. Reviews of Geophysics, e2021RG000749.
