
By Dr. Alka Tripathy-Lang
Scientists at Oregon State University have used magnetotelluric imaging to investigate Earth’s structure beneath the southeastern United States and compared their findings to those from seismic imaging studies, with results published in the June issue of Geochemistry, Geophysics, Geosystems (Murphy and Egbert, 2019). In previous studies, researchers interpreted pockets of relatively slow seismic velocities as evidence for thin, broken-up lithosphere. However, magnetotelluric imaging supports a thick, coherent lithospheric block instead. Murphy and Egbert (2019) reconcile these seemingly contradictory datasets by considering grain boundary effects. Their results demonstrate that both datasets are consistent with the second view—that the southeastern US is underlain by thick lithosphere.
The lithosphere is Earth's cold, rigid outer layer, and consists of both crust and uppermost mantle. It sits on the asthenosphere, which is hot and tends to flow instead of break. The thickness of the lithosphere varies, and geophysicists can calculate these changes by measuring parameters that vary with temperature. The results of such studies guide geophysicists as they map the boundary between the lithosphere and asthenosphere, Earth’s outermost layers.
The velocity, or speed, of seismic waves as they travel through the earth is strongly controlled by temperature, making seismic wave velocity measurements ideal for determining temperature variations in the subsurface. If seismologists see a seismically “fast” anomaly, it is usually interpreted as cold, whereas “slow” is hot.
However, to define an anomaly — be it hot, cold, fast or slow — a value for “normal” must be assumed. Benjamin Murphy, lead author of this study, says that “in seismic tomography, ‘normal’ is often defined by a reference model. [Reference models] are global averages that do not necessarily correspond to a meaningful physical or chemical state [at a specific location].” Therefore, a seismically slow region that seems hot based on its reference model may, upon further examination, be colder than expected.
The study of magnetotellurics involves measuring the electric and magnetic fields at Earth’s surface to infer subsurface resistivity (the inverse of conductivity), Murphy explains. To understand conductivity, think of copper wires used to efficiently transmit, or conduct, electricity. Copper is highly conductive. These wires are typically wrapped in an insulating material to protect from electric shocks. Such insulators are poor conductors, and are resistant to the flow of electricity, making them highly resistive.
Similarly, rocks conduct electricity with varying efficiency. Gary Egbert, coauthor of this study, explains “The rocks which make up the lithosphere are intermediate – they conduct electricity, but much more poorly than a metal like copper. Conductivity of rocks may depend on many factors, including how much water they contain. But, in most dry rocks, conductivity is controlled by temperature, with higher conductivity (lower resistivity) in hotter rocks.”
 Upper limit to resistivity
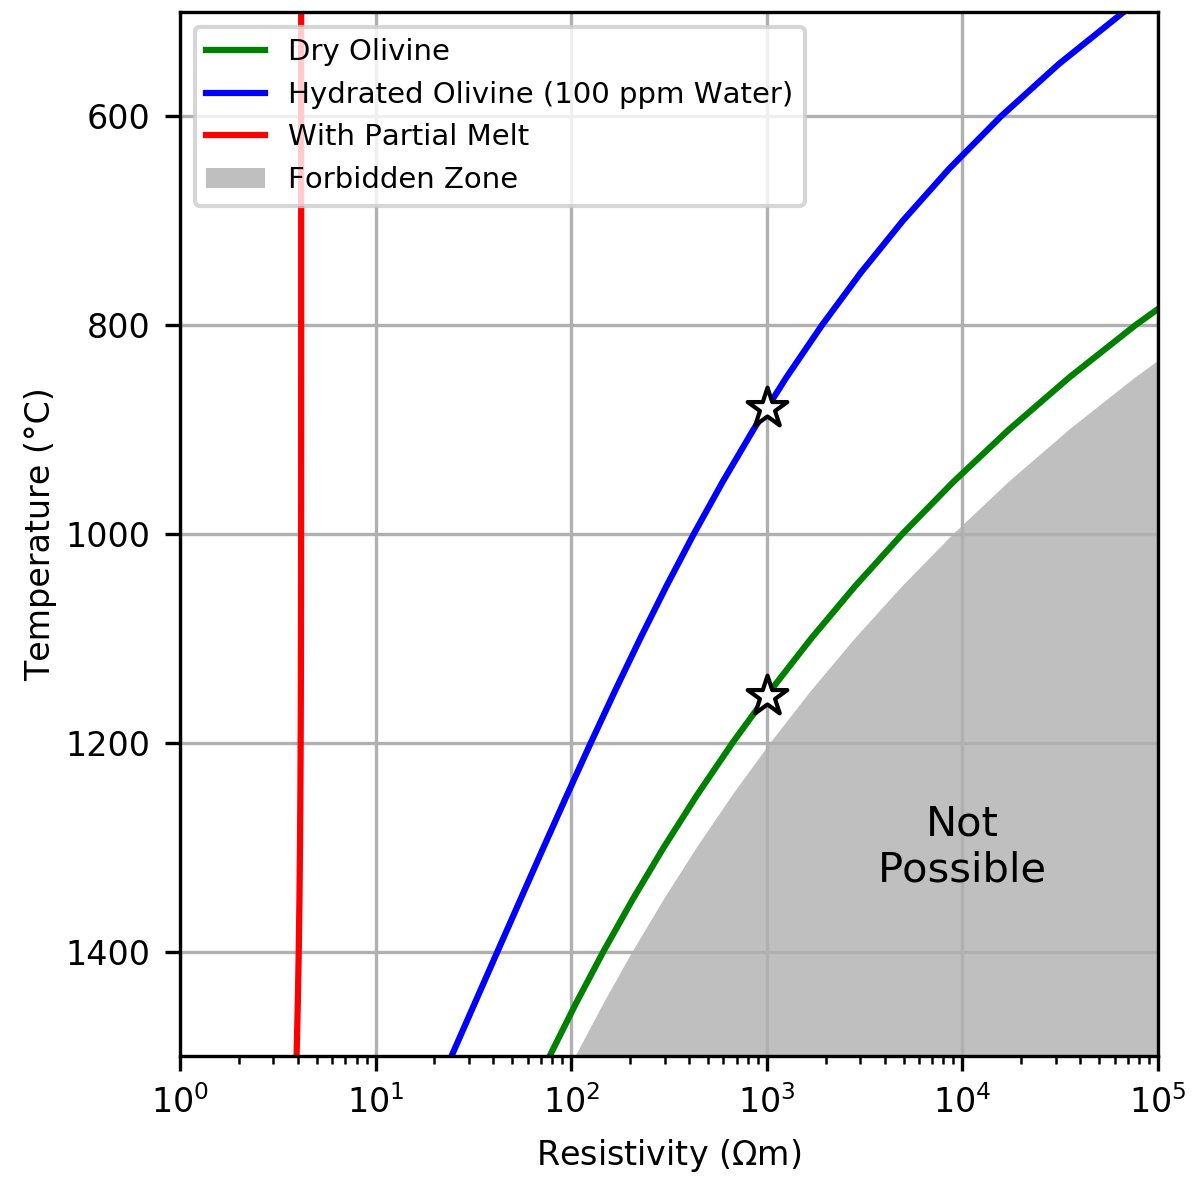
In the mantle lithosphere, there is an upper limit to how resistive a rock can be for a given temperature (Figure 1). This theoretical limit, quantified by many laboratory experiments, creates a “forbidden zone,” where high resistivity values can never be observed at high mantle temperatures, says Murphy. In other words, the higher the resistivity for a given rock, the lower the possible maximum temperature.
The rock can, however, be colder than the maximum allowed temperature, and just how cold depends on a variety of factors, like dissolved water content. Increasing dissolved water content tends to decrease resistivity (or increase conductivity). Murphy explains that a given resistivity value could either indicate a dry rock at or near the maximum temperature limit (star on green curve in Figure 1), or a rock with some water at a much lower temperature (star on blue curve in Figure 1). However, he says “In the mantle, there are known bounds on expected temperatures, and the low temperature cases can often be ruled out so that rocks with high resistivity must be dry.”
Several seismic studies of the southeastern United States hypothesize the existence of thin, broken-up lithosphere, wherein pockets of seismically slow regions, interpreted to be hot, are at relatively shallow depths. This interpretation suggests a shallow lithosphere-asthenosphere boundary.
On the other hand, magnetotelluric measurements show that resistivity is so high that the rocks must be cold, and these colder temperatures disagree with conclusions from seismic velocity studies. These high resistivity values place the lithosphere-asthenosphere boundary ~200 km deep, far deeper than any seismic velocity study.
To explore the apparent disconnect between the two datasets, Murphy and Egbert (2019) looked carefully at data from both methods, available through IRIS. In particular, they focused on factors that can influence seismic wave speed; they found that by taking into account grain boundary effects, seismic velocities decrease enough to eliminate the discrepancy between the two imaging methods.
Murphy explains, “we calculated the expected seismic velocity at cold temperatures required by magnetotellurics using models of inelasticity, and found that those predictions generally matched the observations.” To explain inelasticity, Egbert elaborates, "the grains slip and slide relative to each other along the boundaries, making the material more ‘mushy’ and thus slowing down the seismic waves.”
Interpretations from seismic velocity data alone are geologically problematic, according to Murphy and Egbert (2019), because the southeastern United States has been a passive margin for the last 200 million years. Aside from highly localized events, no geologic phenomenon has affected this entire region since that time, which is difficult to reconcile with broken-up continental lithosphere.
Instead, Murphy and Egbert call upon a massive outpouring of igneous activity ~200 million years ago that accompanied the rifting, or tearing apart, of the supercontinent Pangea along the very sutures that stitched it together. Called the Central Atlantic Magmatic Province, it is a large igneous province that can be found along the margins of all continents that face the Atlantic.
In the southeastern United States, measured resistivity values are so high that the mantle lithosphere in this region is not only cold, but also must lack dissolved water (Figure 2). The lack of dissolved water is easily explained by the generation of melt associated with the Central Atlantic Magmatic Province. The massive amount of melt generated in this event would dehydrate the rocks left behind in the mantle lithosphere because water has a strong affinity for melt.
Therefore, the Central Atlantic Magmatic Province provides a logical mechanism for creating a thick, dry, cold lithosphere in the southeastern United States, as indicated by magnetotelluric images and reinterpreted seismic wave speed observations.
Figure 1 (Above). Resistivity, obtained by magnetotelluric imaging, as a function of temperature for different compositions. The gray region in the lower right indicates physically impossible temperatures for a measured resistivity value, based on laboratory results. In other words, at high resistivity, higher temperatures are not possible. The green and blue curves for dry and wet olivine, respectively, are shown because olivine is a proxy for the bulk upper mantle. The stars on the curves show how at a given resistivity, temperature decreases with increasing water content. Figure courtesy of Benjamin Murphy, modified from Murphy and Egbert (2019).
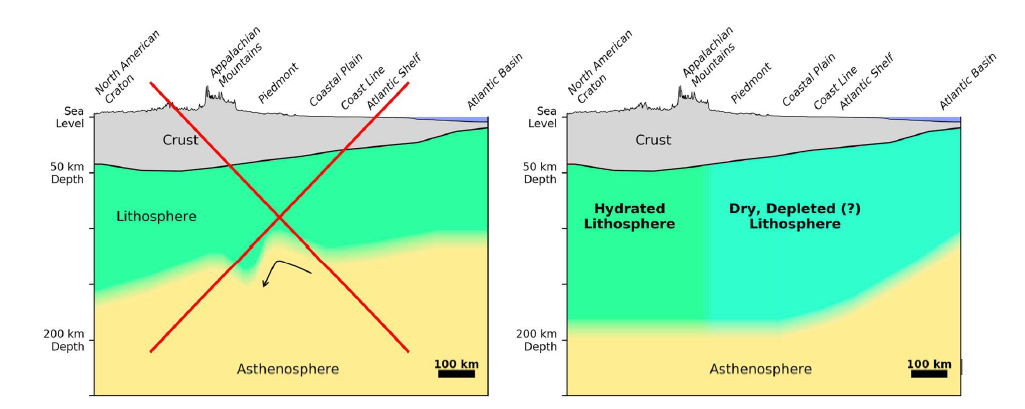
Figure 2. Interpretation from seismic results alone (left) and jointly interpreted seismic and magnetotelluric results (right). The magnetotelluric data preclude the seismic-only derived interpretation of lithospheric erosion along the passive margin to explain relatively thin, broken up lithosphere. Instead, magnetotelluric data, supported by reinterpreted seismic data, indicate that the thermal lithosphere beneath the southeastern United States is thick (~200 km) and coherent. Figure from Murphy and Egbert (2019).
Citation:
Murphy, B. S., & Egbert, G. D. (2019). Synthesizing seemingly contradictory seismic and magnetotelluric observations in the southeastern United States to image physical properties of the lithosphere. Geochemistry, Geophysics, Geosystems, 20. https://doi. org/10.1029/2019GC008279
